

Abstract
The cystic fibrosis transmembrane conductance regulator (CFTR) is a chloride channel and key regulator of epithelial functions. Mutations in the CFTR gene lead to reduced or dysfunctional CFTR protein and cause cystic fibrosis (CF), a generalized exocrinopathy affecting multiple organs. In the airways, loss of CFTR function leads to thickened mucus, reduced mucociliary clearance, chronic infections, and respiratory failure. Common airway disorders such as bronchitis and chronic obstructive pulmonary disease (COPD) also present CF-like symptoms such as mucus congestion and chronic inflammation without mutations in CFTR. The primary risk factors for COPD and chronic bronchitis include environmental stress insults such as pollutants and infections that often result in hypoxic conditions. Furthermore, environmental factors such as cigarette smoke and reactive oxygen species have been implicated in reduced CFTR function. Activation of cellular stress responses by these factors promotes differential, stress-associated gene expression regulation. During our investigations on the mechanisms of CFTR expression regulation, we have shown that the ER stress response, the unfolded protein response (UPR), decreases CFTR expression at the transcriptional, translational, and maturational levels. Here, we provide a detailed description of the methods we employ to study CFTR expression regulation by the UPR. Similar approaches are applicable in studies on other genes and how they are affected by the UPR.
1. Introduction
Mutations in the cystic fibrosis transmembrane conductance regulator (CFTR) gene result in reduced or dysfunctional CFTR protein and cause cystic fibrosis (CF). CFTR is a multidomain, membrane glycoprotein that functions as a chloride channel at the cell surface (Riordan and Chang, 1992; Schwiebert et al., 1999). CFTR has also been shown to regulate the epithelial sodium channel (ENaC; Berdiev et al., 2009; Ismailov et al., 1996), plasma membrane recycling (Bradbury et al., 1992), macrophage function (Di et al., 2006), and plays a significant role in the assembly of cell surface signaling complexes in epithelial cells (Naren et al., 2003). Since the discovery of the CFTR gene in 1989, it has become evident that proper CFTR function is crucial for the physiology of epithelial tissues in multiple organs with the most significant CFTR function in the excretory glands (for review, Bebok and Collawn, 2006; Quinton, 2007; Riordan, 2008).
The majority of CF (>75%) is caused by the deletion of three nucleotides resulting in the loss of phenylalanine at the 508 position of the CFTR protein (ΔF508 CFTR; Kerem et al., 1989). ΔF508 CFTR misfolds during biogenesis and is eliminated by the endoplasmic reticulum-associated degradation (ERAD) machinery (Cheng et al., 1990; Ward et al., 1995). Premature termination codons (PTC), UAA, UAG, or UGA are responsible for ~10% of CF cases (Collawn et al., 2010; Kerem et al., 2008). PTCs generate unstable, truncated mRNA, from which nonfunctional or toxic proteins are translated (Frischmeyer and Dietz, 1999). A small fraction of CF cases (<10%) is caused by a variety of more than 1700 rare mutations in CFTR (http://www.genet.sickkids.on.ca/cftr). Because the outcome of the mutations is reduced CFTR function, determining the level of CFTR necessary to ameliorate the symptoms of CF and understanding CFTR expression regulation during pathological conditions will be crucial for the development of any potential therapy.
The most prevalent complications of CF develop in the lungs and gastrointestinal tract. While symptomatic treatments have significantly improved the gastrointestinal complications, in the airways, mucus congestion and reduced mucociliary clearance promote the development of chronic bacterial infections that lead to respiratory failure (for review, Collawn et al., 2010; Rowe et al., 2005). Chronic airway disorders such as chronic bronchitis and COPD present CF-like symptoms that are characterized by thick mucus, reduced mucociliary clearance, and inflammation (Liu et al., 2005; O’Byrne and Postma, 1999). Therefore, CFTR has become one of the central genetic risk factors associated with asthma and COPD (Dahl and Nordestgaard, 2009; van der Deen et al., 2005). However, most of the previous studies have concentrated on mutations and genetic variations without considering the effects of environmental factors and their role in epigenetic gene expression regulation.
Our initial studies suggested that CFTR expression is regulated by cell culture conditions (Bebok et al., 2001) and epithelial cell differentiation (Bebok et al., 1998). It is now clear that cigarette smoke (Cantin et al., 2006b), reactive oxygen nitrogen species (RONS; Bebok et al., 2002), oxidant stress (Cantin et al., 2006a), and hypoxia (Guimbellot et al., 2008) promote COPD and reduce CFTR expression and function. Furthermore, the environmental factors that reduce CFTR expression also activate cellular stress responses that promote cell recovery and reestablish physiological function (Kultz, 2005). Therefore, these studies emphasized the importance for understanding the mechanism of endogenous CFTR expression regulation by cellular stress responses in epithelial cells.
Based on the central role of the ER in membrane protein synthesis, we focused our efforts on the ER and the ER stress response, the UPR (Schroder and Kaufman, 2005). Our studies indicated that the UPR reduced endogenous, but not recombinant CFTR mRNA levels, and this effect was not related to mRNA stability (Rab et al., 2007). Subsequent studies confirmed that CFTR transcription is inhibited through epigenetic mechanisms triggered by the UPR and involve the binding of ATF6 to the minimal promoter of CFTR, as well as histone deacetylation and promoter methylation. We now know that transcriptional repression as well as enhanced ERAD (reduced maturation) minimize cell surface CFTR levels and function (Bartoszewski et al., 2008b). Surprisingly, the UPR-associated transcriptional repression of genes is not a generalized process since only a small fraction of genes is repressed during ER stress (Bartoszewski and Bebok, unpublished observations).
Considering the fact that asthma, chronic bronchitis, and COPD are the most frequent chronic airway disorders associated with cellular stress, understanding how the expression of key transporters such as CFTR is regulated during cellular stress responses is an important consideration in any potential therapeutic intervention. Here, we provide a detailed technical roadmap for investigating CFTR expression regulation by the UPR. A model illustrating UPR-associated CFTR expression regulation is presented in Fig. 1.1.
Figure 1.1.

Regulation of CFTR expression by the UPR. The three main pathways of the mammalian UPR and their identified associations with endogenous CFTR expression regulation are shown (based on Bartoszewski et al., 2008b; Rab et al., 2007). CRE, cAMP response element; MAZ, Myc-associated zinc finger protein binding; Y-box binding, Y-box protein binding; ATG, transcription start.
2. Methods
2.1. ER stress induction and the assessment of UPR activity
Several methods that interfere with normal cellular processes have been shown to induce ER stress and activate the UPR. Here, we describe the use of proteasome and glycosylation inhibitors as ER stress inducers.
2.1.1. ER stress induction
Proteasome inhibition (ALLN or epoxomycin; Hong et al., 2004; Rab et al., 2007) or glycosylation inhibition (tunicamycin (TM); Bartoszewski et al., 2008a; Hung et al., 2004) can be used to induce ER stress. Cells are grown under standard tissue culture conditions. The number of cells used for each experiment should be determined based on RNA content (see below). Time course studies in several cell lines indicate that 100 μM ALLN (Sigma) or 20 μM epoxomycin (BIOMOL) treatment for 8–12 h is sufficient to induce ER stress, activate the UPR and cause significant reduction in CFTR mRNA levels (Bartoszewski et al., 2008a,b; Rab et al., 2007). TM (Sigma) treatment for 12–14 h at 5 μg/ml (final concentration) is sufficient in most cases (Bartoszewski et al., 2008a,b; Nadanaka et al., 2004; Rab et al., 2007).
2.1.2. RNA isolation from human airway epithelial cells
For all mRNA measurements, total RNA is isolated from control and ER-stressed cells. UPR reporters, internal controls, and CFTR mRNA are amplified using specific probes described below. Here, we describe the steps of total RNA isolation.
2.1.2.1. Materials and equipment
RNeasy Mini Kit (Qiagen), buffers (RLT, RW1, RPE are supplied with kit), PBS (KCl 2.7 mM, KH2PO4 1.5 mM, NaCl 138 mM, Na2HPO4·7H2O 8 mM, pH 7.4, Gibco), RNase-free DNase (Qiagen), 14.3 M β-mercaptoethanol, sterile, RNase-free pipette tips (ART), microcentrifuge (with rotor for 2 ml tubes), 96–100% ethanol (molecular biology grade, Sigma), 70% ethanol (molecular biology grade, Sigma), 10-cm cell culture dishes (Corning), tissue culture media (cell type specific). All materials are sterile and RNase free.
2.1.2.2. Before starting
Determine the sufficient number of cells for each experiment. Based on the binding capacity of the RNeasy spin column (100 μg of RNA), the minimum number is ~100 cells and the maximum number of cells depends on the RNA content. Examples: (1) high RNA content (COS-7 cells, ~35 μg of RNA/106 cells); (2) average RNA content (HeLa and Calu-3 cells, ~15 μg of RNA/106 cells); (3) low RNA content (NIH/3 T3, ~10 μg of RNA/106 cells). The starting cell number should not exceed 3–4 ~ 106 cells. The cell number can be determined in pilot experiments. The optimal confluency of cells for the experiments should also be determined based on the time required for treatments (e.g., ER stress induction). Cell confluency should not exceed 90% at the time of RNA isolation in order to maximize the RNA content.
2.1.2.3. RNA isolation
Isolate RNA as described in the Qiagen RNeasy Mini handbook (04/2006, pp. 27–30). The individual steps are described below. RDD, RPE, RLT, and RW1 buffers are supplied with the kit. All experimental steps are performed at room temperature unless stated otherwise.
Remove media from cells (~90% confluent, grown on 100-mm cell culture dishes, ~4 × 10⁶ cells or 90–100 μg of RNA); wash the cells twice with ice-cold PBS (2 ml/wash). Lyse the cells in 600 μl of RLT buffer (prior to use add 10 μl of β-mercaptoethanol/ml of RLT buffer) and collect the lysate with a pipette. The cell lysate can be stored at −70 °C for several months. Prior to further processing, samples should be thawed quickly at 37 °C and centrifuged for 5 min at 5000×g to remove the insoluble material. Add an equal volume of 70% ethanol (~600 μl) to the cell lysate, mix by pipetting, transfer the resulting mixture in 700 μl aliquots onto RNeasy spin columns and centrifuge for 30 s at 8000×g. Discard the flow-through material. Wash the columns with 350 μl RW1 buffer (centrifuge for 30 s at 8000×g and discard the flow-through material). Add 80 μl, freshly prepared DNase I incubation mix (10 μl DNase I stock solution, 3 K units/μl mixed with 70 μl RDD buffer, Qiagen) to the columns. Incubate the columns with DNase I-containing solution for 20 min at room temperature. Wash the columns with another 350 μl of RW1 buffer (Qiagen) and place the columns in new collection tubes (supplied with the kit) and wash with 500 μl of RPE (Qiagen) buffer. Centrifuge 15 s at 8000×g and discard the flow-through material. Repeat the 500 μl of RPE buffer wash step, centrifuge for 2 min at maximum speed, and discard the flow-through material. To ensure removal of residual ethanol from the column, spin the columns for additional 2 min at maximum speed. Place the columns in fresh collection tubes and add 30 μl of RNase-free water to the center. Incubate at room temperature for 1 min and centrifuge for 1 min at maximum speed to elute RNA. Discard the columns and measure RNA concentration and purity in the eluted solution by measuring absorbance at 260 (A260) and 280 nm (A280). At neutral pH, an A260 reading of 1 equals 44 μg/ml RNA. The A260/A280 ratio for pure RNA is between 1.9 and 2.1.
2.1.3. Semiquantitative RT-PCR using ABI 7500 Real-Time PCR System
Equipment and materials
ABI 7500 Real-Time PCR System, RNase-free sterile pipette tips, RNase-free water, 96-well reaction plate (ABI), TaqMan One-Step RT-PCR Master Mix Reagents (ABI), 10-cm cell culture dish (Corning). All steps are performed on ice unless stated otherwise. The optimum RNA concentration in the samples is 50 ng/μl. RNase-free water can be added to adjust RNA concentration. Using 50 ng/μl RNA stock solutions will result in 10 ng/μl final RNA concentration in the reaction mixture. This total RNA concentration allows efficient CFTR mRNA quantification from a broad spectrum of epithelial cell lines such as Calu-3, T-84, CFPAC-1 (Bartoszewski et al., 2008b; Rab et al., 2007). All samples, including internal controls, should be run in triplicate. Experiments include a 5-point, logarithmic standard sample dilution row (100–10−5) for both CFTR and the endogenous control. When cells with minimal CFTR expression are tested, a standard dilution row of 100–10−2.5 should be added. The standard curves aid in determining primer efficiency and calculation of CFTR mRNA levels. Controls without mRNA (no template controls, NTC) should also be included.
The reaction mixture consists of 5 μl total mRNA template; 12.5 μl, 2× Master Mix (ABI); 0.625 μl, 40× Multiscribe RNase Inhibitor Mix (ABI); 1.25 μl, CFTR or endogenous control primer probes (20×); and 5.625 μl RNase-free water. Calculate the volume of RT-PCR reactions and prepare stock solution for each primer (UPR reporter, CFTR, and internal control). Mix all compounds except the RNA template and dispense 20 μl of the mix into individual wells of the PCR plate. Add 5 μl of the total RNA templates. Centrifuge the plate briefly and perform one-step RT-PCR under the following conditions: reverse transcription at 48 °C for 30 min, DNA polymerase activation at 95 °C for 10 min, followed by 40 cycles of denaturation at 95 °C for 15 s and annealing extension at 60 °C for 1 min. Fluorescence data collection is performed during the 60 °C step. Calculate the CFTR mRNA levels relative to endogenous control using the relative standard curve method (ABI 2004 Guide to Performing Relative Quantification of Gene Expression Using Real-Time Quantitative PCR).
2.1.4. Assessment of UPR reporter (spliced XBP1 and BiP/HSPA5) mRNA levels by semiquantitative RT-PCR
To determine the effects of ER stress on CFTR expression, we first monitor changes in UPR reporters to confirm that ER stress has occurred, the UPR is activated, and then assay for changes in CFTR mRNA levels (Rab et al., 2007). We routinely measure spliced XBP1 (sXBP) and BiP mRNA levels as reporters of UPR activity (Bartoszewski et al., 2008a,b; Rab et al., 2007). The mammalian UPR is activated through the ER-resident reporters PERK, ATF6, and IRE1α (Schroder and Kaufman, 2005). When the UPR is activated, IRE1α splices the XBP1 mRNA to produce the XBP transcription factor (Yoshida et al., 2001). Activation of all three pathways leads to increased chaperone levels including BiP (Lee, 2005).
Primer probes
HSPA5/BiP (assay ID: Hs00607129_gH) and sXBP1 (assay ID: Hs00231936_m1) are used as UPR reporters. GAPDH (ABI, assay ID: Hs99999905_m1) or 18S rRNA (ABI, assay ID: HS_99999901_m1) are used as internal controls.
2.2. The effects of the UPR on CFTR mRNA levels
Stable, recombinant CFTR-expressing cell lines are widely used to study different aspects of CFTR biogenesis and proteomics (Bebok et al., 2005; Carvalho-Oliveira et al., 2004; Gomes-Alves et al., 2009; Sheppard et al., 1994). However, these models are not suitable for studying transcriptional regulation of CFTR since the recombinant construct lacks the native promoter and regulatory regions. In our studies, we have tested a combination of recombinant and endogenous CFTR-expressing cell lines in order to dissect the different aspects of CFTR biogenesis (Bartoszewski et al., 2008b; Bebok et al., 2005; Rab et al., 2007; Varga et al., 2004). Furthermore, we developed cell lines expressing both endogenous and recombinant CFTR to study the differences in the regulation of the two variants (Bartoszewski et al., 2008a).
2.2.1. Measurement of CFTR mRNA levels
Epithelial cell lines from airways (Calu-3, 16HBE14o-), intestines (T 84, HT29), or primary airway epithelial cell cultures can be used for studies on endogenous CFTR expression regulation. Stable, recombinant CFTR-expressing cell lines such as CFBE41o-ΔF, CFBE41o-WT (Bebok et al., 2005), BHK (Carvalho-Oliveira et al., 2004; Gomes-Alves et al., 2009), or other model cell line such as HeLa-WT (Bartoszewski et al., 2008a; Bebok et al., 2005; Rab et al., 2007) can be used for recombinant CFTR mRNA measurements.
Probes
CFTR mRNA levels can be evaluated using assay on demand primer mix (ABI Assay ID: Hs00357011_m1). GAPDH (assay ID: Hs99999905_m1) or 18S RNA (ID: Hs99999901_s1) can be amplified as internal controls from the samples. We also tested Transferrin receptor (TR) mRNA levels following UPR induction and found no changes in message levels (Rab et al., 2007). TR mRNA levels can be determined using assay ID: Hs99999911_m1.
2.2.2. Determination of CFTR mRNA stability
Reduced CFTR mRNA levels in response to UPR activation could result from inhibited transcription or from enhanced mRNA decay. Therefore, it is necessary to determine possible changes in mRNA stability as the result of ER stress. RNA degradation, processing, and quality control are regulated mainly by the 3′ → 5′ribonucleolytic complex called exosome (Belostotsky, 2009; Schmid and Jensen, 2008). While it is unlikely that reduced endogenous CFTR mRNA levels result from an increase in exosome activity, since there is no reduction in recombinant CFTR mRNA levels or control mRNAs, a posttranscriptional modification of the endogenous CFTR mRNA during ER stress may cause a specific CFTR mRNA decay. The following assays help to determine whether changes in RNase activity and/or mRNA half-life contribute to reduced CFTR mRNA levels during ER stress.
2.2.2.1. Assessment of cytoplasmic RNase activity
Equipment and materials
Microcentrifuge (with rotor for 2 ml tubes), ultracentrifuge (Beckman TL-100 or equivalent), and Potter–Elveheim homogenizers. Cells are grown on 10-cm tissue culture dishes (~80% confluent). Hypotonic homogenization buffer (10 mM KCl, 10 mM HEPES, pH 7.4, and 1 mM MgCl2). Total RNA isolated from untreated cells as described in Section 2.1.2. RNase digestion buffer (2×): 0.6 M NaCl, 20 mM Tris, 10 mM EDTA, pH 7.4.
Cytoplasmic protein extraction
All steps are performed in an RNase-free environment. Following induction of ER stress (Section 2.1.1), cells are washed three times with ice-cold PBS, scraped into homogenization buffer (600 μl) with protease (Protease Inhibitor Complete Mini, Roche) and phosphatase inhibitors (Sigma), and incubated for 30 min at 4 °C. Cells are then homogenized using Potter homogenizer and unbroken cells are removed by centrifugation at 2500×g for 15 min. The supernatant is then separated into membrane and cytosolic components by a 1 h centrifugation at 100,000×g (Beckman TL-100 or equivalent). Following determination and normalization of protein concentrations, cytoplasm extracts should be used immediately for RNA incubation experiments. The total amount of cytoplasmic protein obtained from Calu-3 cells grown to 80% confluency on 10-cm tissue culture dishes is ~700–800 μg. Each RNA incubation reaction contains 20 μg cytoplasmic protein extract in a total of 30 μl reaction mixture. RNA incubation reactions are performed at least in triplicate.
Incubation of RNA samples with cytoplasmic proteins
Incubate total RNA isolated from control, untreated cells (20 μg RNA/sample in 30 μl 2× RNase digestion buffer) with an equal volume of cytosolic protein extract (20 μg total proteins/sample) under gentle stirring at 25 °C for 20 min. At the end of incubation, stop the RNase reaction with 300 μl TRIzol (Invitrogen). Important controls include samples without RNA in the RNase digestion buffer, and RNA solution without cytoplasmic protein extracts. Following the incubation, RNA is extracted from samples to determine the remaining CFTR mRNA levels.
Extraction of remaining RNA from samples
RNA extraction is performed using the protocol described in Section 2.1.2.
Compare CFTR mRNA levels following cytoplasmic RNase digestion
CFTR mRNA content following RNase digestion is determined by real-time RT-PCR using the protocol described above for total CFTR mRNA (Section 2.2.1). Enhanced RNase activity in the cytoplasmic fraction following induction of ER stress would result in reduced CFTR mRNA levels compared to controls. In our experience, there is a ~20% reduction in the CFTR mRNA levels as the result of baseline RNase activity in the control, untreated samples (Baudouin-Legros et al., 2005; Rab et al., 2007).
2.2.2.2. CFTR mRNA half-life
Equipment and materials
Actinomycin D (Sigma A1410), TM from Streptomyces sp. (Sigma T7765), 18S primer probe mix—assay ID: HS_99999901_m1 (ABI), CFTR primer probe mix—assay ID: Hs00357011_m1 (ABI). ABI 7500 Real-Time PCR System and supplies (see above).
Protocol
Unless stated otherwise, all steps are performed on ice. Parallel experiments are performed on mRNA samples isolated from control (untreated) and ER-stressed cells (Section 2.1.1). Cells are cultured on 10-cm plastic dishes to 80% confluency. Actinomycin D is added at 5 μg/ml final concentration after 8 h of ER stress induction to stop transcription. Isolate RNA (according to protocol in Section 2.1.2) 2, 4, 6, and 8 h following actinomycin D treatment. Total CFTR mRNA levels at each time point are assessed using one-step RT-PCR and normalized to endogenous 18S rRNA levels as described in Section 2.1.2. CFTR mRNA levels for each time point are calculated from three individual samples. Relative CFTR mRNA levels at the time points indicated are plotted as percent differences from CFTR mRNA levels at the initial time point (t0). The mRNA half-lives can be calculated from the exponential decay using the trend line equation C/C0 = e −kdt (where C and C0 are mRNA amounts at time t and at time 0 (t0), respectively, and kd is the mRNA decay constant; Bartoszewski et al., 2008b). A typical plot of the results is shown in Fig. 1.2.
Figure 1.2.

CFTR mRNA half-life measurements. A representative plot of CFTR mRNA half-life measurements is shown. mRNA half-life is calculated based on the equation described in the text (Bartoszewski et al., 2008b).
2.3. Assays for CFTR transcriptional regulation
Our studies indicated no differences in endogenous CFTR mRNA stability following UPR activation (Bartoszewski et al., 2008a,b; Rab et al., 2007). Here, we provide detailed description of methods that were developed to test CFTR transcriptional activity and the mechanism of CFTR transcriptional repression during ER stress.
2.3.1. CFTR promoter reporter assay
Principle
Promoter reporter vectors contain a specified section of the promoter from the gene of interest upstream of a reporter gene such as Firefly luciferase. Panomics Inc. pioneered the development of basic promoter reporter vectors. Variants of these vectors can be developed to answer specific questions regarding transcriptional regulation. The CFTR promoter reporter vector from Panomics contains a ~1000 bp fragment of the human CFTR 5′ regulatory region upstream of the firefly luciferase gene (Bartoszewski et al., 2008b). Expression of firefly luciferase depends on the activity of the CFTR promoter. The promoter contains a cAMP responsive element (CRE) that can be activated by forskolin to increase luciferase expression by ~30% (Bartoszewski et al., 2008b). This provides the option for testing the functionality of the regulatory region. As an internal control for transfection efficiency, a Renilla luciferase vector can be used. The expression of Renilla luciferase is driven by a viral promoter and therefore, like the recombinant CFTR expression vectors, is not regulated by the UPR. The schematic of the CFTR promoter reporter vector is shown in Fig. 1.3.
Figure 1.3.

Schematic diagram of the CFTR promoter reporter vector. A CFTR promoter containing regulatory elements is shown. Restriction sites for cloning (NheI and BglII) are also labeled. CRE, cAMP response element; MAZ, Myc-associated zinc finger protein binding; Y-box, Y-box protein binding; ATG, transcription start (Bartoszewski et al., 2008b).
Materials and equipment
Cell lines without endogenous CFTR expression (HeLa, Cos-7), transfection reagent—Fugene™ 6 (Roche), Opti-MEM™ reduced serum media (Invitrogen), 6-well cell culture plates (Costar), Luciferase assay reagent (Promega), CFTR promoter reporter vector (Firefly luciferase, Panomics Inc.), Renilla luciferase control vector (Panomics Inc.), dual luciferase assay reagent kit (Promega), Luminometer.
Protocol
HeLa cells grown on 6-well tissue culture plates are transfected with the promoter reporter constructs and Renilla luciferase as described in the manufacturer’s protocol. At 12 h posttransfection, cells are treated with ER stress inducers (Section 2.1.1) or forskolin (to activate the CRE) for an additional 12 h. Control wells do not receive any treatment. Cells are washed in PBS, harvested, and lysed using luciferase assay lysis buffer (provided in Luciferase assay reagent kit). Luciferase activity is measured using dual luciferase assay reagent. To reduce error, at least four independent replicates should be measured. Results are presented as relative firefly luciferase/Renilla luciferase light units or percentage changes in light units compared to the untreated control.
2.3.2. Chromatin immunoprecipitation assays
Principle
Chromatin immunoprecipitation (ChIP) assays were developed to identify proteins (histones and transcription factors) that are associated with specific regions of genes (Rodriguez and Huang, 2005; Weinmann and Farnham, 2002). The initial step is the cross-linking of protein–protein and protein–DNA complexes in cells with formaldehyde. After cross-linking, the cells are lysed and sonicated to shear the DNA with the proteins attached. Proteins of interest such as transcription factors that are cross-linked to DNA fragments are subsequently immunoprecipitated. The immunoprecipitates contain a specific fragment of the gene, the transcription factor of interest, and very likely, other components of the transcriptional complex. After removal of the proteins from the DNA, the specific fragment of the gene is purified and identified using PCR amplification. Our first approach was to analyze the 1-kb fragment of the human CFTR 5′ regulatory region to find putative direct or indirect binding sites for the UPR-induced transcription factors XBP1 and ATF6. Then, we performed ChIP experiments to test the role of these transcriptional factors in CFTR transcriptional repression (Bartoszewski et al., 2008b).
Materials and equipment
Sonicator with microtip, water bath with shaker, or heat block with shaker capable of 65 °C heating and 450 rpm shakes, microcentrifuge for 1.5 ml tubes. Cell type specific tissue culture media (Invitrogen), TM from Streptomyces sp., TM (Sigma), DMSO (Sigma), NaCl (Sigma), Proteinase K (Sigma), EDTA (Sigma), 1 M Tris–HCl, pH 6.5, phenol–chloroform–isoamyl alcohol (25:24:1), pH 8.0 (Sigma).
Buffers
2× RIPA: 100 mM Tris–HCl, pH 7.4; 2% NP-40 (Sigma); 0.5% SDS (Sigma); 300 mM NaCl; 2 mM EDTA; 2 mM PMSF (Sigma); 2 μg/ml of aprotinin (Sigma); leupeptin (Sigma); pepstatin A (Sigma). Hypotonic buffer: 10 mM HEPES, pH 7.9 (Sigma); 1.5 mM MgCl2 (Sigma); 10 mM KCl (Sigma). LiCl buffer (10 mM Tris–HCl, pH 8.1; 0.25 M LiCl; Sigma); 1% NP-40; 1% Na-deoxycholate; 1 mM EDTA. Low salt: 0.1% SDS; 1% Triton-X-100; 2 mM EDTA; 20 mM Tris–HCl, pH 8.1; 150 mM NaCl. High salt: 0.1% SDS; 1% Triton-X-100; 2 mM EDTA; 20 mM Tris–HCl, pH 8.1; 500 mM NaCl. Qiagen MiniElute PCR purification kit (Qiagen). Elution buffer: 10.8 ml sterile, nuclease-free water; 1% SDS; 100 mM NaHCO3 (S5761 Sigma). TE buffer (Qiagen). PBS buffer (Invitrogen).
Protocol
Sample preparation and cross-linking
Epithelial cells (e.g., Calu-3; T-84) are grown on 20-cm tissue culture dishes to 80% confluence. Induce ER stress as described in Section 2.1.1. Nontreated cells serve as the controls. Exchange regular media with cross-linking solution that contains 275 μl of 37% formaldehyde in 10 ml of serum-free tissue culture media. Cover the cells with cross-linking solution and incubate at room temperature for 15–30 min. Aspirate the cross-linking solution, wash cells on ice with cold PBS, and scrape cells in 3 ml PBS/plate. Centrifuge cells at 200×g 10 min at 4 °C, discard supernatant, and resuspend cells in hypotonic buffer with fresh protease inhibitors added (950 μl/sample). Incubate cells on ice for 5 min and add 50 μl of 10% NP-40/sample (the final concentration of NP-40 is 0.5%), followed by an additional 5 min incubation on ice. Centrifuge samples at 1000×g for 10 min at 4 °C, discard supernatant, and resuspend the pellet (containing nuclei) in 2 ml/sample TE buffer with protease inhibitors. Samples can be stored at −80 °C for up to 2 weeks.
Sonication and determination of DNA content
Sonicate nuclei in 15-ml conical tubes on ice. Sonication times and settings need to be determined for each sonicator and cell line tested. Calu-3 cells require twenty 20-s pulses at 40% power using VibraCell sonicator with microtip (Sonics Materials). Chromatin fragmentation needs to be verified using agarose gel electrophoresis. The main DNA fraction after fragmentation should be in size range from 150 to 400 bp. Transfer samples into 2 ml Eppendorf tubes and centrifuge at 10,000×g for 15 min at 4 °C and measure DNA concentration in supernatant at A280nm. Aliquot samples into 5–10 units (1 unit = 100 μg DNA). Samples can be stored at −20 °C for several months.
Input preparation (to determine the quality of the samples)
Remove ~50 μg DNA from each sample and dilute with TE buffer to 500 μl followed by the addition of 20 μl of 5 M NaCl to each sample. Mix samples by vortexing and centrifuge at maximum speed in microcentrifuge for 1 min. Place samples into the shaker (450 rpm) incubator (65 °C) and shake overnight. Add protein digestion mix to the samples (10 μl 0.5 M EDTA, 20 μl 1 M Tris–HCl, pH 6.5, 2 μg Proteinase K) and incubate for 2 h at 37 °C in the shaker. To extract DNA, add 500 μl phenol–chloroform–isoamyl alcohol (25:24:1) pH 8.0 to each sample, mix well, and centrifuge at maximum speed (14,000 rpm) at 4 °C for 15 min. The upper aqueous phase contains the DNA. Transfer the DNA fraction to new tubes and purify by Qiagen MiniElute PCR purification kit as described in manufacturer’s instructions. Elute each sample with 50 μl of nuclease-free water (stored at −20 °C). These samples are used to test the quality of the shredded DNA (Fig. 1.4). Perform PCR reactions using the shredded DNA samples as a template with primers designed to amplify the region of interest. A positive PCR reaction from the input samples indicates that samples are appropriate for immunoprecipitation.
Figure 1.4.

Flow chart of the ChIP assay. The CFTR 5′ regulatory region is shown as an example with some identified and some putative binding factors. The shredded DNA sample is from Calu-3 cells. The PCR products represent the regions of the CFTR promoter with ATF6 binding (Bartoszewski et al., 2008b).
Immunoprecipitation and DNA recovery
Use 500 μg of DNA/sample and adjust the volume to 500 μl with TE buffer. Add 500 μl of 2× RIPA buffer with protease inhibitors and 40 μl of protein A and G agarose beads preincubated with salmon sperm (SS) DNA to block nonspecific binding. Rotate samples for 30 min at 4 °C to remove proteins that bind nonspecifically to the beads. Centrifuge at 14,000 rpm for 1 min at 4 °C and transfer supernatants to fresh chilled tubes. Add 5 μg of ChiP grade antibody to each sample and rotate overnight at 4 °C. Controls with nonspecific antibody or nonimmune purified IgG should be included. After incubation with antibodies, add 60 μl of SS DNA preincubated Protein A or G Agarose beads (depending on the antibody) and rotate for 2 h at 4 °C to capture the protein–DNA complexes. Centrifuge at 14,000 rpm for 3 min at 4 °C, wash pellets in 1 ml buffer in the following order: (1) low salt buffer, (2) high salt buffer, (3) LiCl buffer, and (4) twice in TE buffer. Between washes the samples are centrifuged at 14,000 rpm for 3 min at RT and supernatants discarded. Resuspend the final pellet in 275 μl of fresh Elution buffer and nutate for 15 min at RT, followed by centrifugation (14,000 rpm for 3 min). Remove 250 μl of the supernatant and save on ice. Add 250 μl fresh elution buffer, nutate for 15 min at RT, and centrifuge for 1 min at maximum speed at RT. Remove and add the second 250 μl supernatant to the first so the total eluted volume will be 500 μl. Add 20 μl of 5 M NaCl to each sample and recover DNA as described for input preparation. The purified DNA samples can now be used as templates for PCR reactions. Use primer probes designed to amplify DNA sequences to which the expected transcription factor binds either directly or indirectly and amplify the expect sequence by PCR. Immunoprecipitation with nonspecific antibodies or using nonspecific primer probes should not result in PCR product. It is crucial to test all controls in order to eliminate nonspecific effects. PCR products can be analyzed on 2% EtBr-stained agarose gels (Fig. 1.4). Alternatively, real-time PCR can be performed.
2.4. Assessment of CFTR protein levels
CFTR protein levels decrease during ER stress (Bartoszewski et al., 2008a,b; Rab et al., 2007). Reduced CFTR protein levels may result from (1) reduced mRNA levels, (2) decreased translation, (3) enhanced ERAD, and/or (4) reduced CFTR protein half-life. Here, we describe the methodology for assessing CFTR protein expression.
2.4.1. CFTR maturation efficiency measurements
Metabolic pulse-chase assays are designed to investigate the synthesis, intracellular processing, and half-life of newly synthesized proteins and provide important information regarding the effects of ER stress on these processes (Rab et al., 2007; Varga et al., 2004). Endogenous CFTR expression levels and translational rates are low and therefore CFTR maturation efficiency studies are difficult in cell lines that endogenously express CFTR. Basic information regarding metabolic labeling of proteins is available from other sources (Diaz and Varki, 2009). Here, we describe important points for metabolic pulse-chase studies designed to investigate endogenous CFTR synthesis and processing. Epithelial cells (e.g., Calu-3, T-84) must be grown under optimal conditions for these experiments. For example, it is important to change the tissue culture media every day in order to avoid nutrient starvation that induces ER stress and reduces CFTR transcription (Rab et al., 2007). Furthermore, use low volumes of media to reduce the possibility of hypoxia, since hypoxia has been shown to reduce CFTR levels (Bebok et al., 2001; Guimbellot et al., 2008; Varga et al., 2004).
Materials and equipment
Six-well tissue culture dishes, methionine/cysteine-free MEM (Invitrogen), EasyTag Protein Labeling Mixture (35S-methionine/cysteine, NEN), RIPA buffer (150 mM NaCl, 1% NP-40, 0.5% sodium deoxycholate, 0.1% SDS, 50 mM Tris–HCl, pH 8.0), Protease Inhibitor Complete Mini (Roche). CFTR-specific antibodies appropriate for immunoprecipitation (24-1; Varga et al., 2004; M3A7 (R&D Systems)), Protein A or G Agarose beads (depending on antibody binding efficiency), microcentrifuge, 2× concentrate Laemmli sample buffer (Sigma), 6% or 8% SDS–polyacrylamide gels (Invitrogen). Gel running apparatus, Phosphor Imager screen, Phosphor Imager (Molecular Dynamics), Image analysis software (IPLab or equivalent).
Protocol
Cells are grown on 6-well tissue culture dishes to ~70% confluency and ER stress induced as described in Section 2.1.1. Untreated control samples are also tested. Remove tissue culture media, rinse cells with PBS (CaCl2 0.9 mM, MgCl2 0.5 mM, pH 7.4; Gibco), and replace regular growth medium with methionine/cysteine-free MEM. Incubate cells at 37 °C with 5% CO2 for 30 min (methionine starvation). Protein synthesis is paused in the absence of methionine. At the end of methionine starvation, replace the media with methionine-free media supplemented with 300 μCi/ml of EasyTag Protein Labeling Mixture and place the cells in the incubator. (Samples are radioactive and therefore handled accordingly during the entire experiment.) Labeling time (pulse) should be determined for each cell line. For the cell lines listed and based on the time required for CFTR synthesis, a 30-min pulse period is usually sufficient (Varga et al., 2004). Radioactive labeling is stopped by removing the EasyTag Protein Labeling Mixture, washing the wells, and adding fresh, regular tissue culture media to the cells. Cells are lysed in RIPA buffer supplemented with protease inhibitors at the time points specified (chase period). Samples are rotated at 4 °C for at least 1 h, vortexed several times, and centrifuged at 14,000 rpm for 30 min. Supernatants are collected in fresh tubes. CFTR can be immunoprecipitated from the samples using 24-1 (or M3A7) anti-CFTR monoclonal antibody pre-loaded Protein G Agarose beads. The immunoprecipitation reaction is for 2 h or longer at 4 °C with constant rotation. Following immunoprecipitation, samples are centrifuged for 1 min at max speed and supernatants are removed. Immunoprecipitated samples (bead–antibodies–CFTR complexes) are then washed four times using 1 ml/sample ice-cold RIPA buffer by mixing the beads with RIPA buffer followed centrifugation and removal of the washing buffer using vacuum. The beads should not be disturbed in order minimize variability between samples. Immunoprecipitated CFTR is released from the beads with the addition of 2× Laemmli sample buffer supplemented with 5% β-mercaptoethanol. The volume of sample buffer should be equal to the volume of beads and remaining buffer (~30 μl if 20 μl of the beads were used with the sample). Samples are incubated at 37 °C for 40–45 min (do not boil immunoprecipitated CFTR samples). Spin down samples before loading for PAGE. Samples are analyzed by SDS-PAGE (6% gels) and detected using autoradiography (Molecular Dynamics, PhosphorImager). CFTR maturation efficiency is measured by calculating the percentage of newly synthesized CFTR converted into fully glycosylated CFTR based on densitometry using IPLab software (Scanalytics, Inc.) as described previously (Varga et al., 2004). A typical CFTR maturation efficiency experiment is shown in Fig. 1.5.
Figure 1.5.

Pulse-chase assay to measure CFTR maturation efficiency. A representative gel and the results of densitometry measurements are shown. Calu-3 cells expressing endogenous wild-type CFTR were labeled for 30 min with 300 μCi/ml Easy Tag protein labeling mixture and chased for the time periods specified (immature CFTR, the core glycosylated ER form of CFTR; mature CFTR, the fully glycosylated, post-ER form of CFTR).
2.4.2. Detection of steady-state CFTR levels by Western blot
CFTR-expressing cells are lysed with RIPA buffer supplemented with protease inhibitors (Complete Mini, Roche) on ice for 15 min. The cell lysates are rotated at 4 °C for 30 min and the insoluble material is removed by centrifugation at 14,000 rpm for 15 min. Protein concentrations are determined by BCA™ protein assay (Pierce) using bovine serum albumin (BSA) as the standard. Following normalization of protein concentrations, lysates are mixed with equal volume of 2× Laemmli sample buffer and incubated for 30–45 min at 37 °C prior to separation by SDS-PAGE. Using epithelial cell lines endogenously expressing CFTR (Calu-3, T-84), 15 μg of total protein in the cell lysate contains sufficient CFTR to detect using the MM13-4 antibody. Following SDS-PAGE, the proteins from the gel are transferred to polyvinylidene difluoride (PVDF) membranes (300 mA for 90 min at 4 °C). The membranes are then blocked with milk proteins dissolved in PBS/Tween-20 (5% milk, 0.5% Tween-20 for 1–12 h), followed by immunoblotting with CFTR-specific antibody (mouse monoclonal antibody, MM13-4, Millipore, 2 μg/ml), HRP-conjugated anti-mouse IgG antibody (Pierce), and detected using ECL (Pierce). A typical Western blot result of wild-type CFTR is shown in Fig. 1.6.
Figure 1.6.
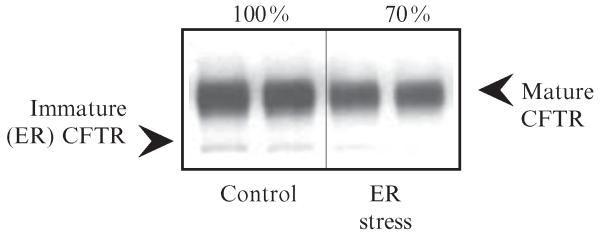
CFTR detection by Western blot. Representative results of CFTR protein detection in whole cell lysates by Western blot. Total cell lysates (15 μg) were separated by 8% PAGE, Western transferred and CFTR was detected using MM13-4 anti-CFTR monoclonal antibody, anti-mouse IgG-HRP (Pierce), and ECL (Pierce). Samples were analyzed in duplicates. Densitometry (Scion Image) was performed to assess CFTR expression levels in control and ER-stressed Calu-3 cells (immature CFTR, the core glycosylated ER form of CFTR; mature CFTR, the fully glycosylated, post-ER form of CFTR).
ACKNOWLEDGMENTS
Supported by NIH, HL076587 (Bebok), DK060065 (Collawn).
REFERENCES
- Bartoszewski R, et al. Activation of the unfolded protein response by deltaF508 CFTR. Am. J. Respir. Cell Mol. Biol. 2008a;39:448–457. doi: 10.1165/rcmb.2008-0065OC. [DOI] [PMC free article] [PubMed] [Google Scholar]
- Bartoszewski R, et al. The mechanism of cystic fibrosis transmembrane conductance regulator transcriptional repression during the unfolded protein response. J. Biol. Chem. 2008b;283:12154–12165. doi: 10.1074/jbc.M707610200. [DOI] [PubMed] [Google Scholar]
- Baudouin-Legros M, et al. Cell-specific posttranscriptional regulation of CFTR gene expression via influence of MAPK cascades on 3′UTR part of transcripts. Am. J. Physiol. Cell Physiol. 2005;289:C1240–C1250. doi: 10.1152/ajpcell.00595.2004. [DOI] [PubMed] [Google Scholar]
- Bebok Z, et al. Failure of cAMP agonists to activate rescued {Delta}F508 CFTR in CFBE41o- airway epithelial monolayers. J. Physiol. 2005;569:601–615. doi: 10.1113/jphysiol.2005.096669. [DOI] [PMC free article] [PubMed] [Google Scholar]
- Bebok Z, Collawn JF. Cystic fibrosis. In: Shapiro S, editor. The Encyclopedia of Respiratory Medicine. Elsevier; Oxford, UK: 2006. pp. 599–609. [Google Scholar]
- Bebok Z, et al. Improved oxygenation promotes CFTR maturation and trafficking in MDCK monolayers. Am. J. Physiol. Cell Physiol. 2001;280:C135–C145. doi: 10.1152/ajpcell.2001.280.1.C135. [DOI] [PubMed] [Google Scholar]
- Bebok Z, et al. Reactive oxygen nitrogen species decrease cystic fibrosis transmembrane conductance regulator expression and cAMP-mediated Cl-secretion in airway epithelia. J. Biol. Chem. 2002;277:43041–43049. doi: 10.1074/jbc.M203154200. [DOI] [PubMed] [Google Scholar]
- Bebok Z, et al. Activation of DeltaF508 CFTR in an epithelial monolayer. Am. J. Physiol. 1998;275:C599–C607. doi: 10.1152/ajpcell.1998.275.2.C599. [DOI] [PubMed] [Google Scholar]
- Belostotsky D. Exosome complex and pervasive transcription in eukaryotic genomes. Curr. Opin. Cell Biol. 2009;21:352–358. doi: 10.1016/j.ceb.2009.04.011. [DOI] [PubMed] [Google Scholar]
- Berdiev BK, et al. Assessment of the CFTR and ENaC association. Mol. Biosyst. 2009;5:123–127. doi: 10.1039/b810471a. [DOI] [PMC free article] [PubMed] [Google Scholar]
- Bradbury NA, et al. Regulation of plasma membrane recycling by CFTR. Science. 1992;256:530–532. doi: 10.1126/science.1373908. [DOI] [PubMed] [Google Scholar]
- Cantin AM, et al. Oxidant stress suppresses CFTR expression. Am. J. Physiol. Cell Physiol. 2006a;290:C262–C270. doi: 10.1152/ajpcell.00070.2005. [DOI] [PubMed] [Google Scholar]
- Cantin AM, et al. Cystic fibrosis transmembrane conductance regulator function is suppressed in cigarette smokers. Am. J. Respir. Crit. Care Med. 2006b;173:1139–1144. doi: 10.1164/rccm.200508-1330OC. [DOI] [PubMed] [Google Scholar]
- Carvalho-Oliveira I, et al. CFTR localization in native airway cells and cell lines expressing wild-type or F508del-CFTR by a panel of different antibodies. J. Histochem. Cytochem. 2004;52:193–203. doi: 10.1177/002215540405200207. [DOI] [PubMed] [Google Scholar]
- Cheng SH, et al. Defective intracellular transport and processing of CFTR is the molecular basis of most cystic fibrosis. Cell. 1990;63:827–834. doi: 10.1016/0092-8674(90)90148-8. [DOI] [PubMed] [Google Scholar]
- Collawn JF, Fu L, Bebok Z. Therapeutic targets in cystic fibrosis: The role of pharmaceutical chaperones. Expert Rev. Proteomics. 2010;7:495–506. doi: 10.1586/epr.10.45. [DOI] [PMC free article] [PubMed] [Google Scholar]
- Dahl M, Nordestgaard BG. Markers of early disease and prognosis in COPD. Int. J. Chron. Obstruct. Pulmon. Dis. 2009;4:157–167. doi: 10.2147/copd.s3106. [DOI] [PMC free article] [PubMed] [Google Scholar]
- Di A, et al. CFTR regulates phagosome acidification in macrophages and alters bactericidal activity. Nat. Cell Biol. 2006;8:933–944. doi: 10.1038/ncb1456. [DOI] [PubMed] [Google Scholar]
- Diaz S, Varki A. Metabolic radiolabeling of animal cell glycoconjugates. Curr. Protoc. Protein Sci. 2009 doi: 10.1002/0471140864.ps1202s57. Chapter 12, Unit 12 2 12 2 1-55. [DOI] [PubMed] [Google Scholar]
- Frischmeyer PA, Dietz HC. Nonsense-mediated mRNA decay in health and disease. Hum. Mol. Genet. 1999;8:1893–1900. doi: 10.1093/hmg/8.10.1893. [DOI] [PubMed] [Google Scholar]
- Gomes-Alves P, et al. Low temperature restoring effect on F508del-CFTR mis-processing: A proteomic approach. J. Proteomics. 2009;73:218–230. doi: 10.1016/j.jprot.2009.09.001. [DOI] [PubMed] [Google Scholar]
- Guimbellot JS, et al. Role of oxygen availability in CFTR expression and function. Am. J. Respir. Cell Mol. Biol. 2008;39:514–521. doi: 10.1165/rcmb.2007-0452OC. [DOI] [PMC free article] [PubMed] [Google Scholar]
- Hong M, et al. Endoplasmic reticulum stress triggers an acute proteasome-dependent degradation of ATF6. J. Cell. Biochem. 2004;92:723–732. doi: 10.1002/jcb.20118. [DOI] [PubMed] [Google Scholar]
- Hung JH, et al. Endoplasmic reticulum stress stimulates the expression of cyclo-oxygenase-2 through activation of NF-kappaB and pp 38 mitogen-activated protein kinase. J. Biol. Chem. 2004;279:46384–46392. doi: 10.1074/jbc.M403568200. [DOI] [PubMed] [Google Scholar]
- Ismailov II, et al. Regulation of epithelial sodium channels by the cystic fibrosis transmembrane conductance regulator. J. Biol. Chem. 1996;271:4725–4732. doi: 10.1074/jbc.271.9.4725. [DOI] [PubMed] [Google Scholar]
- Kerem B, et al. Identification of the cystic fibrosis gene: Genetic analysis. Science. 1989;245:1073–1080. doi: 10.1126/science.2570460. [DOI] [PubMed] [Google Scholar]
- Kerem E, et al. Effectiveness of PTC124 treatment of cystic fibrosis caused by nonsense mutations: A prospective phase II trial. Lancet. 2008;372:719–727. doi: 10.1016/S0140-6736(08)61168-X. [DOI] [PubMed] [Google Scholar]
- Kultz D. Molecular and evolutionary basis of the cellular stress response. Annu. Rev. Physiol. 2005;67:225–257. doi: 10.1146/annurev.physiol.67.040403.103635. [DOI] [PubMed] [Google Scholar]
- Lee AS. The ER chaperone and signaling regulator GRP78/BiP as a monitor of endoplasmic reticulum stress. Methods. 2005;35:373–381. doi: 10.1016/j.ymeth.2004.10.010. [DOI] [PubMed] [Google Scholar]
- Liu S, et al. Dynamic activation of cystic fibrosis transmembrane conductance regulator by type 3 and type 4D phosphodiesterase inhibitors. J. Pharmacol. Exp. Ther. 2005;314:846–854. doi: 10.1124/jpet.105.083519. [DOI] [PubMed] [Google Scholar]
- Nadanaka S, et al. Activation of mammalian unfolded protein response is compatible with the quality control system operating in the endoplasmic reticulum. Mol. Biol. Cell. 2004;15:2537–2548. doi: 10.1091/mbc.E03-09-0693. [DOI] [PMC free article] [PubMed] [Google Scholar]
- Naren AP, et al. A macromolecular complex of beta 2 adrenergic receptor, CFTR, and ezrin/radixin/moesin-binding phosphoprotein 50 is regulated by PKA. Proc. Natl. Acad. Sci. USA. 2003;100:342–346. doi: 10.1073/pnas.0135434100. [DOI] [PMC free article] [PubMed] [Google Scholar]
- O’Byrne PM, Postma DS, Asthma Research Group The many faces of airway inflammation. Asthma and chronic obstructive pulmonary disease. Am. J. Respir. Crit. Care Med. 1999;159:S41–S63. [PubMed] [Google Scholar]
- Quinton PM. Cystic fibrosis: Lessons from the sweat gland. Physiology (Bethesda) 2007;22:212–225. doi: 10.1152/physiol.00041.2006. [DOI] [PubMed] [Google Scholar]
- Rab A, et al. Endoplasmic reticulum stress and the unfolded protein response regulate genomic cystic fibrosis transmembrane conductance regulator expression. Am. J. Physiol. Cell Physiol. 2007;292:C756–C766. doi: 10.1152/ajpcell.00391.2006. [DOI] [PubMed] [Google Scholar]
- Riordan JR. CFTR function and prospects for therapy. Annu. Rev. Biochem. 2008;77:701–726. doi: 10.1146/annurev.biochem.75.103004.142532. [DOI] [PubMed] [Google Scholar]
- Riordan JR, Chang XB. CFTR, a channel with the structure of a transporter. Biochim. Biophys. Acta. 1992;1101:221–222. [PubMed] [Google Scholar]
- Rodriguez BA, Huang TH. Tilling the chromatin landscape: Emerging methods for the discovery and profiling of protein-DNA interactions. Biochem. Cell Biol. 2005;83:525–534. doi: 10.1139/o05-055. [DOI] [PubMed] [Google Scholar]
- Rowe SM, et al. Cystic fibrosis. N. Engl. J. Med. 2005;352:1992–2001. doi: 10.1056/NEJMra043184. [DOI] [PubMed] [Google Scholar]
- Schmid M, Jensen TH. The exosome: A multipurpose RNA-decay machine. Trends Biochem. Sci. 2008;33:501–510. doi: 10.1016/j.tibs.2008.07.003. [DOI] [PubMed] [Google Scholar]
- Schroder M, Kaufman RJ. The mammalian unfolded protein response. Annu. Rev. Biochem. 2005;74:739–789. doi: 10.1146/annurev.biochem.73.011303.074134. [DOI] [PubMed] [Google Scholar]
- Schwiebert EM, et al. CFTR is a conductance regulator as well as a chloride channel. Physiol. Rev. 1999;79:S145–S166. doi: 10.1152/physrev.1999.79.1.S145. [DOI] [PubMed] [Google Scholar]
- Sheppard DN, et al. Expression of cystic fibrosis transmembrane conductance regulator in a model epithelium. Am. J. Physiol. 1994;266:L405–L413. doi: 10.1152/ajplung.1994.266.4.L405. [DOI] [PubMed] [Google Scholar]
- van der Deen M, et al. ATP-binding cassette (ABC) transporters in normal and pathological lung. Respir. Res. 2005;6:59. doi: 10.1186/1465-9921-6-59. [DOI] [PMC free article] [PubMed] [Google Scholar]
- Varga K, et al. Efficient intracellular processing of the endogenous cystic fibrosis transmembrane conductance regulator in epithelial cell lines. J. Biol. Chem. 2004;279:22578–22584. doi: 10.1074/jbc.M401522200. [DOI] [PubMed] [Google Scholar]
- Ward CL, et al. Degradation of CFTR by the ubiquitin-proteasome pathway. Cell. 1995;83:121–127. doi: 10.1016/0092-8674(95)90240-6. [DOI] [PubMed] [Google Scholar]
- Weinmann AS, Farnham PJ. Identification of unknown target genes of human transcription factors using chromatin immunoprecipitation. Methods. 2002;26:37–47. doi: 10.1016/S1046-2023(02)00006-3. [DOI] [PubMed] [Google Scholar]
- Yoshida H, et al. XBP1 mRNA is induced by ATF6 and spliced by IRE1 in response to ER stress to produce a highly active transcription factor. Cell. 2001;107:881–891. doi: 10.1016/s0092-8674(01)00611-0. [DOI] [PubMed] [Google Scholar]