eLife logoLink to eLife
. 2015 May 1;4:e04810. doi: 10.7554/eLife.04810

Cellular hallmarks reveal restricted aerobic metabolism at thermal limits

Aitana Neves 1, Coralie Busso 1, Pierre Gönczy 1,*
Editor: Fiona M Watt2
PMCID: PMC4415524  PMID: 25929283

Abstract

All organisms live within a given thermal range, but little is known about the mechanisms setting the limits of this range. We uncovered cellular features exhibiting signature changes at thermal limits in Caenorhabditis elegans embryos. These included changes in embryo size and shape, which were also observed in Caenorhabditis briggsae, indicating evolutionary conservation. We hypothesized that such changes could reflect restricted aerobic capacity at thermal limits. Accordingly, we uncovered that relative respiration in C. elegans embryos decreases at the thermal limits as compared to within the thermal range. Furthermore, by compromising components of the respiratory chain, we demonstrated that the reliance on aerobic metabolism is reduced at thermal limits. Moreover, embryos thus compromised exhibited signature changes in size and shape already within the thermal range. We conclude that restricted aerobic metabolism at the thermal limits contributes to setting the thermal range in a metazoan organism.

DOI: http://dx.doi.org/10.7554/eLife.04810.001

Research organism: C. elegans

eLife digest

An organism can thrive within a certain range of temperatures, beyond which it is less able to grow and reproduce. Different species are adapted to live in environments of different temperatures and this influences where on the planet they can be found.

Researchers have suggested that the optimum temperature range for an organism may be influenced by its oxygen supply. The cells of most organisms need oxygen to produce chemical energy from sugars in a process called respiration. Within their normal temperature range, cells in the body of an organism are adapted to be able to take up sufficient oxygen to produce the energy they need. However, if the temperature rises above or falls below the limits of this range, the uptake of oxygen into cells may work less efficiently.

Neves et al. tested this idea by studying the embryos of two different species of nematode worms grown at the limits of their respective temperature ranges. This led to several changes in the appearance of the embryos. For example, the embryos were larger than normal when grown at the lower end of their temperature ranges, but were smaller when grown at temperatures close to their upper limit. Shape changes were also seen: the embryos of both species were longer when grown at higher temperatures, a change that increases their surface area relative to their volume and may improve their ability to take up oxygen. Further experiments showed that disrupting respiration in the worms could lead to similar size and shape changes within the thermal range.

Neves et al.'s findings provide experimental support that respiration plays an important role in setting the temperature ranges in which organisms can live. The next challenge will be to identify the genes that influence the capacity of respiration in these cells, which may help to explain how particular species have adapted to specific environments.

DOI: http://dx.doi.org/10.7554/eLife.04810.002

Introduction

All organisms live within a given thermal range, beyond which growth and fecundity decrease (Pörtner et al., 2006). Partly as a result, organisms tend to distribute in the ocean and on land according to latitude as well as depth and altitude, although other elements such as availability of food and light also play a role in shaping preferred habitats (Pörtner, 2002; Pörtner et al., 2006; Prasad et al., 2011). Despite their importance, the mechanisms that set the thermal limits remain incompletely understood.

A mismatch between oxygen supply and demand has been suggested to play a role in setting thermal limits in multicellular organisms. This hypothesis, referred to as the oxygen- and capacity-limited thermal tolerance (OCLTT), derives in part from the observation that oxygen partial pressure in aquatic organisms is constant within a given thermal range and decreases both below the lower thermal limit and above the upper thermal limit (Pörtner, 2002; Pörtner et al., 2006). In agreement with this hypothesis, the metabolic status of some aquatic organisms has been shown to peak at a given temperature and to decrease both below and above that (Melzner et al., 2006; Wittmann et al., 2008). Interestingly too, tolerance to high temperatures is increased in an amphibian crab when the animal is in the air compared to when it is in water, reflecting the reduced cost of oxygen supply in air (Giomi et al., 2014), again supporting the OCLTT hypothesis. Overall, these data suggest that thermal limits in complex organisms are characterized by a mismatch in oxygen supply and demand, which would result in reduced energy production and thus limit reproduction and growth (Pörtner, 2002; Pörtner et al., 2006).

Intriguingly, the temperature-dependence of oxygen diffusion is significantly lower than that of metabolism (Woods, 1999), raising the question of how oxygen supply and demand can be matched, even within the thermal range. One possible solution is suggested by the observation that body size decreases with augmented temperature in the vast majority of ectotherms (‘temperature-size rule’) (Atkinson, 1994; Forster et al., 2012), thereby increasing surface to volume ratio and thus potentially oxygen availability. In support of this, the slope of this ‘temperature-size rule’ is steeper for aquatic organisms than terrestrial organisms, in agreement with the lower availability of oxygen in water compared to air (Forster et al., 2012). This has led to the suggestion that alterations in cell size in response to changes in temperature within the thermal range are adaptive responses to preserve aerobic capacity, which has been dubbed the MASROS hypothesis (Maintain Aerobic Scope—Regulate Oxygen Supply) (Atkinson et al., 2006). What happens beyond the thermal limits within this conceptual framework? One might expect that thermal limits could be characterized by further changes in cell size and potentially also cell shape, in an attempt to increase the available surface area and thus maximize oxygen availability. Furthermore, the MASROS hypothesis predicts that aerobic metabolism, measured as respiration, should decrease beyond both the lower and the upper thermal limit as compared to within the thermal range, once the organism can no longer compensate for the insufficient oxygen availability. To our knowledge, these central predictions of the MASROS hypothesis have not been challenged experimentally in an integrative fashion. Therefore, the extent to which restricted aerobic metabolism is a general principle characterizing thermal limits remains unclear.

Results and discussion

Defining thermal limits

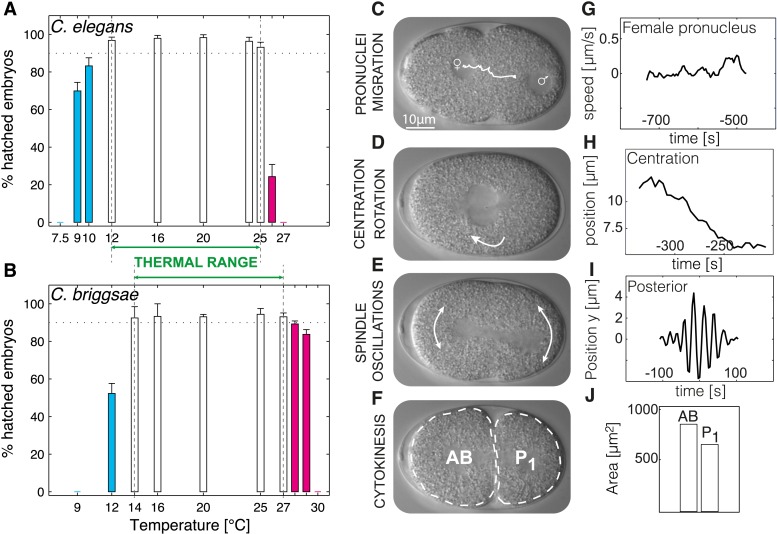
We determined embryonic viability in a range of temperatures for Caenorhabditis elegans and Caenorhabditis briggsae and operationally defined the thermal limits as the upper and lower edges of the temperature range within which >90% of embryos hatched. We thus found that the thermal limits of C. elegans were of 12°C and 25°C (Figure 1A), and those of C. briggsae of 14°C and 27°C (Figure 1B), in line with the fact that C. briggsae usually lives in warmer climates than C. elegans (Prasad et al., 2011). The thermal range defined by these upper and lower limits ensures robust propagation of the population and is narrower than merely the reproductive range for C. elegans (9°C–26°C [Anderson et al., 2011]) or C. briggsae (14°C–30°C [Anderson et al., 2007; Prasad et al., 2011]).

Figure 1. Defining the thermal range and quantifications.

(A and B) Progeny tests were performed on acclimated C. elegans worms from 7.5°C to 27°C and C. briggsae worms from 9°C to 30°C. Dotted line highlights 90% embryonic viability. Temperatures below 20°C exhibiting less than 90% viability are shown in cyan, temperatures above 20°C exhibiting less than 90% viability in magenta. Between panels A and B, we show the thermal range of each species. Error bars show SEM. (CF) Stills from a time-lapse temperature-controlled DIC microscopy recording of a first-cell stage embryo at the indicated stages (GJ) Examples of feature quantification at the different cellular stages (24°C): female pronucleus speed (G), pronuclei position during centration-rotation (H), spindle pole oscillations (I), as well as areas of the AB (anterior) and P1 (posterior) daughter cells (J). See ‘Materials and methods’ for details on the quantifications. Figure 1—figure supplement 1 shows the temperature control setup. Figure 1—source data 1 lists all the quantified features and their thermal response within and beyond the thermal range.

DOI: http://dx.doi.org/10.7554/eLife.04810.003

Figure 1—source data 1. Quantified features.
List of features that were quantified and their thermal responses within and beyond the thermal range for C. elegans (N2). Within the thermal range, features were categorized as ‘temperature-dependent’ if the Pearson correlation p-value was below 0.0014 = 0.05/35 (see ‘Materials and methods’ for Bonferroni correction; ‘temperature-independent’ is shown underlined). Beyond the thermal limit, we performed an F-test to determine if the thermal response of the feature was changing compared to within the thermal range (see ‘Materials and methods’; we indicated a change in thermal response when the F-test p-value was below 0.0014, highlighted in bold). Abbreviations: PC: pseudo-cleavage, PM: pronuclear meeting, ME: mitotic entry, T: temperature, C/R: centration-rotation, MT: microtubules. The following features were also quantified but displayed no consistent thermal response both within and beyond the thermal range and hence were not included in the table: anterior-most position at the end of C/R, number of anterior and posterior oscillations, spindle position at the onset of oscillations.
elife04810s001.docx (100.9KB, docx)
DOI: 10.7554/eLife.04810.004

Figure 1.

Figure 1—figure supplement 1. Temperature-control setup.

Figure 1—figure supplement 1.

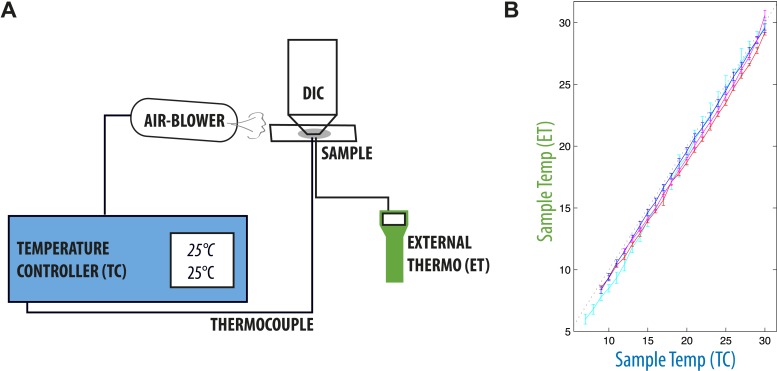
(A) The temperature within the sample was measured using a thin thermocouple of type K (see ‘Materials and methods’), connected to a temperature controller. This temperature feedback was used to control the temperature of the air blown on the sample and objective, so that sample and set temperatures always matched. (B) We verified that the temperature controller was well calibrated over the range of temperatures of interest by checking the temperature on the sample with yet another thermocouple connected to a separate external thermometer at the same time. We report the measured temperature on the sample by the temperature controller and external thermometer. The measured imprecision was of the order of 0.2°C at all temperatures.

Cellular features within the thermal range

We reasoned that identifying cellular features that operate differently beyond the thermal limits defined above, as compared to within the thermal range, might reveal critical mechanisms acting at these limits. In order to systematically identify such limit-sensitive features, we first analyzed cellular processes within the thermal range. We conducted this analysis initially in C. elegans embryos, but then also studied embryos of C. briggsae, which has been estimated to have diverged from C. elegans 18–100 million years ago (Stein et al., 2003; Cutter, 2008), thus probing evolutionary conservation of putative limit-sensitive features. Using temperature-controlled time-lapse DIC (Differential Interference Contrast) microscopy and semi-automated quantifications of the resulting movies with in-house scripts (Figure 1C–J, Figure 1—figure supplement 1, ‘Materials and methods’, and Source code 1), we measured 35 cellular features that describe the main events of the first cell cycle of C. elegans embryos (Figure 1C–F). In brief, after fertilization, the female pronucleus migrates towards the male pronucleus (Figure 1C). After their meeting, the pronuclei move to the embryo center whilst undergoing a 90°C rotation (Figure 1D). The nuclear envelopes then break down, followed by assembly of the mitotic spindle, which moves slightly to the posterior during the remainder of mitosis whilst oscillating perpendicular to the anterior–posterior axis (Figure 1E). This results in the asymmetric division of the one-cell stage embryo into a larger anterior cell and a smaller posterior one (Figure 1F). Our analysis established that the vast majority of the monitored features were temperature-dependent within the thermal range (Figure 1—source data 1). Interestingly, some features, including the fraction of time spent in mitosis (Figure 2B) and cell division asymmetry (Figure 2C), exhibited a temperature-independent behavior, suggesting that temperature-compensation mechanisms are also at play.

Figure 2. C. elegans thermal responses.

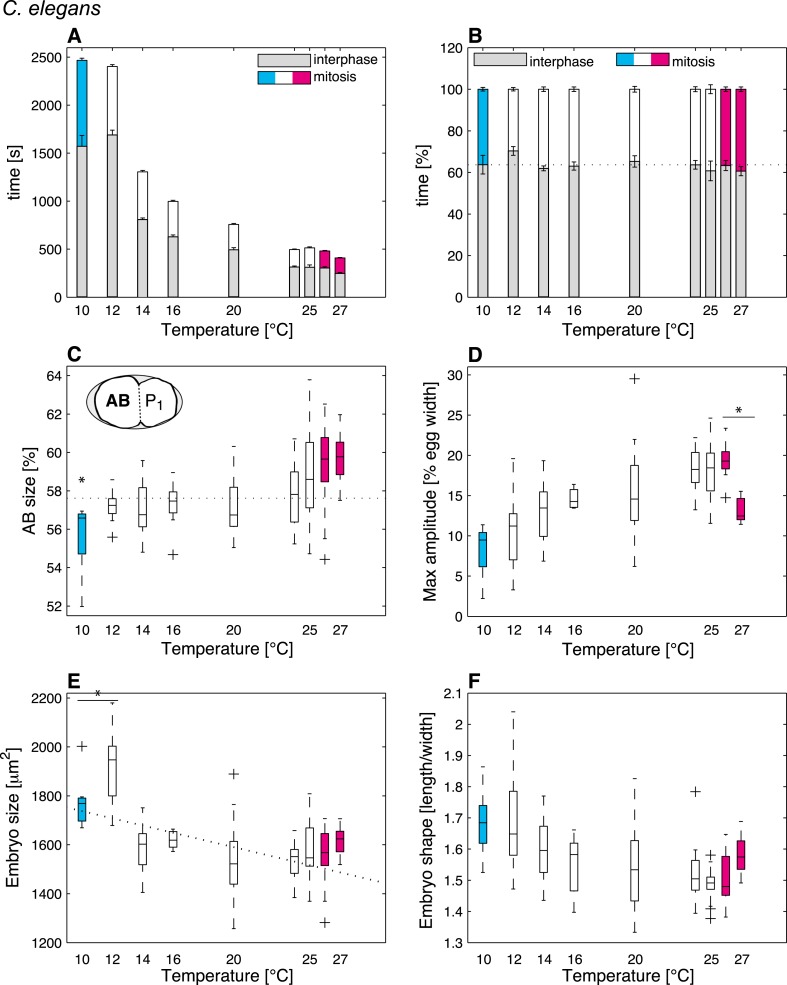
(A) Cell cycle duration as a function of temperature (error bars show SEM). (B) Relative cell cycle duration as a function of temperature (error bars show SEM). (C) Relative size of the AB blastomere as a function of temperature. Dotted line represents the average relative size within the thermal range (57.4%). (D) Maximum amplitude of posterior pole oscillations during anaphase. (E) Embryo size as a function of temperature. Dotted line shows a linear regression of the data within the thermal range (white boxes). (F) Embryo shape, measured as the ratio of embryo length over embryo width, as a function of temperature. See main text for p-values. Color code (for the whole figure): white bars show data within the thermal range. Colored bars show data below (cyan) and above (magenta) the thermal limit. Boxplots show median as well as 25th and 75th percentiles. Whiskers extend to the most extreme points not considered outliers (i.e., within 99.3% coverage). Note that the variance of cellular features does not increase beyond the thermal limits as compared to within the thermal range. Figure 2—figure supplement 1 depicts embryo size and shape at various temperatures.

DOI: http://dx.doi.org/10.7554/eLife.04810.006

Figure 2.

Figure 2—figure supplement 1. Embryo size and shape at various temperatures, exaggerating the actual differences for visualization purposes.

Figure 2—figure supplement 1.

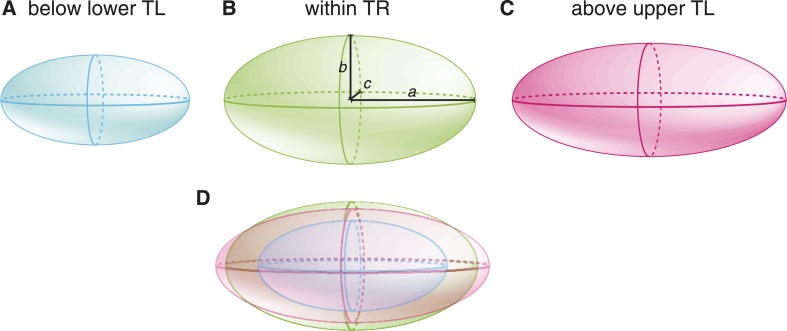
We show a cartoon embryo below the lower thermal limit (A), which has the same shape as the embryo within the thermal range (B), that is, a/b is equal in both cases. Above the upper thermal limit (C), the embryo elongates (i.e., a/b increased). In (D), we show an overlay of the embryos in (AC).

Mitosis duration and cell division asymmetry are sensitive to the thermal limits

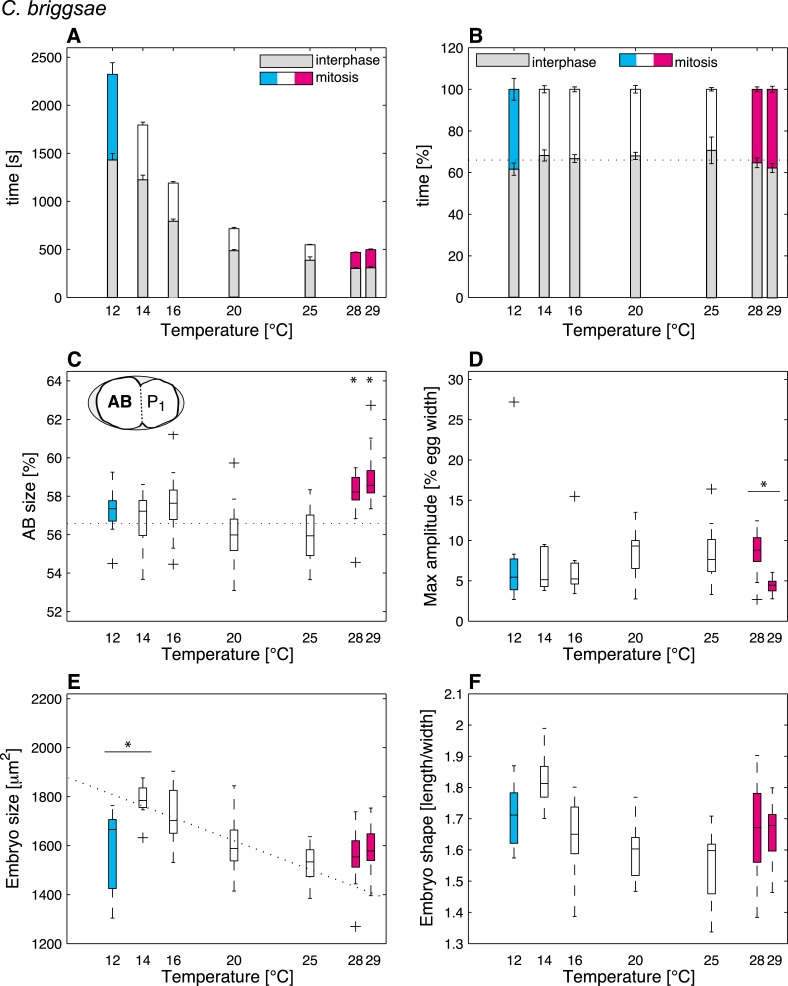
We then were in a position to identify cellular features that might operate differently beyond the thermal limits compared to within the thermal range. We found that although some features exhibited the same thermal response as within the thermal range, others responded differently, suggesting that they were sensitive to the thermal limits (Figure 1—source data 1). Thus, the duration of mitosis, which decreased monotonically with increasing temperatures within the thermal range, plateaued beyond both lower and upper thermal limits in C. elegans (Figure 2A). Moreover, although C. briggsae can develop at warmer temperatures than C. elegans (Figure 1A–B) (Prasad et al., 2011), we found that cell cycle duration was not faster in C. briggsae than in C. elegans at any temperature (Figure 3A, compare with Figure 2A). Interestingly, cell cycle duration within the thermal range was well described by Arrhenius kinetics in C. elegans (92% of explained variance; ‘Materials and methods’) (Arrhenius, 1915). In C. briggsae, by contrast, the data beyond 25°C reduced the explained variance from 86% to 39%, suggesting that cell cycle duration plateaued already below the upper thermal limit in this species, underscoring the fact that mitosis duration is a limit-sensitive feature.

Figure 3. Thermal responses in C. briggsae.

Figure 3.

See legend of Figure 2 and main text for p-values.

DOI: http://dx.doi.org/10.7554/eLife.04810.008

We also observed that the asymmetry of the first cell division in C. elegans, which was constant within the thermal range, decreased below 12°C (F-test p = 0.0005) and increased above 25°C (F-test p < 10−7) (Figure 2C; see ‘Materials and methods’ for statistics). In C. briggsae, the asymmetry of the first cell division also increased beyond the upper thermal limit, at both 28°C and 29°C (F-test p-value < 10−10) (Figure 3C). However, a reciprocal decrease was not observed at the lower thermal limit in this species, perhaps because spindle pole oscillations are weaker in C. briggsae than in C. elegans (Riche et al., 2013) (compare panel D in Figures 2, 3), potentially limiting the dynamic range over which asymmetry can be tuned.

Embryo size and shape are sensitive to the thermal limits

Our analysis also revealed interesting alterations in embryo geometry at the upper and at the lower thermal limits. Thus, embryo size was larger at the lower end of the thermal range (i.e., 12°C for C. elegans, Figure 2E; 14°C for C. briggsae, Figure 3E), and tended to decrease with increasing temperature within the thermal range. This is in line with the ‘temperature-size rule’ observed in the vast majority of ectotherms (Atkinson, 1994; Forster et al., 2012), and in agreement with previously reported data for C. elegans at 10°C vs 20°C (Van Voorhies, 1996). Strikingly, below the lower thermal limit, embryo size was actually significantly reduced in both C. elegans and C. briggsae (Figures 2E, 3E; F-test p < 10−7 and p = 0.001, respectively). Such a reversal of the temperature size rule below the lower thermal limit has also been reported in protists and in Drosophila (Karan et al., 1998; Atkinson et al., 2003). These observations are compatible with the MASROS hypothesis, which posits that such a size decrease below the lower thermal limit may reflect cold-inhibited mitochondrial function (Atkinson et al., 2006).

Beyond the upper thermal limit, we observed a plateau in the size of both C. elegans and C. briggsae embryos (Figures 2E–3E). Interestingly, however, we observed that embryos in both species were more elongated beyond the upper thermal limit (Figures 2F–3F; F-test p = 0.0004 and F-test p < 10−10, respectively). Such an elongation results in an increase of the surface area, thus potentially augmenting its availability for oxygen diffusion (Figure 2—figure supplement 1). Overall, these results reveal that changes in cell size and shape are signature hallmarks of the thermal limits.

Cellular hallmarks of the thermal limits are recapitulated when impairing aerobic metabolism

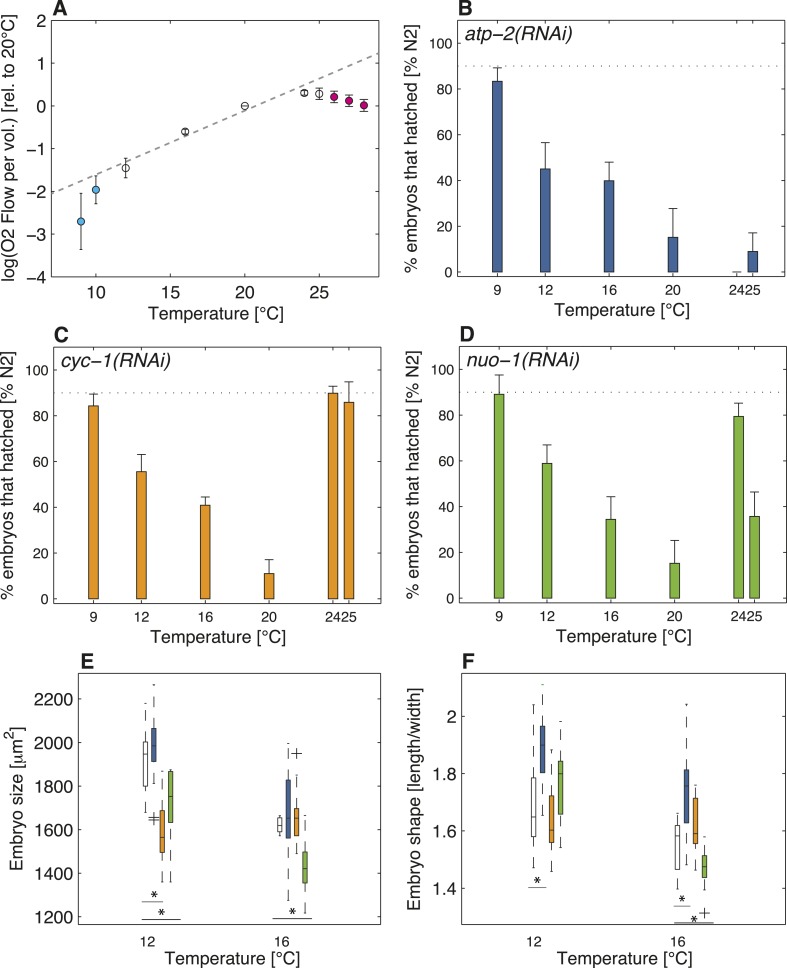
Do the observed changes in embryo size below the lower thermal limit and of shape above the upper thermal limit reflect an adaptation to reduced aerobic metabolism at those temperatures? We set out to explore this possibility by determining the extent of respiration at different temperatures in wild-type C. elegans embryos. As shown in Figure 4A, we found that respiration increased exponentially within the thermal range, as predicted by Arrhenius-like kinetics (Arrhenius, 1915). Strikingly in addition, this analysis uncovered that respiration departed from Arrhenius-like kinetics both below the lower thermal limit (F-test p-value < 10−4) and above the upper thermal limit (F-test p-value < 10−10), in support of reduced respiration at those temperatures (Figure 4A). Although we do not know whether the observed relative reduction in aerobic capacity beyond both thermal limits as compared to within the thermal range contributes to increased lethality at those limits, our results show a clear correlation between these features.

Figure 4. Restricted aerobic metabolism at the thermal limits.

(A) Oxygen consumption (y-axis displays the logarithm of O2 flow per volume) in embryos at different temperatures from 9°C to 28°C. Pooled data from two biological replicates, each with two technical replicates (see ‘Materials and methods’). Error bars represent the SEM. Note that respiration increases exponentially between 12°C and 24°C (white discs), as shown by the linear increase in log-scale (gray dashed line shows exponential fit between 12°C and 24°C). Note also that respiration decreases beyond both thermal limits (cyan and magenta discs, respectively), and no longer follows the exponential trend observed within the thermal range. (B) Color-code for panels (BF): white (wild-type), blue (atp-2(RNAi)), orange (cyc-1(RNAi)), green (nuo-1(RNAi)). Progeny tests on atp-2(RNAi) embryos. (C) Same as B for cyc-1(RNAi). (D) Same as B for nuo-1(RNAi). (E) Embryo size as a function of temperature. (F) Embryo shape as a function of temperature. See main text for p-values. Figure 4—figure supplement 1 shows the RNAi feeding times as a function of temperature.

DOI: http://dx.doi.org/10.7554/eLife.04810.009

Figure 4.

Figure 4—figure supplement 1. RNAi feeding time as a function of temperature.

Figure 4—figure supplement 1.

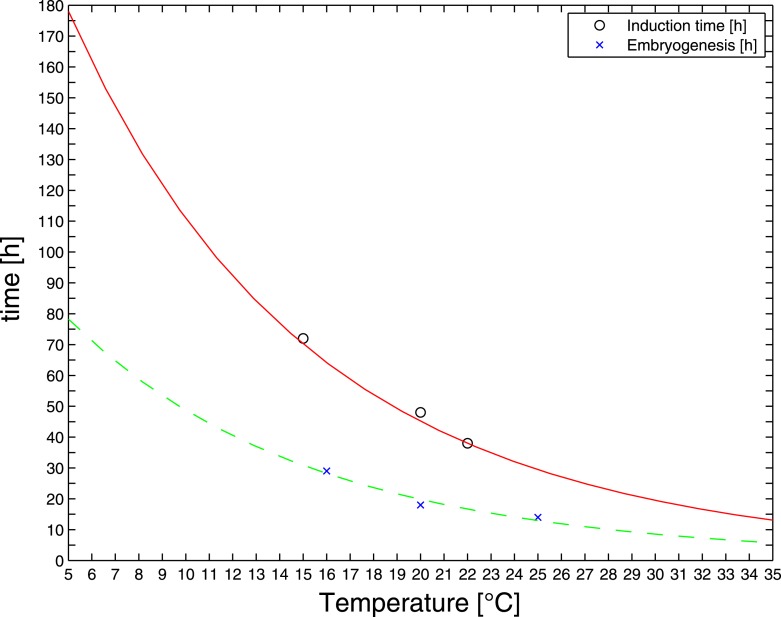
Reported durations of embryogenesis (blue crosses) were fitted by an Arrhenius-like model (dashed green line) (Gillooly et al., 2002). The same activation energy was used to fit reported RNAi induction times (black circles and fitted red solid line). The latter fit was used to extrapolate RNAi feeding times at the temperatures of interest.
Figure 4—figure supplement 2. Progeny tests in air-1(RNAi).

Figure 4—figure supplement 2.

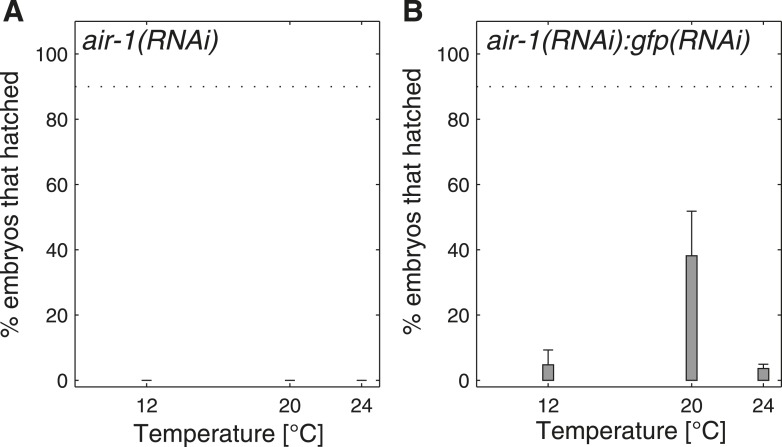
(A) air-1(RNAi) is 100% embryonic lethal at 12°C, 20°C and 24°C, as anticipated (Schumacher et al., 1998; Hannak et al., 2001). (B) In order to titrate the phenotype, we performed double RNAi by mixing bacteria expressing dsRNA against air-1 with bacteria expressing dsRNA against gfp in a 1:3 ratio. We found that lethality is greater at 12°C and at 24°C than at 20°C, indicating that the results we uncovered when targeting mitochondrial respiratory chain components (Figure 4B–D) are not due to a general RNAi temperature-dependent response.

One possibility to interpret these data is that the energetic needs of the embryo are not satisfied beyond the thermal limits due to insufficient aerobic metabolism. Another possibility is that these needs are actually fulfilled to some extent despite reduced respiration, either because other metabolic routes are used to a larger relative extent or because embryos are metabolically depressed at the thermal limits and thus require less energy altogether. We reasoned that if aerobic metabolism became insufficient beyond the thermal limits, then further compromising mitochondrial activity should have more of an impact at the thermal limits than within the thermal range. By contrast, if energetic needs could be fulfilled at the least to some extent despite reduced respiration beyond the thermal limits, then further compromising mitochondrial activity should have less of an impact at the thermal limits than within the thermal range. Therefore, to distinguish between these two possibilities, we depleted three components of the mitochondrial respiratory chain using RNAi: the beta-subunit of ATP synthase ATP-2 (Tsang et al., 2001), a complex V component, the subunit of the mitochondrial complex I NUO-1 (Tsang et al., 2001), and the component of the mitochondrial complex III CYC-1 (Dillin et al., 2002). We ascertained that embryonic respiration was reduced in cyc-1(RNAi) embryos, reaching on average 56% ± 13% of the wild-type levels under the assay conditions (t-test p-value < 10−3; see ‘Materials and methods’). Since ATP-2 and NUO-1 are part of complex V and I, respectively, respiration may still occur upon their depletion, even if the mitochondrial respiratory chain is compromised (Braeckman et al., 2009), so that respiration measurements may not have been telling in these cases. Importantly, we found that all three RNAi conditions were embryonic lethal to some extent (Figure 4B–D), probably owing to decreased energy production through respiration, although we cannot exclude that the observed lethality stems from changes in pH or increased reactive oxygen species. Importantly, in addition, this analysis uncovered that embryonic lethality was reduced towards the lower thermal limit as compared to within the thermal range in all three cases, as well as towards the upper thermal limit in both cyc-1(RNAi) and nuo-1(RNAi) (Figure 4B–D). These results offer strong experimental support to the notion that the capacity of the mitochondrial respiratory chain is restricted beyond both thermal limits, and raise the possibility that other metabolic routes are used to a larger relative extent at those temperatures in the face of reduced respiration.

Following up on this result, we set out to test whether the changes in size or shape observed beyond the thermal limits in the wild-type reflect an adaptation response to restricted aerobic capacity. We reasoned that if this were the case, then such changes should occur already within the thermal range of embryos in which components of the mitochondrial respiratory chain are compromised. Interestingly, we found that whereas embryo size was not significantly affected upon RNAi-mediated depletion of atp-2 (Figure 4E), these embryos were more elongated at both 12°C and 16°C (Figure 4F, U-test p(12°C) = 0.0034, p(16°C) = 0.0039). In nuo-1(RNAi), embryo size was significantly reduced at both temperatures (U-test p(12°C) = 0.02, U-test p(16°C) < 10−3, Figure 4E), whereas a similar response was observed in cyc-1(RNAi) embryos at 12°C (U-test p(12°C) < 10−3, Figure 4E). While it remains to be investigated why the cellular consequences of depleting these three components differ to some extent, remarkably, they share the net result of increasing surface to volume ratio within the thermal range, thus mimicking the situation in the wild-type beyond the thermal limits. Therefore, these results strongly support the notion that the uncovered cellular hallmarks observed at the thermal limits of wild-type embryos reflect restricted aerobic capacity.

Conclusions

In this work, we assessed the thermal response of cellular features during the first cell cycle of C. elegans and C. briggsae embryos. Interestingly, we uncovered that the thermal response of select cellular features changed precisely at the limit temperatures defined by embryonic viability tests (see Figure 1A–B). While we do not know whether these cellular hallmarks are responsible for the observed increased lethality beyond the thermal limits, we note that a mere 10% decrease in embryonic viability is associated with readily observable cellular changes during the first cell cycle. Importantly, experiments in which mitochondrial respiration is compromised revealed that aerobic metabolism plays a smaller relative role towards the thermal limits than within the thermal range, raising the possibility that other metabolic routes are favored to produce energy. Furthermore, these experiments uncover that the changes in size and shape observed beyond the thermal limits in the wild-type can be recapitulated within the thermal range by impairing aerobic metabolism, strongly supporting the view that these changes arise in response to restricted aerobic metabolism. Together, our work provides critical experimental evidence supporting the notion that restricted aerobic metabolism is a general principle characterizing thermal limits in multicellular organisms in water and on land. Other elements contribute to setting boundary conditions within which a thermal range can be envisaged. Thus, cold-induced increase in unsaturated fatty acids in cyanobacteria, Arabidopsis (Hazel, 1995) and C. elegans contributes to setting the lower thermal limit (Svensk et al., 2013), although it only accounts for 16% of the observed difference in cold tolerance at 10°C vs 25°C in C. elegans (Murray et al., 2007). Moreover, warm-induced increase in post-translational glycosylation also contributes to setting the upper thermal limit in Drosophila melanogaster, Danio rerio and C. elegans (Radermacher et al., 2014). In addition, defects in synaptonemal complex assembly (Bilgir et al., 2013) and in sperm (Harvey and Viney, 2007) contribute to setting the upper organismal limit in C. elegans. The restricted aerobic metabolism experimentally uncovered here is another important piece of the puzzle that contributes to defining both thermal limits.

Note added in proof

Another study investigating the temperature dependence of cell division processes in C. elegans and C. briggsae was published whilst the present manuscript was under consideration (Begasse et al., 2015).

Materials and methods

Culture and imaging

All the strains were maintained according to standard procedures (Brenner, 1974) in incubators set at the temperature at which embryos would then be imaged. Note, however, that since C. elegans was not fully viable above 25°C (see Figure 1A), worms were kept at the imaging temperature for only 6–24 hr prior to imaging. Embryos were dissected in 1× M9 medium tempered at the culture temperature, mounted on slides, placed under a coverslip and imaged using time-lapse DIC microscopy. Considering the crowded compressive environment of the uterus in the intact animal, and considering furthermore that the same mounting procedure was followed for all specimens at all temperatures, we surmise that the observed alterations in thermal response of embryo size and shape at given temperatures are not due to the mounting procedure. However, we cannot totally exclude that the observed changes in embryo size and shape may result from differential resilience to pressure of the cover slip used for imaging at the various temperatures.

The recording rate was adjusted as follows (we also mention the number n of embryos that were imaged from each condition):

C. elegans (N2): 10°C (9 s, n = 9), 12°C (8 s, n = 12), 14°C (6 s, n = 11), 16°C (6 s, n = 9), 20°C (5 s, n = 20), 24°C (4 s, n = 19), 25°C (4 s, n = 15), 26°C (4 s, n = 16), 27°C (2 s, n = 10).

C. briggsae (AF16): 12°C (8 s, n = 8), 14°C (7 s, n = 9), 16°C (6 s, n = 16), 20°C (4.5 s, n = 21), 25°C (3 s, n = 14), 28°C (2 s, n = 16), 29°C (1.5 s, n = 15).

atp-2(RNAi): 12°C (n = 14), 16°C (n = 16). In this condition, only few embryos were imaged over the whole first cell cycle (n(12°C) = 3, n(16°C) = 6).

cyc-1(RNAi): 12°C (n = 15), 16°C (n = 14). In this condition, only few embryos were imaged over the whole first cell cycle (n(12°C) = 2, n(16°C) = 4).

nuo-1(RNAi): 12°C (n = 8), 16°C (n = 15). In this condition, only few embryos were imaged over the whole first cell cycle (n(12°C) = 1, n(16°C) = 4).

While imaging, the temperature was regulated by an air-blower that cooled/heated both sample and objective, and which was feedback-controlled by a thermocouple (LABFACILITY ZO-PFA-K-1) inserted next to the embryo (Figure 1—figure supplement 1A). We also ensured that the device was well calibrated in the experimental thermal range [8, 32]°C (Figure 1—figure supplement 1B).

Quantifications

Prior to imaging, we made sure that embryos did not touch each other in order to facilitate segmentation. All DIC recordings were analyzed in a semi-automated fashion using Matlab. The analysis pipeline consisted of the following steps:

  1. We automatically segmented the eggshell contour using ASSET (Blanchoud et al., 2010). All the measured positions were then automatically corrected at each time frame by the centroid of the egg in the same frame. This was an important step because the air-blow from the temperature controller displaced the embryos during the recordings.

  2. We detected by careful visual inspection the onset of pseudo-cleavage (deepest furrow), mitotic entry (nuclear envelope breakdown) and cytokinesis (start of membrane invagination). Cytokinesis onset defined time 0; hence, all the times in our analysis were negative.

  3. We automatically detected the migrating pronuclei using a custom segmentation algorithm based on (Hamahashi et al., 2005). The exact timing of pronuclear meeting was then corrected by manual inspection. The speed of the female pronucleus was computed using its movement along the x-axis.

  4. After pronuclear meeting, the spindle poles were manually tracked until completion of centration-rotation. The angular and spatial trajectories were then fitted with the following model:
    x=A·|t|nKn+|t|n+cte,
    where x is the mid-position of the spindle poles or the angle they make with respect to the A-P axis. K represents the time at which centration (resp. rotation) is midway to completion. A relates to the initial position (resp. angle). cte is an offset and n relates to the steepness of the profile. The velocity can then be computed using ν = dx/dt.
  5. After mitotic entry, the spindle poles were manually tracked until oscillations had dampened out. The position along the x-axis was used to compute spindle pole elongation speed towards the anterior and posterior poles, while positions along the y-axis monitored spindle oscillations. In order to retrieve the oscillation frequency, amplitude and duration, we first identified the dominant angular frequency ω by fast Fourier transform. We then applied a low-pass filter with threshold 3 2π ω, to remove the noise, followed by a high-pass filter to remove any drift of the oscillations (with threshold 0.5 2π ω). Note that these filters did not change the dominant frequency of the signal, but were useful to better detect the peaks and measure the amplitude of the oscillations. Since the oscillations envelope was not always well fit by a sinusoidal function, we determined the duration of the oscillations by manual inspection of the oscillations profile (after filtering).

  6. In order to determine embryo size, the embryo was manually contoured just before cytokinesis onset in order to extract its area.

  7. The area of each daughter cell was manually contoured at time t0.25·tPM, where tPM is the duration of the first cell cycle, defined as the time from pronuclear meeting to cytokinesis onset.

Progeny tests

In order to perform progeny tests, five to ten young adults were placed on a plate with a 5 µl drop of OP50 and left to lay eggs at the temperature of interest (at least in triplicates). After 2–4 hr, we removed all the adults and counted the number of embryos on the plate (generally between 30 and 100 embryos, except at extreme temperatures beyond the thermal limits where few or no embryos were laid). After a few days at the temperature of interest, we assessed the number of larvae that had hatched.

Measurement of embryonic respiration

Unsynchronized embryos were obtained by bleaching adult wild-type C. elegans worms. The number of embryos per μl was then assessed by optical density (OD595 nm). We measured the respiration of wild-type C. elegans embryos from 9°C to 28°C using the Oroboros Oxygraph-2k, following the manufacturer's instructions. Prior to the experiment, a calibration was performed with 1× M9 buffer at 20°C in each chamber. We then dispensed 100,000 embryos in four chambers containing M9 buffer (i.e., 25,000 embryos/chamber): two chambers were used to go down in temperature from 20°C to 9°C, and two chambers were used to go up from 20°C to 28°C. The data from each chamber was normalized to its respiration rate at 20°C. We also repeated the same experiment using 35,000 embryos per chamber (i.e., 140,000 embryos in total).

In order to measure respiration at 20°C upon CYC-1 depletion, we dispensed 2000 wild-type embryos/plate on 16 large Petri dishes with OP50 bacteria as food source. After 28 hr at 20°C, all the resulting larvae were collected by centrifugation and washed three times to remove the OP50. Half of the collected larvae was re-suspended and distributed in 16 large OP50 plates, the other half in 16 large cyc-1(RNAi) IPTG feeding plates (prepared the day before and left at room temperature). After 44 hr at 20°C, embryos were collected in both control and cyc-1(RNAi) conditions by bleaching adult worms. Respiration was measured in two chambers as follows: after calibrating the machine with 1× M9 buffer at 20°C, 35,000 wild-type embryos were dispensed in each chamber and their respiration measured at that temperature. The chamber was then washed, and we dispensed 35,000 embryos from the cyc-1(RNAi) condition and likewise measured their respiration. For each chamber, we compared the respiration of cyc-1(RNAi) embryos over wild-type. The experiment was repeated once using 35,000 embryos in the four chambers. Note that the lethality incurred following cyc-1(RNAi) in these experiments was less pronounced than that reported in Figure 4C, probably owing to the need to scale up to assess respiration in a large number of embryos, such that the reported diminution of respiration is likely an underestimate of the actual impact.

RNAi

The C. elegans ORFeome RNAi library was a gift from Jean-François Rual and Marc Vidal, Harvard Medical School, Boston, USA (Rual et al., 2004). Bacterial RNAi feeding strains were prepared as described (Kamath et al., 2001). RNAi was performed by feeding early L3 larvae at temperature T with bacteria expressing dsRNA against the target gene for N hours at temperature T. The required feeding durations at each temperature were determined by fitting the duration of embryogenesis at 16°C (29 hr), 20°C (18 hr) and 25°C (14 hr) (Epstein and Shakes, 1995) with the following equation (Gillooly et al., 2002):

t(T)=A/exp(α·Tc1+TcT0),

where T0 = 273 K and Tc is the temperature in °C, yielding α = 0.1, in agreement with (Gillooly et al., 2002) (Figure 4—figure supplement 1). We therefore used this value of α to fit the reported feeding durations from the literature (∼72 hr at 15°C [Ahringer, 2006], ∼47 hr at 20°C [Afshar et al., 2005] and ∼38 hr at 22°C [Ahringer, 2006]), yielding the following feeding durations: 12°C (90 hr), 16°C (65 hr), 20°C (44 hr), 24°C (31 hr).

In order to verify that the results we uncovered in Figure 4B–D did not result from a general temperature-dependency in the effectiveness of the RNAi response, we also performed RNAi directed against AIR-1, a serine/threonine kinase required for spindle assembly (Hannak et al., 2001), a process not known to be related to metabolic status (Figure 4—figure supplement 2).

Statistical significance of thermal responses

Thermal response within the thermal range was assessed by Pearson correlation. A feature was considered to be temperature-dependent within the thermal range if its Pearson p-value was below 0.0014 (which assumes a Bonferroni correction for multiple-testing 35 features, i.e., 0.05/35 = 0.0014; c.f. Figure 1—source data 1).

Beyond the thermal range (TR), we assessed if there was a significant change in the thermal response of the features by F-test (nested-model analysis). For temperature-independent features, our first model was a simple regression y = mean (feature within TR). This model was nested within our second model y = mean (feature within TR) + β(T − 25) (T ≥ 25°C) which accounted for the potential change in the feature's thermal response beyond 25°C (a similar model was implemented for C. elegans lower thermal limit, as well as for C. briggsae at its respective thermal limits). We then determined if the second model (which has more parameters and therefore always fits the data better) significantly improved the fit of the data using an F-test. The F statistic is given by:

F=(RSS1RSS2p2p1)(RSS2np2),

where RSSi is the residual sum of squares of model i, pi the number of parameters of model i and n the number of data points. Under the null hypothesis, F follows an F-distribution with (p2p1; np2) degrees of freedom.

For temperature-dependent features, the first model was an exponential fit of the data within the thermal range: for example, for C. elegans, y=y0·exp(α·T(T[12°,25°])). The nested model included a linear regression for the data above 25°C (or similar for C. elegans lower thermal limit, as well as for C. briggsae at its respective thermal limits):

y=y0·exp(α·T(T[12°,25°]))+β(T25)(T25°C).

In some temperature-dependent cases, the data within the thermal range was better fitted by linear regression (the exponential and linear model having the same number of parameters, the model with smallest sum of residuals was considered to be the best). In those cases, we used the following first model: y=y0+α·T(T[12°,25°]).

And the nested model: y=y0+α·T(T[12°,25°])+β(T25)(T25°C).

In all cases (temperature-dependent or temperature-independent), the thermal response of a feature was considered to change beyond the upper thermal limit if the F-test p-value was below 0.0014 (threshold 0.05 corrected for multiple testing 35 features, i.e., 0.05/35 = 0.0014; c.f. Figure 1—source data 1). If the p-value was above 0.0014, the feature's thermal response above the upper thermal limit was tagged as unchanged in Figure 1—source data 1.

We also performed Mann Whitney U-tests to test if two distributions were different (Figure 4E–F).

Arrhenius kinetics—thermal response of cell cycle duration within the thermal range

Cell cycle durations within the thermal range were fitted to the following Arrhenius-like model (Arrhenius, 1915), to determine if the pace of cell division increased exponentially with temperature, as would be expected by Arrhenius kinetics:

duration=Aexp(EkBT),

where kB is the Boltzmann constant, T is the temperature (in [K]), E is the activation energy describing the thermal dependence (in [eV]) and A is a normalization constant.

Acknowledgements

Some strains were provided by the CGC, which is funded by NIH Office of Research Infrastructure Programs (P40 OD010440). We are very grateful to Alessandro De Simone for co-developing the pronuclei detection algorithm, to Johan Auwerx and Norman Moullan in his lab for guidance and technical help with the respiration experiments, as well as to Alexandra Bezler, Simon Blanchoud, Marie Delattre, Virginie Hamel, Andrew Hirst, Laurent Mouchiroud, Laurent Keller and Luc Pellerin for careful reading of the manuscript and useful comments. This work was supported by a SystemsX.ch Transition Postdoc Fellowship to AN (SXFSI0_141995). The authors declare no conflicts of interest.

Funding Statement

The funder had no role in study design, data collection and interpretation, or the decision to submit the work for publication.

Funding Information

This paper was supported by the following grant:

  • Swiss Initiative in Systems Biology Transition Postdoc Fellowship (SXFSI0_141995) to Aitana Neves.

Additional information

Competing interests

The authors declare that no competing interests exist.

Author contributions

AN, Conception and design, Acquisition of data, Analysis and interpretation of data, Drafting or revising the article.

CB, Contributed assistance for several experiments, including time-lapse recordings, progeny tests and respiration measurements.

PG, Conception and design, Analysis and interpretation of data, Drafting or revising the article.

Additional files

Source code 1.

In-house scripts to analyze embryos (Matlab).

DOI: http://dx.doi.org/10.7554/eLife.04810.012

elife04810s002.zip (53.8KB, zip)
DOI: 10.7554/eLife.04810.012

References

  1. Afshar K, Willard FS, Colombo K, Siderovski DP, Gönczy P. Cortical localization of the Galpha protein GPA-16 requires RIC-8 function during C. elegans asymmetric cell division. Development. 2005;132:4449–4459. doi: 10.1242/dev.02039. [DOI] [PubMed] [Google Scholar]
  2. Ahringer J. WormBook: the online review of C elegans biology. 2006. Reverse genetics. [Google Scholar]
  3. Anderson JL, Albergotti L, Ellebracht B, Huey RB, Phillips PC. Does thermoregulatory behavior maximize reproductive fitness of natural isolates of Caenorhabditis elegans? BMC Evolutionary Biology. 2011;11:157. doi: 10.1186/1471-2148-11-157. [DOI] [PMC free article] [PubMed] [Google Scholar]
  4. Anderson JL, Albergotti L, Proulx S, Peden C, Huey RB, Phillips PC. Thermal preference of Caenorhabditis elegans: a null model and empirical tests. The Journal of Experimental Biology. 2007;210:3107–3116. doi: 10.1242/jeb.007351. [DOI] [PubMed] [Google Scholar]
  5. Arrhenius S. Quantitative laws in biological chemistry. London: G. Bell; 1915. [Google Scholar]
  6. Atkinson D. Temperature and organism size—a biological law for ectotherms? Advances in Ecological Research. 1994;25:1–58. doi: 10.1016/S0065-2504(08)60212-3. [DOI] [Google Scholar]
  7. Atkinson D, Ciotti BJ, Montagnes DJ. Protists decrease in size linearly with temperature: ca. 2.5% C(−1) Proceedings Biological Sciences/The Royal Society. 2003;270:2605–2611. doi: 10.1098/rspb.2003.2538. [DOI] [PMC free article] [PubMed] [Google Scholar]
  8. Atkinson D, Morley SA, Hughes RN. From cells to colonies: at what levels of body organization does the ‘temperature-size rule’ apply? Evolution & Development. 2006;8:202–214. doi: 10.1111/j.1525-142X.2006.00090.x. [DOI] [PubMed] [Google Scholar]
  9. Begasse ML, Leaver M, Vazquez F, Grill SW, Hyman AA. Temperature dependence of cell division timing accounts for a shift in the thermal limits of C. elegans and C. briggsae. Cell Reports. 2015;10:647–653. doi: 10.1016/j.celrep.2015.01.006. [DOI] [PubMed] [Google Scholar]
  10. Bilgir C, Dombecki CR, Chen PF, Villeneuve AM, Nabeshima K. Assembly of the synaptonemal complex is a highly temperature-sensitive process that is supported by PGL-1 during Caenorhabditis elegans Meiosis. G3. 2013 doi: 10.1534/g3.112.005165. [DOI] [PMC free article] [PubMed] [Google Scholar]
  11. Blanchoud S, Budirahardja Y, Naef F, Gönczy P. ASSET: a robust algorithm for the automated segmentation and standardization of early Caenorhabditis elegans embryos. Developmental Dynamics. 2010;239:3285–3296. doi: 10.1002/dvdy.22486. [DOI] [PubMed] [Google Scholar]
  12. Braeckman BP, Houthoofd K, Vanfleteren JR. WormBook: the online review of C elegans biology. 2009. Intermediary metabolism; pp. 1–24. [DOI] [PMC free article] [PubMed] [Google Scholar]
  13. Brenner S. Genetics of Caenorhabditis elegans. Genetics. 1974;77:71–94. doi: 10.1093/genetics/77.1.71. [DOI] [PMC free article] [PubMed] [Google Scholar]
  14. Cutter AD. Divergence times in Caenorhabditis and Drosophila inferred from direct estimates of the neutral mutation rate. Molecular Biology and Evolution. 2008;25:778–786. doi: 10.1093/molbev/msn024. [DOI] [PubMed] [Google Scholar]
  15. Dillin A, Hsu AL, Arantes-Oliveira N, Lehrer-Graiwer J, Hsin H, Fraser AG, Kamath RS, Ahringer J, Kenyon C. Rates of behavior and aging specified by mitochondrial function during development. Science. 2002;298:2398–2401. doi: 10.1126/science.1077780. [DOI] [PubMed] [Google Scholar]
  16. Epstein HF, Shakes DC. Caenorhabditis elegans: modern biological analysis of an organism. Academic Press; 1995. [Google Scholar]
  17. Forster J, Hirst AG, Atkinson D. Warming-induced reductions in body size are greater in aquatic than terrestrial species. Proceedings of the National Academy of Sciences of USA. 2012;109:19310–19314. doi: 10.1073/pnas.1210460109. [DOI] [PMC free article] [PubMed] [Google Scholar]
  18. Gillooly JF, Charnov EL, West GB, Savage VM, Brown JH. Effects of size and temperature on developmental time. Nature. 2002;417:70–73. doi: 10.1038/417070a. [DOI] [PubMed] [Google Scholar]
  19. Giomi F, Fusi M, Barausse A, Mostert B, Pörtner HO, Cannicci S. Improved heat tolerance in air drives the recurrent evolution of air-breathing. Proceedings Biological Sciences/The Royal Society. 2014;281:20132927. doi: 10.1098/rspb.2013.2927. [DOI] [PMC free article] [PubMed] [Google Scholar]
  20. Hamahashi S, Onami S, Kitano H. Detection of nuclei in 4D Nomarski DIC microscope images of early Caenorhabditis elegans embryos using local image entropy and object tracking. BMC Bioinformatics. 2005;6:125. doi: 10.1186/1471-2105-6-125. [DOI] [PMC free article] [PubMed] [Google Scholar]
  21. Hannak E, Kirkham M, Hyman AA, Oegema K. Aurora-A kinase is required for centrosome maturation in Caenorhabditis elegans. The Journal of Cell Biology. 2001;155:1109–1116. doi: 10.1083/jcb.200108051. [DOI] [PMC free article] [PubMed] [Google Scholar]
  22. Harvey SC, Viney ME. Thermal variation reveals natural variation between isolates of Caenorhabditis elegans. Journal of Experimental Zoology Part B, Molecular and Developmental Evolution. 2007;308:409–416. doi: 10.1002/jez.b.21161. [DOI] [PubMed] [Google Scholar]
  23. Hazel JR. Thermal adaptation in biological membranes: is homeoviscous adaptation the explanation? Annual Review of Physiology. 1995;57:19–42. doi: 10.1146/annurev.ph.57.030195.000315. [DOI] [PubMed] [Google Scholar]
  24. Kamath RS, Martinez-Campos M, Zipperlen P, Fraser AG, Ahringer J. Effectiveness of specific RNA-mediated interference through ingested double-stranded RNA in Caenorhabditis elegans. Genome Biology. 2001;2:RESEARCH0002. doi: 10.1186/gb-2000-2-1-research0002. [DOI] [PMC free article] [PubMed] [Google Scholar]
  25. Karan D, Morin JP, Moreteau B, David JR. Body size and developmental temperature in Drosophila melanogaster: analysis of body weight reaction norm. Journal of Thermal Biology. 1998;23:301–309. doi: 10.1016/S0306-4565(98)00021-7. [DOI] [Google Scholar]
  26. Melzner F, Bock C, Pörtner HO. Critical temperatures in the cephalopod Sepia officinalis investigated using in vivo 31P NMR spectroscopy. The Journal of Experimental Biology. 2006;209:891–906. doi: 10.1242/jeb.02054. [DOI] [PubMed] [Google Scholar]
  27. Murray P, Hayward SA, Govan GG, Gracey AY, Cossins AR. An explicit test of the phospholipid saturation hypothesis of acquired cold tolerance in Caenorhabditis elegans. Proceedings of the National Academy of Sciences of USA. 2007;104:5489–5494. doi: 10.1073/pnas.0609590104. [DOI] [PMC free article] [PubMed] [Google Scholar]
  28. Pörtner HO. Climate variations and the physiological basis of temperature dependent biogeography: systemic to molecular hierarchy of thermal tolerance in animals. Comparative Biochemistry and Physiology Part A, Molecular & Integrative Physiology. 2002;132:739–761. doi: 10.1016/S1095-6433(02)00045-4. [DOI] [PubMed] [Google Scholar]
  29. Pörtner HO, Bennett AF, Bozinovic F, Clarke A, Lardies MA, Lucassen M, Pelster B, Schiemer F, Stillman JH. Trade-offs in thermal adaptation: the need for a molecular to ecological integration. Physiological and Biochemical Zoology. 2006;79:295–313. doi: 10.1086/499986. [DOI] [PubMed] [Google Scholar]
  30. Prasad A, Croydon-Sugarman MJ, Murray RL, Cutter AD. Temperature-dependent fecundity associates with latitude in Caenorhabditis briggsae. Evolution. 2011;65:52–63. doi: 10.1111/j.1558-5646.2010.01110.x. [DOI] [PubMed] [Google Scholar]
  31. Radermacher PT, Myachina F, Bosshardt F, Pandey R, Mariappa D, Müller HA, Lehner CF. O-GlcNAc reports ambient temperature and confers heat resistance on ectotherm development. Proceedings of the National Academy of Sciences of USA. 2014;111:5592–5597. doi: 10.1073/pnas.1322396111. [DOI] [PMC free article] [PubMed] [Google Scholar]
  32. Riche S, Zouak M, Argoul F, Arneodo A, Pecreaux J, Delattre M. Evolutionary comparisons reveal a positional switch for spindle pole oscillations in Caenorhabditis embryos. The Journal of Cell Biology. 2013;201:653–662. doi: 10.1083/jcb.201210110. [DOI] [PMC free article] [PubMed] [Google Scholar]
  33. Rual JF, Ceron J, Koreth J, Hao T, Nicot AS, Hirozane-Kishikawa T, Vandenhaute J, Orkin SH, Hill DE, van den Heuvel S, Vidal M. Toward improving Caenorhabditis elegans phenome mapping with an ORFeome-based RNAi library. Genome Research. 2004;14:2162–2168. doi: 10.1101/gr.2505604. [DOI] [PMC free article] [PubMed] [Google Scholar]
  34. Schumacher JM, Ashcroft N, Donovan PJ, Golden A. A highly conserved centrosomal kinase, AIR-1, is required for accurate cell cycle progression and segregation of developmental factors in Caenorhabditis elegans embryos. Development. 1998;125:4391–4402. doi: 10.1242/dev.125.22.4391. [DOI] [PubMed] [Google Scholar]
  35. Stein LD, Bao Z, Blasiar D, Blumenthal T, Brent MR, Chen N, Chinwalla A, Clarke L, Clee C, Coghlan A, Coulson A, D'Eustachio P, Fitch DH, Fulton LA, Fulton RE, Griffiths-Jones S, Harris TW, Hillier LW, Kamath R, Kuwabara PE, Mardis ER, Marra MA, Miner TL, Minx P, Mullikin JC, Plumb RW, Rogers J, Schein JE, Sohrmann M, Spieth J, Stajich JE, Wei C, Willey D, Wilson RK, Durbin R, Waterston RH. The genome sequence of Caenorhabditis briggsae: a platform for comparative genomics. PLOS Biology. 2003;1:E45. doi: 10.1371/journal.pbio.0000045. [DOI] [PMC free article] [PubMed] [Google Scholar]
  36. Svensk E, Ståhlman M, Andersson CH, Johansson M, Borén J, Pilon M. PAQR-2 regulates fatty acid desaturation during cold adaptation in C. elegans. PLOS Genetics. 2013;9:e1003801. doi: 10.1371/journal.pgen.1003801. [DOI] [PMC free article] [PubMed] [Google Scholar]
  37. Tsang WY, Sayles LC, Grad LI, Pilgrim DB, Lemire BD. Mitochondrial respiratory chain deficiency in Caenorhabditis elegans results in developmental arrest and increased life span. Journal of Biological Chemistry. 2001;276:32240–32246. doi: 10.1074/jbc.M103999200. [DOI] [PubMed] [Google Scholar]
  38. Van Voorhies WA. Bergmann size clines: a simple explanation for their occurrence in ectotherms. Evolution. 1996;50:1259–1264. doi: 10.2307/2410666. [DOI] [PubMed] [Google Scholar]
  39. Wittmann AC, Schröer M, Bock C, Steeger HU, Paul RJ, Pörtner HO. Indicators of oxygen-and capacity-limited thermal tolerance in the lugworm Arenicola marina. Climate Research. 2008;37:227–240. doi: 10.3354/cr00763. [DOI] [Google Scholar]
  40. Woods HA. Egg-mass size and cell size: effects of temperature on oxygen distribution. American Zoologist. 1999;39:244–252. [Google Scholar]
eLife. 2015 May 1;4:e04810. doi: 10.7554/eLife.04810.013

Decision letter

Editor: Fiona M Watt1

eLife posts the editorial decision letter and author response on a selection of the published articles (subject to the approval of the authors). An edited version of the letter sent to the authors after peer review is shown, indicating the substantive concerns or comments; minor concerns are not usually shown. Reviewers have the opportunity to discuss the decision before the letter is sent (see review process). Similarly, the author response typically shows only responses to the major concerns raised by the reviewers.

[Editors’ note: this article was originally rejected after discussions between the reviewers, but the authors were invited to resubmit after an appeal against the decision.]

Thank you for choosing to send your work entitled “Cellular hallmarks reveal critical contribution of aerobic metabolism at the thermal limits” for consideration at eLife. Your full submission has been evaluated by Fiona Watt (Senior editor) and three peer reviewers, one of whom, Hans-Otto Portner, has agreed to reveal his identity. The decision was reached after discussions between the reviewers. Based on our discussions and the individual reviews below, we regret to inform you that your work will not be considered further for publication in eLife.

We are sending you the full comments of all three reviewers. In summary, they all agree that the work is very interesting. However, they have two key criticisms. First, the work does not specifically address the mechanistic link between changes in embryo size/shape, thermal effects and aerobic metabolism. Secondly, the presentation and discussion of the work is confusing. In discussing whether to reject the manuscript or encourage a revision, the reviewers concluded that it would take more than three months to generate the data to address the first criticism. If, however, you already have some additional mechanism that addresses the first point we would, of course, consider a rebuttal.

Reviewer #1:

Summary: This paper explores how embryos from two related nematode species respond to changes in temperature. The authors examine 35 features of 1-cell zygotes in response to temperature and identify those features that behave differently at the animals' thermal limits. In particular, they find that embryos tend to increase their surface to volume ratio at the thermal limits. Previous theoretical studies have suggested that changes in aerobic capacity underlie thermal stress. Consistent with this hypothesis, the authors found that depleting key metabolic enzymes also causes an increase in surface-to-volume ratio. Based on this correlation, the authors conclude that “aerobic metabolism is limiting at both lower and upper thermal limits”.

Critique:

1) The main thesis of this work is based on a correlation. There is no direct evidence that aerobic metabolism is limiting at the thermal limits. It would seem that simple experiments could be done to demonstrate this hypothesis more directly. For example, do embryos depleted for key aerobic metabolism enzymes become hypersensitive to temperature changes? Without additional experiments that test the hypothesis directly, the data are too preliminary.

2) The presentation of the data is often confusing. For example, Figure 1 reports on embryo size (do you mean volume?) and embryo shape (length/width). Surface-to-volume ratio, which in the Discussion seems to be the more relevant parameter, is not presented in the figure. As a result, it is very difficult to assess the significance of the differences/findings.

3) The data do not seem to always be fully explained in the text. The authors state that embryo size decreases below the lower thermal limit (12 to 10 degrees), but in fact embryo size increases dramatically (25% increase) between 14 to 12 degrees, before modestly going down between 12 and 10 degrees (Figure 2E). This up-and-down behavior is not discussed.

4) The authors do not describe how the embryos were mounted on slides for imaging. If the embryos were placed under a coverslip, the pressure from the coverslip could affect their size and/or shape. If so, differences between different conditions could reflect differences in the resistance of the eggshell to the coverslip pressure, not actual differences in size.

Reviewer #2:

This is an interesting paper relating observations on functional changes to thermal limitation in Caenorhabditis elegans embryos. This non-conventional way of addressing this issue will be stimulating for the animal biology community. Nonetheless the text should be amended and jargon reduced to make it more widely accessible. Some issues may be commonly expressed that way in the nematode world, but deserve explanation, e.g. why and how does surface to volume ratio relate to aerobic metabolism?

This writing, in the Introduction, is a bit imprecise: the biogeographic range relates to the thermal window of a species, so both upper and lower limits. This fundamental thermal range is not fully exploited but forms the basis of the exploited range.

Results and Discussion, third paragraph: it is not correct that the onset of anaerobic metabolism characterizes the first line of thermal limitation. The cited papers by Pörtner and colleagues refer to what is called the concept of oxygen and capacity limited thermal tolerance (OCLTT, cf. Pörtner 2010 J. exp Biol.). The earliest limit is a loss in performance caused by a mismatch in oxygen supply capacity and associated costs as well as hypoxemia constraining performance capacity, leaving less energy for e.g. growth (Pörtner and Knust, 2007, Science). So thermal limits then lead to the onset of anaerobic metabolism. These findings have recently been set into perspective across organism domains (Storch et al., 2014, Global Change Biology), which should caution authors with respect to some of their statements on prokaryotes and get their rationale into clearer shape.

At the end of the Introduction: MASROS seems as a spinoff of OCLTT, this link should be mentioned.

In the embryos oxygen supply may become constrained by diffusion limitations of supply and demand.

Results and Discussion, seventh paragraph: the simulation of the effect of hypoxemia on aerobic scope by lowering ATP contents is a great trick to address the question. I was missing estimates of change in ATP levels? Are other effects conceivable? Under which oxygen supply conditions would ATP concentrations change in vivo?

Results and Discussion, fourth paragraph: you should not talk about thermal limitation before actually identifying them. Is the plateauing of cell cycle an early limitation (e.g. pejus limits?)

Results and Discussion, sixth paragraph: ditto, you should use all of these data later to fit it into a conceptual framework of limitation.

This leaves my criticism on the gaps in the interpretation of these interesting data. Studying the OCLTT concept may provide the framework and terminology needed to build a coherent story, considering various levels of thermal limitation. This may also lead to a fresh look at some of their data and on how to best integrate them.

Reviewer #3:

Although this study provides novel quantitative observations on the thermal sensitivity of early embryonic development, the key conclusions of the paper are only weakly supported by the experimental data. Moreover, data presentation and interpretation as well as the placing of the observations in their general context are often unclear.

1) The link between temperature effects on embryo size/shape and aerobic metabolism is not explicitly tested. The experimental data (RNAi) is suggestive but not a single experiment (or literature citation) is provided that would inform about temperature-dependent changes in aerobic metabolism in embryos. Therefore, while the RNAi data is suggestive, they are clearly too preliminary to support the strong conclusions made.

2) The actual data is not sufficiently discussed. For example, a number of phenotypes measured show non-linear temperature responses, including reduced embryo size at lower temperatures (e.g. Figure 2E, 3E). In C. elegans, embryo size seems reduced only when comparing 10C to 12C treatment; in contrast, when comparing all temperatures above 12C to 10C, embryo size seems increased. These non-linear responses are in my view incongruent with the hypothesis on aerobic metabolism—yet these experimental data are not discussed in detail.

3) The thermal limits are defined as upper and lower temperatures at which embryonic hatching is reduced to ∼90% but it is unclear what leads to this 10% reduction, e.g. if changes in early embryonic development contribute to this. Moreover, for data obtained beyond thermal limits it is unclear if any of the changes observed (e.g. embryo shape) contribute to increased embryonic mortality. [Also: thermal range is not a generic term but should be explicitly linked to the phenotype measured, e.g. embryonic viability, fertility, survival. A given genotype will have different thermal limits for these different phenotypes].

4) The data focuses on mean changes in developmental phenotypes although observed temperature effects (as many stressors in general) strongly increase variance of phenotypes at extreme temperatures (e.g. debuffering). This is not analysed or discussed appropriately.

5) The evolutionary context provided for this study is a bit naïve, sometimes wrong (e.g. first two sentences of the Introduction). For example, thermal adaptation is rarely a species-specific trait, but there is ample genetic variation in thermal responses within a species. This is important also in the context of this study: C. briggsae shows extensive genetic variation in upper thermal limits of reproductive capacity with genetically distinct tropical and temperate clades (Prasad et al. 2011). [In addition, C. briggsae occurs in many cold regions, world-wide, cf. Results and Discussion, last line of first paragraph]. Similarly, the discussion of literature on temperature effects on aerobic metabolism etc. is not sufficiently clear to follow the authors' logic.

[Editors’ note: what now follows is the decision letter after the authors submitted for further consideration.]

Thank you for sending your work entitled “Cellular hallmarks reveal critical contribution of aerobic metabolism at the thermal limits” for consideration at eLife. Your rebuttal was evaluated by Fiona Watt (Senior editor) and the three original reviewers.

We feel that your manuscript can potentially be published in eLife, but only subject to your addressing the remaining concerns of Reviewers 1 and 3. If you choose to submit a revised version of the manuscript it will be your final opportunity to satisfy the reviewers—we are not willing to consider any further rounds of revision. This reviewers’ major criticisms concern the RNAi experiments and are described in lightly edited format below:

Overall, the manuscript presents many measurements (e.g. size, shape, viability) but how these integrate and how they relate to aerobic metabolism and thermal limits remain mostly unclear. No direct respiration rate measurements were taken in RNAi-treated animals and it remains unclear to what extent aerobic metabolism and embryonic lethality are causally linked in wt animals. Statistical analyses for the new data appear lacking and the experimental design requires more explanation. The authors show that embryos at the thermal limit are less sensitive to depletion of mitochondrial activity by RNAi, than animals in the thermal range. At the upper limit of the thermal range, the data show that RNAi depletion of two mitochondrial enzymes (but curiously not a third one) has no effect on viability. There are no controls to show that the RNAi depletion works equally well at all temperatures and for all three genes, so it is possible that this odd behavior is due to incomplete depletion at different temperatures and/or for different genes. In addition, the logic used to interpret these experiments is not clear. It would seem that if respiration becomes limiting at the thermal limit, then embryos near the limit should become more sensitive, not less, to depletion of respiratory components. In this line of reasoning, the new data would suggest that, in fact, respiration is not the rate limiting step at the thermal limit.

In addition, reviewer 1 was still troubled by the possibility that changes in eggshell composition in embryos raised at different temperatures could cause embryos to appear larger or smaller due to different resilience to the pressure of the cover slip used for imaging. We would be grateful if you could deal with this possibility when discussing your data.

eLife. 2015 May 1;4:e04810. doi: 10.7554/eLife.04810.014

Author response


[Editors’ note: the author responses to the first round of peer review follow.]

After carefully reading the comments and suggestions made by the reviewers, we conducted experiments and modified the manuscript to address in full the issues raised by the three reviewers, as described in detail in the accompanying rebuttal letter. In particular, the first criticism raised by reviewers #1 and #3 concerning the lack of direct evidence for aerobic metabolism being restricted at the thermal limits has now been addressed. As we show in the new Figure 4A, respiration measurements reveal that aerobic metabolism is indeed reduced beyond both lower and upper thermal limits. Moreover, we also uncovered that embryos depleted of distinct components of the mitochondrial respiratory chain are less affected towards the thermal limits than within the thermal range (new Figure 4B-D). With these new findings, our work provides for the first time compelling evidence that restricted aerobic metabolism is a key feature of thermal limits in a terrestrial metazoan organism. Moreover, we altered the text to render it more accessible to a broader audience, clarifying the presentation and discussion of the work, thus addressing the second main criticism of the reviewers.

We are sending you the full comments of all three reviewers. In summary, they all agree that the work is very interesting. However, they have two key criticisms. First, the work does not specifically address the mechanistic link between changes in embryo size/shape, thermal effects and aerobic metabolism. Secondly, the presentation and discussion of the work is confusing. In discussing whether to reject the manuscript or encourage a revision, the reviewers concluded that it would take more than three months to generate the data to address the first criticism. If, however, you already have some additional mechanism that addresses the first point we would, of course, consider a rebuttal.

Reviewer #1:

Summary: This paper explores how embryos from two related nematode species respond to changes in temperature. The authors examine 35 features of 1-cell zygotes in response to temperature and identify those features that behave differently at the animals' thermal limits. In particular, they find that embryos tend to increase their surface to volume ratio at the thermal limits. Previous theoretical studies have suggested that changes in aerobic capacity underlie thermal stress. Consistent with this hypothesis, the authors found that depleting key metabolic enzymes also causes an increase in surface-to-volume ratio. Based on this correlation, the authors conclude that “aerobic metabolism is limiting at both lower and upper thermal limits”.

Critique:

1) The main thesis of this work is based on a correlation. There is no direct evidence that aerobic metabolism is limiting at the thermal limits. It would seem that simple experiments could be done to demonstrate this hypothesis more directly. For example, do embryos depleted for key aerobic metabolism enzymes become hypersensitive to temperature changes? Without additional experiments that test the hypothesis directly, the data are too preliminary.

We thank the reviewer for raising this very important point. Indeed, our initial submission was missing direct evidence that aerobic metabolism is restricted at the thermal limits. This critical issue has now been addressed by measuring the respiration rate of wild-type C. elegans embryos from 9°C to 28°C. As we now show in Figure 4A, this novel experiment revealed that respiration increases exponentially within the thermal range, as predicted by Arrhenius-like kinetics (Arrhenius, 1915). Strikingly in addition, we found that respiration decreases both below the lower thermal limit and above the upper thermal limit. These findings indicate that aerobic capacity is indeed reduced beyond both thermal limits as compared to within the thermal range.

Importantly in addition, as suggested by the reviewer, we further challenged our findings by now measuring embryonic viability over a wide range of temperatures upon depletion of key aerobic metabolism proteins (subunits of complex I, III and V of the mitochondrial respiratory chain). We reasoned that if aerobic capacity is utilized to a lesser extent for energy production beyond both thermal limits than within the thermal range, then compromising mitochondrial activity should also have less of an impact at the thermal limits than within the thermal range. Remarkably, we indeed found that embryonic lethality was reduced towards the thermal limits as compared to within the thermal range in atp-2(RNAi), cyc-1(RNAi) and nuo-1(RNAi) embryos (Figure 4B-D). These results offer strong experimental support to the notion that the capacity of the mitochondrial respiratory chain is indeed reduced beyond both thermal limits.

All these critical findings are now presented and discussed in our manuscript in the Results section entitled “Cellular hallmarks of the thermal limits are recapitulated when impairing aerobic metabolism”.

2) The presentation of the data is often confusing. For example, Figure 1 reports on embryo size (do you mean volume?) and embryo shape (length/width). Surface-to-volume ratio, which in the Discussion seems to be the more relevant parameter, is not presented in the figure. As a result, it is very difficult to assess the significance of the differences/findings.

We apologize for having been insufficiently clear in our presentation of the data. We have put great effort in extensively rewriting the manuscript in order to present the data more clearly. In Figure 2-3, we report embryo area, which we use as a proxy of embryo size given the rotational symmetry of C. elegans embryos (see Materials and methods). In the previous version of the manuscript, surface-to-volume ratios were not reported because they were merely estimated and not measured, as explained in the Materials and methods of the initial submission. In the new version of the manuscript, we reduce the importance of surface-to-volume ratios and focus instead on the signature cellular changes at the thermal limits, namely embryo size reduction below the lower thermal limit and embryo elongation above the upper thermal limit, both of which have been directly measured. See Results section entitled “Cellular hallmarks of the thermal limits are recapitulated when impairing aerobic metabolism”.

3) The data do not seem to always be fully explained in the text. The authors state that embryo size decreases below the lower thermal limit (12 to 10 degrees), but in fact embryo size increases dramatically (25% increase) between 14 to 12 degrees, before modestly going down between 12 and 10 degrees (Figure 2E). This up-and-down behavior is not discussed.

We thank the reviewer for having brought up this important point. As we now explain better (see Introduction, third paragraph and Results section “Embryo size and shape are sensitive to the thermal limits), the fact that body size is smaller at higher temperatures within the thermal range is common among ectotherms and has been coined the temperature-size rule (Atkinson, 1994; Forster et al., 2012). Such a size decrease with warmer temperatures is believed to be an adaptive response to preserve aerobic capacity by yielding an increase in surface-to-volume ratio and thus potentially in oxygen supply by facilitated diffusion (Atkinson et al., 2006).

In the previous version of the manuscript, we had focused our attention solely on the reversal of this temperature-size rule below the lower thermal limit, which has been reported previously only in protists and in Drosophila (Karan et al., 1998; Atkinson et al., 2003), and hypothesized to be driven by restricted aerobic metabolism below the lower thermal limit. The new version of the manuscript maintains this focus, while putting it in the context of the temperature-size rule delineated above, thus clarifying what may have appeared as an unexpected behavior at the lower thermal limit.

4) The authors do not describe how the embryos were mounted on slides for imaging. If the embryos were placed under a coverslip, the pressure from the coverslip could affect their size and/or shape. If so, differences between different conditions could reflect differences in the resistance of the eggshell to the coverslip pressure, not actual differences in size.

This point indeed deserved some further clarification. As we now explain in the first paragraph of Materials and methods, embryos were dissected in 1x M9 medium tempered at the culture temperature, mounted on slides, placed under a coverslip and imaged using time-lapse DIC microscopy. Considering the crowded compressive environment of the uterus in the intact animal, and considering furthermore that the same mounting procedure was followed for all specimens at all temperatures, we surmise that the observed alterations in thermal response of embryo size and shape at given temperatures are not due to the mounting procedure.

Reviewer #2:

This is an interesting paper relating observations on functional changes to thermal limitation in Caenorhabditis elegans embryos. This non-conventional way of addressing this issue will be stimulating for the animal biology community. Nonetheless the text should be amended and jargon reduced to make it more widely accessible. Some issues may be commonly expressed that way in the nematode world, but deserve explanation, e.g. why and how does surface to volume ratio relate to aerobic metabolism?

We thank the reviewer for acknowledging our non-conventional way of addressing this issue and also believe that our findings will be stimulating for the animal biology community at large.

This writing, in the Introduction, is a bit imprecise: the biogeographic range relates to the thermal window of a species, so both upper and lower limits. This fundamental thermal range is not fully exploited but forms the basis of the exploited range.

We agree with the reviewer that our writing was somewhat imprecise and now clearly mention in the Introduction that other factors also determine the actual exploited range:

“Partly as a result, organisms tend to distribute in the ocean and on land according to latitude as well as depth and altitude, although other elements such as availability of food and light also play a role in shaping preferred habitats (Pörtner et al., 2006; Pörtner, 2002; Prasad et al., 2011).”

Results and Discussion, third paragraph: it is not correct that the onset of anaerobic metabolism characterizes the first line of thermal limitation. The cited papers by Pörtner and colleagues refer to what is called the concept of oxygen and capacity limited thermal tolerance (OCLTT, cf. Pörtner 2010 J. exp Biol.). The earliest limit is a loss in performance caused by a mismatch in oxygen supply capacity and associated costs as well as hypoxemia constraining performance capacity, leaving less energy for e.g. growth (Pörtner and Knust, 2007, Science). So thermal limits then lead to the onset of anaerobic metabolism. These findings have recently been set into perspective across organism domains (Storch et al., 2014, Global Change Biology), which should caution authors with respect to some of their statements on prokaryotes and get their rationale into clearer shape.

We acknowledge that our writing was far too simplistic in an attempt to accommodate a broad readership, thus loosing part of its meaning. We have now made sure to clearly mention that a mismatch in oxygen supply and demand determines a first thermal limit (Pörtner, 2002; Pörtner et al., 2006). We now also explicitly describe the experiments in both aquatic organisms and prokaryotes to better guide the reader through what has been achieved so far and what still needed further validation prior to our work. See Introduction:

Oxygen supply has been postulated to play a role in setting thermal limits in multicellular organisms. […] even in the prokaryote E. coli (Morrison and Shain, 2008), suggesting that energy limitation may be a general feature that characterizes life on the edge of the thermal range.”

At the end of the Introduction: MASROS seems as a spinoff of OCLTT, this link should be mentioned.

Indeed, MASROS is based on the OCLTT, and we now first explain OCLTT in the Introduction, and only then describe how this yields to the MASROS. See Introduction:

“Body size decreases with augmented temperature in the vast majority of ectotherms (“temperature-size rule”) (Atkinson, 1994; Forster et al, 2012), thereby increasing surface to volume ratio and thus potentially oxygen availability. (...) This has led to the suggestion that alterations in cell size in response to changes in temperature within the thermal range are adaptive responses to preserve aerobic capacity, which has been dubbed the MASROS hypothesis (Maintain Aerobic Scope—Regulate Oxygen Supply) (Atkinson et al, 2006).”

In the embryos oxygen supply may become constrained by diffusion limitations of supply and demand.

Results and Discussion, seventh paragraph: the simulation of the effect of hypoxemia on aerobic scope by lowering ATP contents is a great trick to address the question. I was missing estimates of change in ATP levels? Are other effects conceivable? Under which oxygen supply conditions would ATP concentrations change in vivo?

This is indeed an important point. Measurements of ATP levels have already been performed on extracts from adult worms, revealing a ∼2-5 fold decrease in ATP levels in conditions that compromise the mitochondrial respiratory chain (Dillin et al., 2002). We sought to perform analogous measurements on embryonic extracts, but observed a confounding lack of reproducibility. This may stem in part from the fact that extracts are by necessity from unsynchronized embryos (as large scale synchronization is not possible in this system) and that ATP levels may vary considerably between the early and the late stages of embryogenesis.

As we now discuss in the Results and Discussion, other effects are indeed conceivable, including changes in cytosolic pH or an increase in reactive oxygen species.

To our knowledge, it is not known under which oxygen conditions ATP levels would change in vivo. Although this is an interesting point that will deserve further investigation, we are of the view that it falls outside of the central scope of our manuscript.

Results and Discussion, fourth paragraph: you should not talk about thermal limitation before actually identifying them. Is the plateauing of cell cycle an early limitation (e.g. pejus limits?)

Results and Discussion, sixth paragraph: ditto, you should use all of these data later to fit it into a conceptual framework of limitation.

We define the thermal limits as the edges of the thermal range within which >90% of embryos hatch. Considering the new respiration measurements presented in Figure 4A, we believe that these limit temperatures are very similar to the pejus limits defined by others (Pörtner, 2002).

Throughout the text, we then use the thermal limits defined by embryonic viability tests and examine various cellular features at those limits. Interestingly, we uncovered that the thermal response of select cellular features changed precisely at the limit temperatures defined by the embryonic viability tests (see Figure 1A). This is now mentioned in our manuscript in the Results section.

This leaves my criticism on the gaps in the interpretation of these interesting data. Studying the OCLTT concept may provide the framework and terminology needed to build a coherent story, considering various levels of thermal limitation. This may also lead to a fresh look at some of their data and on how to best integrate them.

We warmly thank the reviewer for encouraging us in this direction. As a result, we rewrote the whole manuscript using the framework and terminology from the OCLTT and MASROS hypotheses, and believe that the text is now more coherent and the data and interpretations more solid.

Reviewer #3:

Although this study provides novel quantitative observations on the thermal sensitivity of early embryonic development, the key conclusions of the paper are only weakly supported by the experimental data. Moreover, data presentation and interpretation as well as the placing of the observations in their general context are often unclear.

We agree with the reviewer that the key conclusions drawn from the experiments presented in the initial submission required further validation. As we mentioned earlier in this rebuttal (see response to point 1 from reviewer #1), we conducted both respiration measurements as well as progeny tests in embryos with impaired aerobic metabolism over a wide range of temperatures. The resulting data strongly support the notion that aerobic metabolism is indeed restricted beyond the thermal limits. We also ensured that the data is clearly presented and that our interpretations are thoroughly discussed throughout the new rendition of the manuscript.

1) The link between temperature effects on embryo size/shape and aerobic metabolism is not explicitly tested. The experimental data (RNAi) is suggestive but not a single experiment (or literature citation) is provided that would inform about temperature-dependent changes in aerobic metabolism in embryos. Therefore, while the RNAi data is suggestive, they are clearly too preliminary to support the strong conclusions made.

We thank the reviewer for suggesting this crucial experiment, which was also suggested by reviewer #1. We kindly ask reviewer #3 to refer to the answer to point 1 of reviewer #1, where we explain in detail how this issue has been addressed.

2) The actual data is not sufficiently discussed. For example, a number of phenotypes measured show non-linear temperature responses, including reduced embryo size at lower temperatures (e.g. Figure 2E, 3E). In C. elegans, embryo size seems reduced only when comparing 10C to 12C treatment; in contrast, when comparing all temperatures above 12C to 10C, embryo size seems increased. These non-linear responses are in my view incongruent with the hypothesis on aerobic metabolism—yet these experimental data are not discussed in detail.

We acknowledge that the data within the thermal range, in particular regarding embryo size, was not discussed sufficiently in the initial submission. Reviewer #1 had a similar comment, which we addressed above (see answer to her/his point 3). As we explain in that paragraph, such non-linear responses are actually very supportive of the hypothesis on aerobic metabolism.

3) The thermal limits are defined as upper and lower temperatures at which embryonic hatching is reduced to ∼90% but it is unclear what leads to this 10% reduction, e.g. if changes in early embryonic development contribute to this. Moreover, for data obtained beyond thermal limits it is unclear if any of the changes observed (e.g. embryo shape) contribute to increased embryonic mortality.

This point is well taken: we indeed do not know which stage of embryonic development is most sensitive to the thermal limits and also cannot ascertain whether the changes that we identified during the first cell cycle contribute to the observed lethality. We now explicitly state this limitation in our Conclusions. Interestingly, however, we uncovered that the thermal response of select cellular features changed precisely at the limit temperatures defined by embryonic viability tests, suggesting at the minimum strong correlation.

[Also: thermal range is not a generic term but should be explicitly linked to the phenotype measured, e.g. embryonic viability, fertility, survival. A given genotype will have different thermal limits for these different phenotypes].

We fully agree with the reviewer that thermal range is not a generic term but should always be linked to some phenotype. In our manuscript, we have linked it to embryonic viability. After defining this range at the beginning of the Results section, we then asked if cellular changes were readily observable at those limit temperatures defined by embryonic viability tests, and strikingly found this to be the case for some (see Figures 2-3).

4) The data focuses on mean changes in developmental phenotypes although observed temperature effects (as many stressors in general) strongly increase variance of phenotypes at extreme temperatures (e.g. debuffering). This is not analysed or discussed appropriately.

We thank the reviewer for highlighting this point. Actually, we represented the data in terms of boxplots in order to make sure that the average, the variance and any potential skew in the data would be clearly visible. We did not discuss this in our manuscript, because we had verified as prior to submission that the variance of cellular features did not increase beyond the thermal limits as compared to within the thermal range. This can be seen also from the colored boxes in Figures 2-3 representing data beyond the thermal limits. This is now mentioned in the legend of Figure 2.

5) The evolutionary context provided for this study is a bit naïve, sometimes wrong (e.g. first two sentences of the Introduction). For example, thermal adaptation is rarely a species-specific trait, but there is ample genetic variation in thermal responses within a species. This is important also in the context of this study: C. briggsae shows extensive genetic variation in upper thermal limits of reproductive capacity with genetically distinct tropical and temperate clades (Prasad et al. 2011). [In addition, C. briggsae occurs in many cold regions, world-wide, cf. Results and Discussion, last line of first paragraph].

We agree with the reviewer that the evolutionary context initially provided was somewhat naïve. We fully acknowledge that thermal adaptation is generally not a species-specific trait and that the introductory sentences in our initial submission were overly simplistic. We have now rephrased the first paragraph of our Introduction in order to better account for the multiple factors that may determine an organism's thermal range. It now reads:

“All organisms live within a given thermal range, beyond which growth and fecundity decrease (Pörtner et al., 2006). Partly as a result, organisms tend to distribute in the ocean and on land according to latitude as well as depth and altitude, although other elements such as availability of food and light also play a role in shaping preferred habitats (Pörtner et al., 2006; Pörtner, 2002; Prasad et al., 2011). Despite their importance, the mechanisms that set the thermal limits remain incompletely understood.”

We thank the reviewer for noting that C. briggsae also occurs in many cold regions and, therefore, that our writing was too generic. We have slightly modified the text as follows to address this point (Results and Discussion):

We thus found that the thermal limits of C. elegans were of 12° and 25°C (Figure 1A), and those of C. briggsae of 14° and 27°C (Figure 1B), in line with the fact that C. briggsae usually lives in warmer climates than C. elegans (Prasad et al., 2011).”

Similarly, the discussion of literature on temperature effects on aerobic metabolism etc. is not sufficiently clear to follow the authors' logic.

We apologize for the confusion generated by the previous version of the manuscript and sincerely hope that our logic is now easier to follow with this new version. We kindly ask the reviewer to refer to our new Introduction and Results sections.

[Editors’ note: the author responses to the re-review follow.]

Overall, the manuscript presents many measurements (e.g. size, shape, viability) but how these integrate and how they relate to aerobic metabolism and thermal limits remain mostly unclear.

We summarize below how, in our view, our findings form a coherent story. We have also further clarified this coherence throughout the revised text of the manuscript.

1) Changes in embryo size and shape are observed beyond both thermal limits in embryos of C. elegans and C. briggsae.

2) Aerobic metabolism, measured as respiration, is reduced beyond both thermal limits in C. elegans embryos.

3) In order to test whether the observed changes in size and shape beyond thermal limits result from reduced aerobic capacity (i.e. whether point 1 above results from point 2 above), we analyzed cellular features within the thermal range in embryos compromised for mitochondrial respiratory chain function. We find that both embryo size and shape are altered under these conditions, providing support for the hypothesis that such changes beyond the thermal limits in the wild-type indeed reflect reduced aerobic metabolism.

4) The respiration experiments establish that aerobic metabolism is reduced at the thermal limits. This piece of data alone is insufficient to distinguish between a scenario in which the energetic needs of the embryo are not satisfied due to insufficient aerobic metabolism and one in which these needs are actually fulfilled to some extent despite reduced respiration, perhaps because other metabolic routes are used to a larger extent. Interestingly, these two scenarios predict a different outcome in embryos compromised for mitochondrial respiratory chain function. If aerobic metabolism became insufficient beyond the thermal limits, then further compromising mitochondrial activity should have more of an impact at the thermal limits than within the thermal range. By contrast, if energetic needs could be fulfilled at the least to some extent despite reduced respiration beyond the thermal limits, then further compromising mitochondrial activity should have less of an impact at the thermal limits than within the thermal range. Importantly, we uncovered that the latter is the case, demonstrating that aerobic metabolism is restricted towards the thermal limits, as reported in Figure 4B-D. We have rewritten in an extensive manner the corresponding section in the revised manuscript to further clarify this important point (Results and Discussion section, subsection headed “Cellular hallmarks of the thermal limits are recapitulated when impairing aerobic metabolism”).

No direct respiration rate measurements were taken in RNAi-treated animals.

Following the suggestion of the reviewer, we set out to verify that respiration is decreased in embryos with compromised mitochondrial respiratory chain function. Since ATP-2 and NUO-1 are part of complex V and I, respectively, respiration might still be observed upon their depletion despite mitochondrial respiratory chain being compromised (see Braeckman et al. 2009), so that respiration measurements would not necessarily be telling in these cases Instead, respiration should be decreased upon compromising complex III function, as in cyc-1(RNAi) embryos. As anticipated, we found indeed that respiration is markedly diminished in such embryos, being on average 56% ± 13% of the wild-type embryonic respiration levels in these experimental conditions (t-test p-value < 10-3). These new results are reported in the Results and Discussion section, under “Cellular hallmarks of the thermal limits are recapitulated when impairing aerobic metabolism” (see also updated corresponding Materials and methods, subsection headed “Measurement of embryonic respiration”).

It remains unclear to what extent aerobic metabolism and embryonic lethality are causally linked in wt animals.

This point is well taken and we now explicitly state this limitation in the Results and Discussion (in the subsection headed “Cellular hallmarks of the thermal limits are recapitulated when impairing aerobic metabolism”).

Statistical analyses for the new data appear lacking and the experimental design requires more explanation.

We thank the reviewer for having spotted this omission; apologies about this. We had in fact conducted an F-test analysis (as described in Supplementary file 1 for other measurements) and have now added the corresponding p-values in the subsection “Cellular hallmarks of the thermal limits are recapitulated when impairing aerobic metabolism” (F-test p-value < 10-4 and F-test p-value < 10-10 below the lower and above the upper thermal limit, respectively).

We have also expanded the text in the Materials and methods section in order to explain better the experimental design of the respiration experiments.

The authors show that embryos at the thermal limit are less sensitive to depletion of mitochondrial activity by RNAi, than animals in the thermal range. At the upper limit of the thermal range, the data show that RNAi depletion of two mitochondrial enzymes (but curiously not a third one) has no effect on viability. There are no controls to show that the RNAi depletion works equally well at all temperatures and for all three genes, so it is possible that this odd behavior is due to incomplete depletion at different temperatures and/or for different genes.

In order to address this potential issue, we performed progeny tests at different temperatures as a proxy for depletion efficiency using RNAi against AIR-1, a serine/threonine kinase required for spindle assembly (Hannak et al. 2001), a process not known to be related to metabolic status. As we show below (see panel A), we found that air-1(RNAi) was 100% embryonic lethal at 12°C, 20°C and 24°C, as anticipated from previous work (Hannak et al. 2001). In order to titrate the phenotype, we performed double RNAi by mixing bacteria expressing dsRNA against air-1 with bacteria expressing dsRNA against gfp in a 1:3 ratio. Importantly, we found in this case that lethality was greater at 12°C and at 24°C than at 20°C (see panel B). Hence, the RNAi phenotype is actually stronger for air-1 towards the lower and the upper thermal limit than at 20°C, indicating that the results we uncovered when targeting mitochondrial respiratory chain components (Figure 4B-D of the manuscript) are not due to a general temperature-dependent response of RNAi. These results are shown in Figure 4–figure supplement 2 and reported in the Materials and methods section.

In addition, the logic used to interpret these experiments is not clear. It would seem that if respiration becomes limiting at the thermal limit, then embryos near the limit should become more sensitive, not less, to depletion of respiratory components. In this line of reasoning, the new data would suggest that, in fact, respiration is not the rate limiting step at the thermal limit.

We agree with the reviewer that aerobic metabolism is not limiting at the thermal limits (as we wrote in our very initial submission), and apologize for probably not having been sufficiently clear on this point in our last submission. As we explain in point 4 above, our data supports a mechanism whereby aerobic metabolism is restricted (and not limited) at the thermal limits. As mentioned also above, we have extensively modified the main text to make this clearer (Results and Discussion section, in the subsection headed “Cellular hallmarks of the thermal limits are recapitulated when impairing aerobic metabolism”).

In addition, reviewer 1 was still troubled by the possibility that changes in eggshell composition in embryos raised at different temperatures could cause embryos to appear larger or smaller due to different resilience to the pressure of the cover slip used for imaging. We would be grateful if you could deal with this possibility when discussing your data.

We have updated the Materials and methods to explicitly raise this possibility.

Associated Data

    This section collects any data citations, data availability statements, or supplementary materials included in this article.

    Supplementary Materials

    Figure 1—source data 1. Quantified features.

    List of features that were quantified and their thermal responses within and beyond the thermal range for C. elegans (N2). Within the thermal range, features were categorized as ‘temperature-dependent’ if the Pearson correlation p-value was below 0.0014 = 0.05/35 (see ‘Materials and methods’ for Bonferroni correction; ‘temperature-independent’ is shown underlined). Beyond the thermal limit, we performed an F-test to determine if the thermal response of the feature was changing compared to within the thermal range (see ‘Materials and methods’; we indicated a change in thermal response when the F-test p-value was below 0.0014, highlighted in bold). Abbreviations: PC: pseudo-cleavage, PM: pronuclear meeting, ME: mitotic entry, T: temperature, C/R: centration-rotation, MT: microtubules. The following features were also quantified but displayed no consistent thermal response both within and beyond the thermal range and hence were not included in the table: anterior-most position at the end of C/R, number of anterior and posterior oscillations, spindle position at the onset of oscillations.

    DOI: http://dx.doi.org/10.7554/eLife.04810.004

    elife04810s001.docx (100.9KB, docx)
    DOI: 10.7554/eLife.04810.004
    Source code 1.

    In-house scripts to analyze embryos (Matlab).

    DOI: http://dx.doi.org/10.7554/eLife.04810.012

    elife04810s002.zip (53.8KB, zip)
    DOI: 10.7554/eLife.04810.012

    Articles from eLife are provided here courtesy of eLife Sciences Publications, Ltd

    RESOURCES