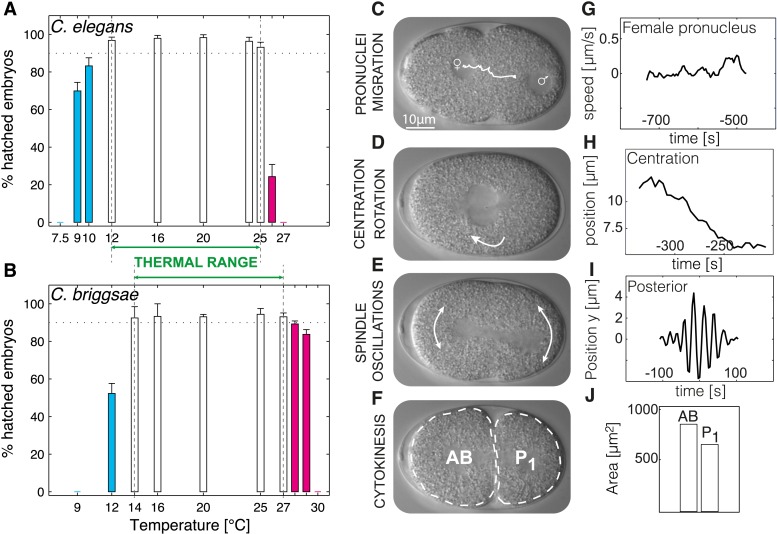
Figure 1. Defining the thermal range and quantifications.
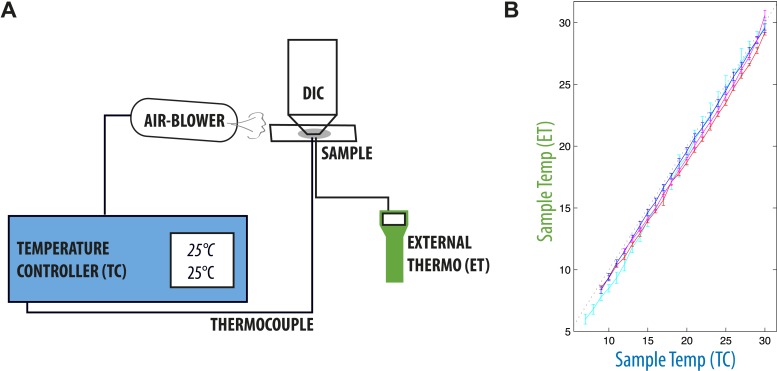
(A and B) Progeny tests were performed on acclimated C. elegans worms from 7.5°C to 27°C and C. briggsae worms from 9°C to 30°C. Dotted line highlights 90% embryonic viability. Temperatures below 20°C exhibiting less than 90% viability are shown in cyan, temperatures above 20°C exhibiting less than 90% viability in magenta. Between panels A and B, we show the thermal range of each species. Error bars show SEM. (C–F) Stills from a time-lapse temperature-controlled DIC microscopy recording of a first-cell stage embryo at the indicated stages (G–J) Examples of feature quantification at the different cellular stages (24°C): female pronucleus speed (G), pronuclei position during centration-rotation (H), spindle pole oscillations (I), as well as areas of the AB (anterior) and P1 (posterior) daughter cells (J). See ‘Materials and methods’ for details on the quantifications. Figure 1—figure supplement 1 shows the temperature control setup. Figure 1—source data 1 lists all the quantified features and their thermal response within and beyond the thermal range.
DOI: http://dx.doi.org/10.7554/eLife.04810.003


