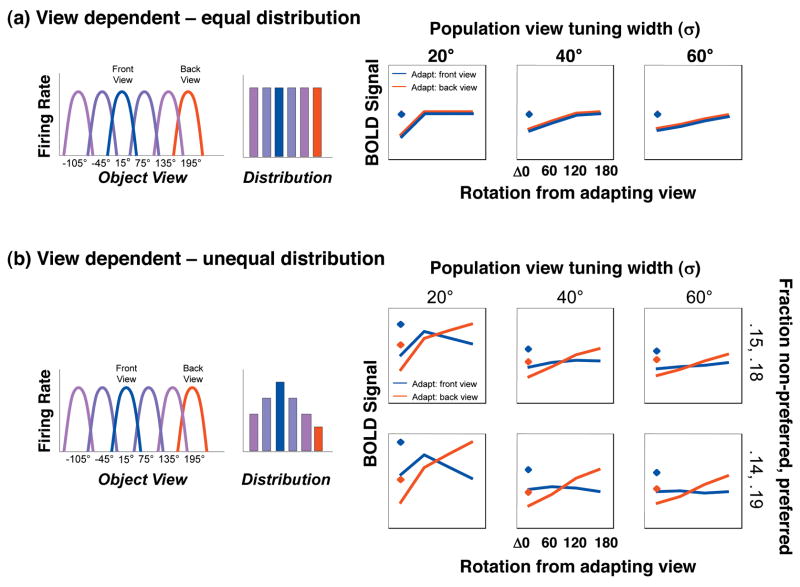
Figure 9. Mixture of View-Dependent Neural Populations Model.
Left: Schematic illustration of the view-tuning and distribution of neural populations tuned to different views in a voxel. Each bar represents the relative proportion of neurons in a voxel tuned to a view, and each is color coded by the preferred view. Right: result of computational implementation of the model illustrating predicted BOLD responses during fMRI-A experiments. Diamonds: responses without adaptation; Lines: response after adaptation with a front view (blue line) or back view (red line). Across columns the view tuning width varies, across rows the distribution of neural populations preferring specific views varies. a) Mixture of view-dependent neural populations which are equally distributed in a voxel. This model predicts a similar pattern of recovery from adaptation regardless of the adapting view. b) Mixture of view-dependent neural populations in a voxel with a higher proportion of neurons that prefer the front view. This model predicts higher BOLD responses to frontal views of animals without adaptation and a different pattern of rotation cross-adaptation during fMRI-A experiments.

