

Abstract
Aims
The aim was to develop a quantitative approach that characterizes the magnitude of and variability in phonemic generative fluency scores as measured by the Controlled Oral Word Association (COWA) test in healthy volunteers after administration of an oral and a novel intravenous (IV) formulation of topiramate (TPM).
Methods
Nonlinear mixed-effects modelling was used to describe the plasma TPM concentrations resulting from oral or IV administration. A pharmacokinetic–pharmacodynamic (PK-PD) model was developed sequentially to characterize the effect of TPM concentrations on COWA with different distributional assumptions.
Results
Topiramate was rapidly absorbed, with a median time to maximal concentration of 1 h and an oral bioavailability of ∼100%. Baseline COWA score increased by an average of 12% after the third administration on drug-free sessions. An exponential model described the decline of COWA scores, which decreased by 14.5% for each 1 mg l−1 increase in TPM concentration. The COWA scores were described equally well by both continuous normal and Poisson distributions.
Conclusions
This analysis quantified the effect of TPM exposure on generative verbal fluency as measured by COWA. Repetitive administration of COWA resulted in a better performance, possibly due to a learning effect. The model predicts a 27% reduction in the COWA score at the average observed maximal plasma concentration after a 100 mg dose of TPM. The single-dose administration of relatively low TPM doses and narrow range of resultant concentrations in our study were limitations to investigating the PK-PD relationship at higher TPM exposures. Hence, the findings may not be readily generalized to the broader patient population.
Keywords: modelling, pharmacodynamics, pharmacokinetics, topiramate, verbal fluency
What Is Already Known about this Subject
Topiramate has a selective and persistent effect on generative fluency, with a highly variable incidence (3–44%) across studies.
Several factors may contribute to the interindividual variability in cognitive effects of topiramate, including dose and rapid titration.
The relationship of cognitive impairment to drug concentration has not been thoroughly evaluated.
What This Study Adds
This study presents an exposure–response model that quantifies the effect of topiramate concentration on phonemic fluency.
We found that the Controlled Oral Word Association scores increase upon repeated administration and decline with increased topiramate exposure.
This model provides a foundation for future testing of factors that predict topiramate-induced cognitive impairment.
Introduction
Topiramate (TPM), 2,3:4,5-bis-O-(1-methylethylidene)-β-d-fructopyranose sulfamate, with indications as monotherapy for recently diagnosed partial epilepsy, add-on treatment for resistant partial-onset seizures and prophylactic treatment for migraine, is also being prescribed for a range of other conditions, including obesity, pain, bipolar disorder and alcoholism 1,2. Topiramate has been widely reported to cause adverse cognitive effects specifically related to working memory and verbal fluency in healthy volunteers and patients with epilepsy and migraine 3–5. The incidence of cognitive complaints across studies of both healthy volunteers and patients is highly variable (3–44%) 1,4–8. While this variability in response has been attributed to dose, rapid titration, polytherapy and the underlying aetiology of epilepsy, its relationship to drug exposure has not been thoroughly evaluated.
The pharmacokinetic (PK) profile of TPM after oral administration is well documented 9–15. Topiramate has many PK properties that are considered to be desirable. It is rapidly absorbed, with peak plasma levels (Cmax) observed 1–4 h after administration, mean Cmax and area under the concentration–time curve are linearly related to dose 9,10, it is only 15% bound to plasma proteins 16, and the major route of elimination is renal, with 75–80% of the dose excreted unchanged in the urine 15. Previous studies in healthy volunteers found TPM plasma concentration to have the largest impact on verbal fluency scores and working memory tests after a single TPM dose of 100 mg; however, no quantitative assessment for the exposure–response relationship was provided 2,17.
The objective of this analysis was to assess and quantify the effects of a low dose of TPM (50–100 mg) given both orally and intravenously (IV) on generative verbal fluency as measured by the Controlled Oral Word Association (COWA) test. In order to isolate the cognitive effects of TPM from those possibly arising from an underlying medical condition, subjects were healthy adults. A novel stable-labelled (SL) IV formulation of TPM developed by our group was administered, and a sequential pharmacokinetic–pharmacodynamic (PK-PD) modelling approach was used to characterize the PK and exposure–response relationship using the following strategy. Initially, a PK model was established to describe the plasma concentration–time profile of TPM and to predict plasma concentrations at the exact time when the COWA test was administered. Furthermore, the PK-PD relationship for TPM was characterized by relating the plasma concentration of TPM to the observed scores of COWA.
Methods
Subjects
The subjects were healthy volunteers recruited from two centres, namely the University of Minnesota (UMN) and the University of Florida (UF). Eligible subjects were native English speakers, 18–65 years of age, who were not taking medications known to interact with TPM or alter cognitive function. Exclusion criteria included a history of intolerance to IV administration of medication; histories of significant cardiac, neurological, psychiatric, oncological, metabolic, renal or hepatic diseases; alcohol abuse within the past 5 years; non-native speakers of English; diagnosis of a language impairment/disability; uncorrected low vision; a dominant left hand; a positive pregnancy test; and the use of any investigational drug or device in the 30 days prior to screening. Eligible subjects underwent a brief physical and neurological examination. Subjects were expected to have normal renal function because they were healthy, non-elderly adults with no reported history of renal disease.
Information about date of birth, race, ethnicity, sex, height, bodyweight and medical and surgical history was collected at the screening visit. The study protocols were approved by the UMN and UF's Institutional Review Boards, and subjects provided written consent prior to enrolment.
Study design
The PK-PD data were pooled from three randomized crossover studies. The pharmacodynamic (PD) assessment consisted of a neuropsychological battery containing tests of phonemic (COWA) and semantic fluency, as well as discourse-level verbal fluency and recall tasks. This test battery was administered to the subjects during all visits. Only the scores from the COWA were modelled. Results from the semantic fluency, discourse-level verbal fluency and recall tasks are presented in Marino et al. [2].
The first study was a four-visit, cross-over study of IV and oral TPM. Subjects were administered the COWA during the two nondrug visits (visit 1, pretreatment and visit 4, post-treatment). The study design stipulated that two subjects receive a dose of 50 mg IV TPM, followed 2 weeks later by a 50 mg oral dose. If no serious adverse events occurred, the remaining subjects (n = 10) were randomized to receive a single oral or IV dose of TPM (100 mg) on their second visit. The infusion dose was administered over 15 min. Blood samples were taken at 0, 0.083, 0.25, 0.5, 1, 2, 4, 6, 10, 12, 24, 48, 72, 96 and 120 h after dose. During visit 2, COWA was administered at 0.25, 2.5 and 6 h postdose. Following a 2 week washout period, subjects were crossed over to the alternative treatment (IV or oral TPM) on visit 3, during which the same protocol used in visit 2 was repeated.
The second study (UF) was a four-visit, double-blind, placebo-controlled trial, in which pre- and post-treatment measures of COWA were obtained during visits 1 and 4, respectively. At visits 2 and 3, subjects (n = 11) were randomized to receive a single oral dose of TPM (100 mg) or placebo. The COWA test was administered once during a time window of 2–3 h after the dose. A single blood sample was collected after administration of the COWA test. In all cases, the actual times of the blood sample and the COWA test were recorded. Visits 2 and 3 were separated by a 1 week washout period. Topiramate was measured at all visits baseline to ensure washout.
The third trial (UMN) was a three-way, double-blind, crossover study of similar design to study II, with the addition of a third treatment period that allowed the randomization of subjects (n = 9) to receive a single dose of lorazepam (LZP; 2 mg). In that study, lorazepam was chosen to investigate the mechanistic aspect of TPM effects on cognition by separating the effects of TPM from sedation. Data from the LZP arm were excluded from this analysis.
Controlled Oral Word Association test (COWA)
Phonemic generative verbal fluency was evaluated using the COWA test, which requires the subject to generate words other than proper names or nouns beginning with a specific letter of the alphabet; three 60 s trials are obtained using three different letters, F-A-S or B-H-R. In this study, the examiners alternated between these sets of letters during different visits in order to minimize the learning effects on repeated testing. The word counts generated during the three trials were summed as the COWA score. In this analysis, COWA is considered for modelling the exposure–response relationship of TPM and the effects on phonemic generative fluency, while results from other neuropsychological tests will be reported elsewhere.
Intravenous topiramate formulation
A general description of the synthesis and formulation of the SL-TPM is reported in a previous publication 18.
Determination of topiramate and SL-TPM concentrations
For quantification of both TPM and stable-labelled TPM, the liquid chromatography–mass spectrometry method with simultaneous determination of nine antiepileptic drugs was adapted from Subramanian et al. 19. Topiramate-d12 was used as the internal standard. The limit of detection was 0.5 ng ml−1, and the limit of quantification was 0.04 μg ml−1. The precision for TPM and SL-TPM ranged from 2 to 5 and from 3 to 5%, respectively. The accuracy values of TPM were between 97.6 and 102.5% and for SL-TPM between 95.2 and 106%.
Pharmacokinetic–pharmacodynamic analyses
The pharmacokinetic and pharmacodynamic parameters were estimated using nonlinear mixed-effects modelling as implemented in NONMEM (version 7; ICON Development Solutions, Ellicott City, MD, USA), compiled using Intel® Visual Fortran Compiler XE (Version 12.0.2.154 Build 20110112; Santa Clara, CA, USA). The first-order conditional estimation (FOCE) and Laplace integral approximation methods with η–ε interaction produced estimates of the structural parameters, as well as estimates of interindividual and residual unexplained variability for the PK and PK-PD models, respectively. Model selection was based on the change in NONMEM objective function value (OFV; for nested models), Akaike information criterion (AIC; for non-nested models), and the visual inspection of improvements in the diagnostic plots (observed vs. population and individual predicted concentrations and conditional weighted residuals vs. predicted concentration and time). For testing covariate models, a decrease in the OFV of at least 6.63 (χ2, P ≤ 0.01, d.f. = 1) and 10.83 (χ2, P ≤ 0.001, d.f. = 1) were used as cut-off values for forward inclusion and backward elimination, respectively.
Population pharmacokinetic model
Both one- and two-compartment PK models with first-order absorption and elimination were tested to describe the plasma concentration–time profiles of TPM and SL-TPM. The models were parameterized in terms of clearance (CL), volume of distribution (Vc), first-order absorption rate constant (Ka), oral bioavailability (F) and, for the two-compartment model, intercompartmental clearance (Q) and peripheral volume (Vp). The between-subject variability (BSV) was estimated using an exponential error model and expressed as coefficient of variation (CV). Both IV and oral TPM were modelled simultaneously. This enabled the estimation of the oral bioavailability (F) of TPM and the testing of separate residual error models for each formulation. Plots of post hoc estimates of PK parameters from the base model vs. covariates were visually inspected to evaluate the magnitude and direction of the covariate effects. A standard forward inclusion–backward elimination approach was adopted for developing the covariate model. Continuous covariates, such as age, were modellled through linear and nonlinear regression on clearance and Vc. In addition, an allometric relationship between PK parameters and actual bodyweight (ABW) was considered, where the allometric exponent for the volume of distribution was fixed to one, while that of CL was estimated from the data. The effect of categorical covariates (sex and race) was examined through a multiplicative model in order to obtain the fractional change in the pharmacokinetic parameters. Qualification of the final PK model was conducted by means of visual predictive checks (VPCs).
Pharmacokinetic–pharmacodynamic models
The PK-PD models simultaneously related the plasma concentration (Ct) of TPM to the effects on COWA for IV and oral treatments. Both discrete distribution models and continuous approximation were explored for modelling COWA. When approximating COWA as a continuous outcome, three types of link functions were investigated: linear, exponential and Emax.
Both the Poisson and negative binomial distribution models were explored for modelling COWA under the discrete distribution assumption 20. In these models, the mean outcome was linked to TPM plasma concentration, and the −2 logarithm of the likelihood option was used along with the Laplace integral approximation method in estimating the model's parameters. The development of the PK-PD models was performed on the basis of stepwise inclusion of candidate variables. Covariate models included testing for the effect of age, sex, race, number of COWA tests administered (NCOWA) and the sequence of administering treatments in the crossover design. The parameter estimates from both continuous and discrete distribution models were compared, and the final PK-PD link model was qualified using VPCs. An external validation of the model structure was also conducted using a small cohort of subjects (n = 9) at a higher single TPM dose (200 mg) than used for model development.
Results
Subject characteristics
Data from 32 individuals recruited across the three studies were pooled for this analysis. Overall, subjects received either 50 (n = 2) or 100 mg (n = 30) of oral TPM. Of the 32 subjects, 12 were crossed over to receive an infusion dose of 50 (n = 2) or 100 mg (n = 10) of SL-TPM, and 20 were crossed over to receive the placebo. Study III contributed a third treatment period, during which subjects received a 2 mg dose of lorazepam; however, data from that period were excluded from the present analysis. The characteristics of the studied population and the composition of the data set are summarized in Table 1.
Table 1.
Summary of the subject characteristics and the variables of the data set relevant for the model development across the three studies
| Study I | Study II | Study III | Total | |
|---|---|---|---|---|
| Number of subjects | 12 | 11 | 9 | 32 |
| Number of PK observations | ||||
| IV TPM | 155 | – | – | 155 |
| Oral TPM | 159 | 11 | 9 | 179 |
| Number of PD observations | ||||
| Pretreatment | 9 | 11 | 9 | 29 |
| IV TPM | 30 | – | – | 30 |
| Oral TPM | 30 | 11 | 9 | 50 |
| Placebo | – | 11 | 9 | 20 |
| Post-treatment | 8 | 11 | 8 | 27 |
| Bodyweight (kg) | 78.24 ± 16.3 | 79.06 ± 13.69 | 71.2 ± 11.74 | 76.54 ± 14.21 |
| 76.9 (58.3–112.3) | 78.76 (59.78–111.22) | 72.27 (54.73–92.27) | 77.27 (54.73–112.30) | |
| Age (years) | 35 ± 13.27 | 33.64 ± 11.07 | 21.78 ± 1.56 | 30.81 ± 11.66 |
| 31.5 (19–55) | 31 (20–50) | 22 (20–24) | 26.5 (19–55) | |
| Sex | ||||
| Men/women | 6/6 | 7/4 | 7/2 | 20/12 |
| Race | ||||
| Caucasian/AA/other/unknown | 11/1/0/0 | 7/3/0/1 | 6/1/2/0 | 24/5/2/1 |
Values are count, mean ± SD or median (range). Abbreviations are as follows: AA, African American; IV, intravenous; PD, pharmacodynamics; PK, pharmacokinetics; TPM, topiramate.
Pharmacokinetic analysis
Final PK model parameter estimates and goodness-of-fit plots are presented in Table 2 and Figure 1, respectively. The final PK model was a two-compartment linear model with first-order absorption and elimination and an exponential model for BSV of CL, Vc and Ka. Estimation of the BSV of Q and Vp resulted in a highly unstable model that was sensitive to changing initial estimates. In addition, the estimated variance of η on F was unrealistically small (%CV ∼5%); consequently, the variances of η on those parameters were fixed to zero. There was no evident correlation among the variances of η for any of the model parameters, and a diagonal OMEGA matrix was selected. A separate proportional error model best described the residual unexplained variability in TPM concentration for each formulation. During the forward inclusion, only ABW and sex showed a significant influence on the Vc (ΔOFV = 12.1 and 7.5, respectively, P < 0.01). In contrast, the inclusion of ABW on CL resulted in an insignificant drop in the OFV (ΔOFV = 2.3, P > 0.01); however, the estimate of the allometric exponent for CL was 0.41, with a 95% confidence interval (CI; −0.16, 0.99), which included the theoretical value of 0.75. Therefore, a full model that allometrically scaled CL, Q, Vc and Vp for a standard 70 kg bodyweight while accounting for a sex effect on Vc was built. Backward elimination of sex resulted in an insignificant rise in the OFV (an increase of 2.1, P > 0.05), indicating a possible collinearity between ABW and sex. Therefore, the sex effect was dropped and ABW on CL, Q, Vc and Vp was retained in the final model as follows:
| 1 |
| 2 |
| 3 |
| 4 |
Table 2.
Parameter estimates of the final pharmacokinetic model
| Parameter | Fixed effects estimate | RSE (%)* | Random effects estimate† | RSE (%)‡ | Shrinkage (%) |
|---|---|---|---|---|---|
| CL (l h−1) | 1.21 × (WT/70)0.75 | 5.72 | %CV = 19.3 | 23.6 | 38 |
| Vc (l) | 59.3 × (WT/70)1.0 | 7.03 | %CV = 24.5 | 33.8 | 12 |
| Q (l) | 1.02 × (WT/70)0.75 | 29 | |||
| Vp (l) | 12.1 × (WT/70)1.0 | 10.6 | |||
| Ka (h−1) | 2.38 | 17 | %CV = 53.3 | 36.8 | 49 |
| F (%) | 1.08 | 2 | |||
| Residual error, oral TPM | %CV = 18.4 | 21.8 | 7 | ||
| Residual error, IV TPM | %CV = 7.2 | 11.8 | 7 |
Abbreviations are as follows: CL, clearance; F, oral bioavailability of TPM; IV, intravenous; Ka, the first-order rate constant of absorption; Q, intercompartmental clearance; TPM, topiramate; Vc, central volume of distribution; Vp, peripheral volume of distribution; WT, bodyweight.
RSE, relative standard error = (standard error ÷ estimate) × 100. CV, coefficient of variation;  .
.
%RSE for random effects calculated in the variance scale.
Figure 1.

Goodness-of-fit plots from the final PK model. (A) Identity plots of observed vs. population predicted TPM concentration. (B) Identity plot of observed vs. individual predicted TPM concentration. (C) Scatter plot of conditional weighted residuals (CWRES) vs. time. (D) Scatter plot of CWRES vs. population predicted TPM concentration. •, intravenous TPM;  , oral TPM;
  , line of identity;
  , Loess, Smooth = 0.8
When testing for a race effect, groups other than Caucasians were collapsed into one category because of the small number of subjects in these groups and the difficulty of estimating a distinct parameter for each effect. Overall, age, sex, race and TPM formulation had insignificant effects on CL (ΔOFV < 6.63, P > 0.01).
Pharmacokinetic–pharmacodynamic models
When developing the structural model, the exposure–response data were fitted to linear, exponential or Emax models. For the Emax model, however, the limited range of TPM exposure in this study did not inform the model parameters, and an IC50 could not be estimated. We then fitted linear and exponential models to the exposure–response data and used an external data set to validate these models (small cohort at a single higher TPM dose, 200 mg). Despite the lower AIC value of the linear model (AIC 826) compared with the exponential decline model (AIC 829), the former resulted in slightly higher bias and comparable precision to the latter model in predicting COWA scores at the 200 mg single dose. Thus, the linear model was abandoned in favour of the more plausible exponential decline function for the model development.
| 5 |
where COWAij is the jth COWA score for the ith individual, BLi is the baseline COWA score for the ith individual with an exponential random effect, and KE is the exponential decline constant for the effect of TPM concentration. The parameter estimates and relative standard errors from the final model appear in Table 3.
Table 3.
Parameter estimates of the pharmacokinetic–pharmacodynamic models
| Parameter | Analysis of COWA as continuous data | Poisson distribution for discrete data | ||
|---|---|---|---|---|
| Estimate | RSE (%)† | Estimate | RSE (%)† | |
| BL (words per three trials) | 42.5 | 3.48 | 42.4 | 3.51 |
| KE (l mg−1) | 0.157 | 6.97 | 0.163 | 16.7 |
| θN_COWA ≥ 4 | 1.12 | 2.38 | 1.13 | 2.35 |
| %CV for IIV of BL‡ | 17 [9] | 26.2 | 17.6 [6] | 25.7 |
 (words per three trials)
|
7.1 [8] | 15.4 | ||
| AIC | 829 | 1124 | ||
Abbreviations are as follows: AIC, Akaike information criterion; BL, baseline score of COWA; COWA, Controlled Oral Word Association; KE, the exponential decline constant for the effect of topiramate concentration; θN_COWA ≥ 4, estimate of the fractional increase in BL when four or more tests of COWA are given; estimates of percentage shrinkage are indicated in the square brackets [% shrinkage];  , variance of the residual error. †RSE, relative standard error = (standard error ÷ estimate) × 100; %RSE for random effects calculated in the variance scale. ‡IIV, interindividual variability; CV, coefficient of variation;
  .
.
The distribution of the COWA scores in the data set is shown in Figure 2. The figure shows a mean observed COWA score of approximately 40 and that a normal distribution model can reasonably characterize the nature of the observed data. The model using the exponential function showed a reasonable fit through the data, as demonstrated in Figure 3. The model incorporated a BSV for the baseline COWA (BL) modelled as an exponential η; however, the limited number of subjects with serial measures of COWA after TPM dosing did not support estimating the variance of η on the decline rate constant (KE; model failed to converge). As a result, the variance of η on KE was fixed to zero.
Figure 2.
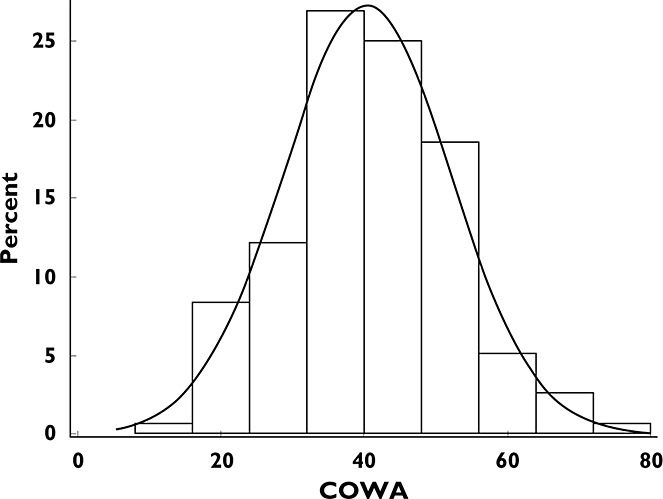
Histogram of the Controlled Oral Word Association (COWA) scores in the data set. Overlaid is a normal density
Figure 3.
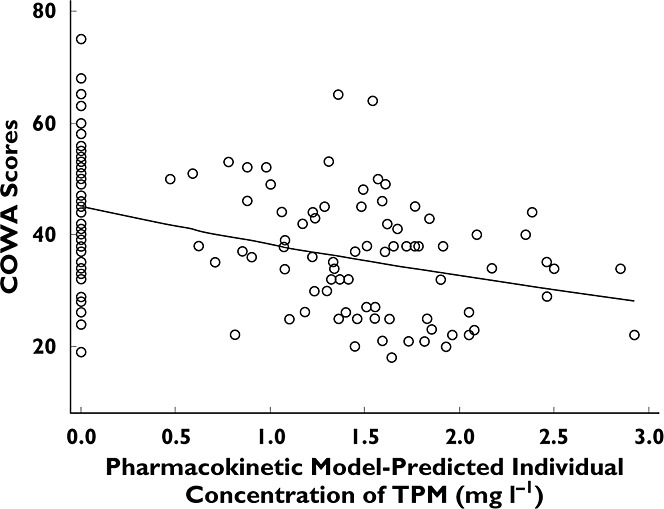
Controlled Oral Word Association vs. PK model predicted individual TPM concentration. An exponential decline function is fitted. ○, observed COWA; —, fitted COWA
When exploring the COWA scores collected under drug-free conditions (pre- and post-treatment baselines and placebo observations), a systematic increase was observed with increasing number of administered COWA test (NCOWA), as shown in Figure 4. Therefore, NCOWA was incorporated into the model as a categorical covariate, with the pretreatment COWA score set as a reference group, and fractional changes due to NCOWA were estimated. The 95% CI for estimates of the effect of any NCOWA < 4 on BL crossed the null value of one, while those for any NCOWA ≥ 4 departed significantly from one. Therefore, a fixed effect for NCOWA ≥ 4 was estimated and significantly decreased the OFV (ΔOFV = 16.1, P < 0.0001). Age, sex, race, and sequence of treatments had no significant effect on either the baseline or the decline rate of COWA. A backward elimination was not performed because there was only one covariate effect per parameter included in the model.
Figure 4.
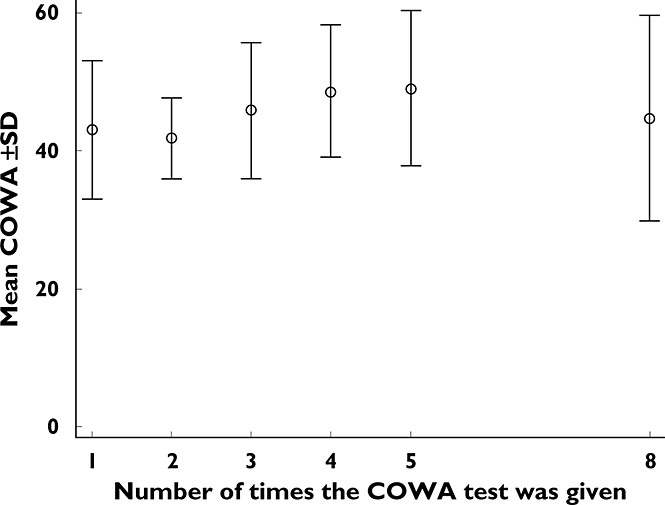
Mean scores of COWA ± SD vs. the number of times that the COWA test was administered
Despite the potential advantage of the negative binomial model in accounting for the overdispersion above the mean COWA scores, the Poisson distribution was assumed in the model development because the Poisson model accommodated the overdispersion above the mean once the NCOWA (NCOWA < 4 vs. NCOWA ≥ 4) was incorporated into the model (overdispersion 0.0071). It is worth mentioning that both the discrete and the continuous data distribution models produced similar parameter estimates and were of comparable predictability for the observed COWA, as shown in Table 4 and Figure 5, respectively. In addition, the continuous data distribution model fit had a considerably lower AIC than the Poisson model. Consequently, the traditional analysis for continuous data was sufficient for the COWA. The final model linked the decline in COWA to Ct through an exponential function and accounted for the effect of repeated tests of COWA (NCOWA ≥ 4) on BL as follows:
| 6 |
where NCOWA ≥ 4 equals zero if COWA is being repeated for fewer than four times or one otherwise and εij is the independent normally distributed residual error with a mean of zero and variance  .
.
Table 4.
Absolute predictive performance in predicting COWA scores after a single 200 mg topiramate dose using the linear relative to the exponential models
| Linear model | Exponential model | |
|---|---|---|
| Absolute predictive performance | ||
| MPE (95% CI) | 4.32 (−4.92, 11.76) | 3.45 (−3.51, 12.27) |
| MAPE (95% CI) | 8.94 (4.92, 13.04) | 9.13 (3.91, 13.2) |
Twenty-seven observations were made in nine subjects. Abbreviations are as follows: CI, confidence interval; COWA, Controlled Oral Word Association; MAPE, median absolute prediction error (indicates the precision of the model in predicting the COWA scores as words per three trials); MPE, median predictor error (indicates the bias of the model in predicting COWA scores as words per three trials).
Figure 5.
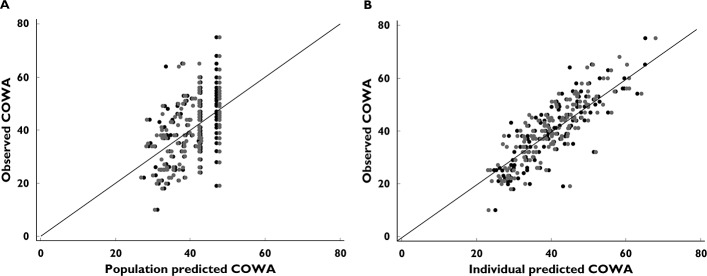
Goodness-of-fit plots from both analyses of continuous and discrete (Poisson) models. (A) Identity plot of observed vs. population predicted COWA. (B) Identity plot of observed vs. individual predicted COWA. • model for continuous data;  , poisson distribution model;
  , line of identity
Visual predictive check
The results of the predictive checks for the PK model of both IV stable-labelled and oral TPM are shown in Figure 6. The predictive check plot for the PD link model is shown in Figure 7. Visual inspection of these plots indicates that the final models were adequate in simulating both the overall trend and the variability encountered in the PK-PD data set.
Figure 6.
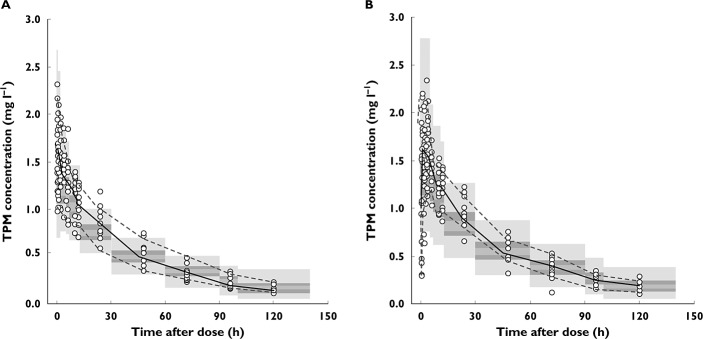
Visual predictive check plots of observed stable-labelled intravenous (A) and oral (B) TPM concentrations. Overlaid in grey bands are the 95% confidence intervals of the 50th (median), 5th and 95th quantiles of the simulated data sets from the PK model.  , observed median;
  , observed 5th, 95th percentiles
Figure 7.
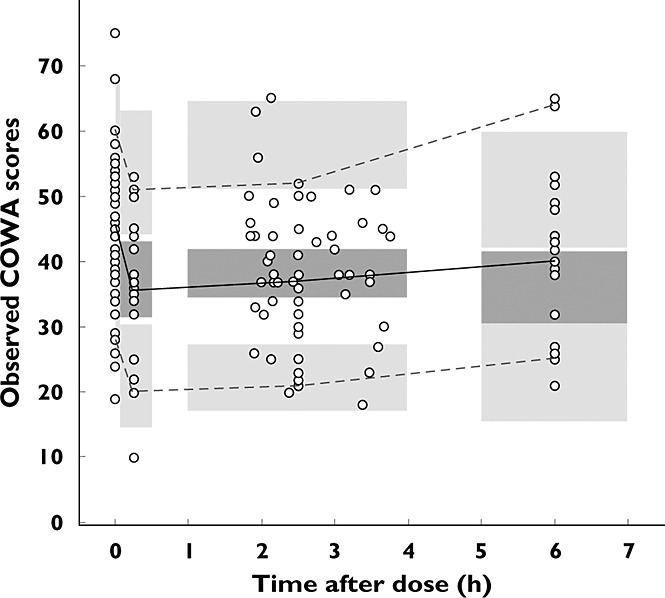
Visual predictive check plot of observed COWA; the overlaid grey bands are the 95% confidence intervals of the 50th (median), 5th and 95th quantiles of 1000 simulated datasets from the final PK-PD link model.  , observed median;
  , observed 5th, 95th percentiles
Discussion
To the best of our knowledge, this is the first study to quantify the change in generative phonemic fluency with respect to changing TPM concentration. We identified such changes to occur at a relatively low dose of TPM and within a narrow range of observed TPM levels (0.05–3 mg l−1). In addition, the study design allowed the examination of the practice effect of COWA. A significant improvement of the performance on COWA was demonstrated after the third time the test was administered during the nondrug sessions. The decline in COWA scores was adequately described by an exponential model. The rate constant of 0.157 l mg−1 indicated that the COWA score decreased by 14.5% for each 1 mg l−1 increase in TPM concentration.
The PK of TPM was described by a two-compartment model with first-order absorption and elimination processes. After oral dosing, TPM was found to be absorbed rapidly (half-time for absorption ∼15 min), with no significant lag time. While the maximal bioavailability is theoretically 100%, we chose not to use a logit model to impose this restriction and opted to allow the data to speak to the issue. Nonetheless, the estimate of 108% bioavailability of the tablets relative to the IV preparation is a relatively small deviation from the theoretical value of 100% and suggests that TPM is well absorbed after oral administration of tablets. The distribution of TPM was calculated to be relatively slow as demonstrated by a distribution half- life (t1/2α) of 6.5 h in this population. Previous studies in adults suggest that TPM PK following oral administration is described by a one-compartment model; however, these studies were mostly based on the analysis of sparse PK data 13,15. Given the rapid absorption of TPM and the immediate effect on COWA scores observed in our study, it is possible that TPM undergoes a faster equilibration with the site of action than predicted by the calculated t1/2α. Our study design included a total duration of infusion and time to first PK sample of ∼20 min; thus, this rapid distribution phase could have been completed before our first PK sample was obtained. Topiramate CL of a typical individual (70 kg) was estimated at 1.22 l h−1, which is consistent with the estimates of previous studies on healthy volunteers and patients with epilepsy 15,21,22. Age, sex and race had no effect on the CL of TPM in healthy volunteers, although a previous study found TPM CL to increase with a patient's age 15. The subjects in our study were healthy, young adults, who reportedly had normal renal function. In addition, of the 32 individuals, only 12 had rich PK sampling to inform estimation of CL and testing of covariate effect. This may explain the lack of effect of age and other covariates on CL.
Of particular interest is the significant increase in COWA scores after the third time that the test was administered during nondrug sessions. On average, subjects generated 12% more words after the third test compared with previous test sessions. A practice effect and reduced anxiety of the examinees on repeated testing could have contributed to this phenomenon. Despite this increase in the nondrug sessions, TPM still decreased the performance on the COWA test, and the mean score of COWA per three trials declined exponentially with increasing TPM concentration. At the average peak concentration (Cmax 2 mg l−1) observed after a TPM dose of 100 mg, the model predicts a 27% reduction in the number of words generated on COWA (∼31 words per three trials). The effect on generative phonemic fluency as measured by COWA is expected to be due mainly to exposure to TPM, because the study population included only healthy volunteers with no complications of seizures, drug interactions or varying aetiology of epilepsy.
Our findings are in keeping with previous reports of the cognitive effects of TPM in healthy volunteers. At baseline, individuals generated an average of 43 words per three trials, which fell within the normal range for the COWA scores adjusted for age, sex and education 23. Studies on healthy volunteers of comparable age to those in our study found mean and median baseline COWA scores of 45 and 43 words generated per three trials, respectively 3,24. In addition, these studies reported averages of reduction in the COWA scores of 36 and 42% after daily doses of 300 and 400 mg maintained for a mean of 3 weeks, respectively 3,24. Short-term exposure to higher doses of TPM may thus worsen performance on COWA, in comparison to our study. On the contrary, varying degrees of tolerance or compensatory response to the cognitive adverse events may occur with prolonged therapy and result in milder cognitive side-effects than were observed on acute exposure 25,26. Lee et al. found a significant but mild decline only in verbal fluency and tests of attention (14 and 15%, respectively) after 1 year of exposure to a low dose of TPM (50–100 mg day−1) in patients with newly diagnosed epilepsy, well controlled for seizures and with no EEG abnormalities 4. Other cognitive tests administered in this study were not significantly influenced by TPM at the end of the 1 year follow-up.
The present study identified an exposure–response relationship of TPM and COWA scores at a narrow range of TPM concentrations (0.05–3 mg l−1) in healthy volunteers. A direct translation of this relationship to epilepsy patients is ambiguous; however, we suppose that this exposure–response profile would apply to patients with migraine or obesity 27. Migraine patients were found to have similar baseline cognitive performance to healthy control subjects, with a selective and persistent effect of TPM (50–100 mg) on verbal fluency scores after both the titration phase and 8 weeks of maintenance therapy 5. In contrast, conflicting results were reported for the cognitive effects of TPM in epilepsy patients. The study by Lee et al. revealed a significant interaction between TPM daily dose and the difference in scores of the backward digit span (P < 0.01) and verbal fluency tests (P < 0.05) before and after initiation of TPM 4. On the contrary, a previous study of patients with intractable epilepsy who underwent withdrawal of TPM (50–650 mg day−1) in preoperative settings found neither the dose nor the serum levels of TPM to be predictive of the cognitive side-effects 28. However, for those patients, differences in the aetiology of epilepsy and brain pathology, polytherapy and the variable length of maintenance time on TPM could have confounded the relationship between TPM concentration and effect on cognition.
It is worth mentioning that the narrow ranges of administered doses and concentrations in our study were limitations to investigating the PK-PD relationship at higher exposures to TPM. It is possible that the COWA–CTPM relationship asymptotes to a maximal effect at higher doses of TPM, with increased exposures producing less than a proportional decrease in cognitive function. As we studied the cognitive effects of TPM in healthy volunteers with no underlying diseases or confounding factors, the findings from the present study may not be generalized readily to the broader patient population. In addition, the single assessment of subjects after receiving placebo has limited the characterization of a continuous time–COWA relationship. Further studies are needed to characterize the cognitive effects of TPM at higher doses and the relative contribution of placebo and learning of neuropsychological tests to the proposed TPM effect.
In conclusion, we have characterized the exposure–response relationship of TPM concentration and its effects on phonemic fluency in healthy volunteers given single, low doses of TPM (50–100 mg). The improved performance on COWA after the third administration in drug-free conditions is probably due to a significant practice effect; COWA scores decline exponentially with increasing TPM concentrations, and the model predicted a rate constant of 0.157 l mg−1, indicating that COWA scores decreased by 14.5% for each 1 mg l−1 increase in TPM concentration.
Further studies are needed to characterize both the PK-PD and the time–response relationship in epilepsy patients or other patient populations at a higher and wider range of doses than was used in our study. These models can be useful in predicting subpopulations of patients who would be more susceptible to impairment of COWA, while providing a PK-PD evidence-based dose optimization of TPM in such patient populations.
Competing interests
All authors have completed the Unified Competing Interest form at http://www.icmje.org/coi_disclosure.pdf (available on request from the corresponding author) and declare: JCC had support from the Epilepsy Foundation New Therapy Grants Program as well as a grant and nonfinancial support from Ligand Pharmaceuticals for the IV TPM study in healthy volunteers; JCC and SEM receive royalty payments as part of a licensing agreement between Ligand Pharmaceuticals and the University of Minnesota; SEM, AKB, SVSP and IEL had support from the National Institutes of Health and the University of Minnesota during the conduct of the study.
This study was funded in part by NIH/NINDS R01 NS076665, K01 NS050309, and a grant from the Academic Health Center at the University of Minnesota.
References
- Arroyo S, Dodson WE, Privitera MD, Glauser TA, Naritoku DK, Dlugos DJ, Wang S, Schwabe SK, Twyman RE, Invest EI. Randomized dose-controlled study of topiramate as first-line therapy in epilepsy. Acta Neurol Scand. 2005;112:214–222. doi: 10.1111/j.1600-0404.2005.00485.x. [DOI] [PubMed] [Google Scholar]
- Marino SE, Pakhomov SV, Han S, Anderson KL, Ding M, Eberly LE, Loring DW, Hawkins-Taylor C, Rarick JO, Leppik IE, Cibula JE, Birnbaum AK. The effect of topiramate plasma concentration on linguistic behavior, verbal recall and working memory. Epilepsy Behav. 2012;24:365–372. doi: 10.1016/j.yebeh.2012.04.120. [DOI] [PMC free article] [PubMed] [Google Scholar]
- Meador KJ, Loring DW, Vahle VJ, Ray PG, Werz MA, Fessler AJ, Ogrocki P, Schoenberg MR, Miller JM, Kustra RP. Cognitive and behavioral effects of lamotrigine and topiramate in healthy volunteers. Neurology. 2005;64:2108–2114. doi: 10.1212/01.WNL.0000165994.46777.BE. [DOI] [PubMed] [Google Scholar]
- Lee HW, Jung DK, Suh CK, Kwon SH, Park SP. Cognitive effects of low-dose topiramate monotherapy in epilepsy patients: a 1-year follow-up. Epilepsy Behav. 2006;8:736–741. doi: 10.1016/j.yebeh.2006.03.006. [DOI] [PubMed] [Google Scholar]
- Romigi A, Cervellino A, Marciani MG, Izzi F, Massoud R, Corona M, Torelli F, Zannino S, Uasone E, Placidi F. Cognitive and psychiatric effects of topiramate monotherapy in migraine treatment: an open study. Eur J Neurol. 2008;15:190–195. doi: 10.1111/j.1468-1331.2007.02033.x. [DOI] [PubMed] [Google Scholar]
- Gilliam FG, Veloso F, Bomhof MAM, Gazda SK, Biton V, Ter Bruggen JP, Neto W, Bailey C, Pledger G, Wu SC. A dose-comparison trial of topiramate as monotherapy in recently diagnosed partial epilepsy. Neurology. 2003;60:196–202. doi: 10.1212/01.wnl.0000048200.12663.bc. [DOI] [PubMed] [Google Scholar]
- Privitera MD, Brodie MJ, Mattson RH, Chadwick DW, Neto W, Wang S. Topiramate, carbamazepine and valproate monotherapy: double-blind comparison in newly diagnosed epilepsy. Acta Neurol Scand. 2003;107:165–175. doi: 10.1034/j.1600-0404.2003.00093.x. [DOI] [PubMed] [Google Scholar]
- Schauble B, Wang S, Wiegand F. Randomized dose-controlled multicenter study of topiramate as first line therapy in adolescents with epilepsy – a post-hoc analysis (EPMN-106/INT-28) Eur J Neurol. 2007;14:210. [Google Scholar]
- Girgis IG, Nandy P, Nye JS, Ford L, Mohanty S, Wang S, Ochalski S, Eerdekens M, Cox E. Pharmacokinetic-pharmacodynamic assessment of topiramate dosing regimens for children with epilepsy 2 to <10 years of age. Epilepsia. 2010;51:1954–1962. doi: 10.1111/j.1528-1167.2010.02598.x. [DOI] [PubMed] [Google Scholar]
- Schneiderman JH. Topiramate: pharmacokinetics and pharmacodynamics. Can J Neurol Sci. 1998;25:S3–S5. doi: 10.1017/s031716710003482x. [DOI] [PubMed] [Google Scholar]
- Bourgeois BF. Pharmacokinetics and pharmacodynamics of topiramate. J Child Neurol. 2000;15(Suppl. 1):S27–S30. doi: 10.1177/0883073800015001S06. [DOI] [PubMed] [Google Scholar]
- Ohman I, Sabers A, de Flon P, Luef G, Tomson T. Pharmacokinetics of topiramate during pregnancy. Epilepsy Res. 2009;87:124–129. doi: 10.1016/j.eplepsyres.2009.08.004. [DOI] [PubMed] [Google Scholar]
- Bouillon-Pichault M, Nabbout R, Chhun S, Rey E, Chiron C, Dulac O, Pons G, Jullien V. Topiramate pharmacokinetics in infants and young children: contribution of population analysis. Epilepsy Res. 2011;93:208–211. doi: 10.1016/j.eplepsyres.2010.12.004. [DOI] [PubMed] [Google Scholar]
- Battino D, Croci D, Rossini A, Messina S, Mamoli D, Perucca E. Topiramate pharmacokinetics in children and adults with epilepsy: a case-matched comparison based on therapeutic drug monitoring data. Clin Pharmacokinet. 2005;44:407–416. doi: 10.2165/00003088-200544040-00005. [DOI] [PubMed] [Google Scholar]
- Vovk T, Jakovljević MB, Kos MK, Janković SM, Mrhar A, Grabnar I. A nonlinear mixed effects modelling analysis of topiramate pharmacokinetics in patients with epilepsy. Biol Pharm Bull. 2010;33:1176–1182. doi: 10.1248/bpb.33.1176. [DOI] [PubMed] [Google Scholar]
- Garnett WR. Clinical pharmacology of topiramate: a review. Epilepsia. 2000;41(Suppl. 1):S61–65. doi: 10.1111/j.1528-1157.2000.tb02174.x. [DOI] [PubMed] [Google Scholar]
- Cirulli ET, Urban TJ, Marino SE, Linney KN, Birnbaum AK, Depondt C, Attix DK, Radtke RA, Goldstein DB. Genetic and environmental correlates of topiramate-induced cognitive impairment. Epilepsia. 2012;53:e5–e8. doi: 10.1111/j.1528-1167.2011.03322.x. [DOI] [PMC free article] [PubMed] [Google Scholar]
- Clark AM. Development of Intravenous Topiramate for Neuroprotection and Seizure Control in Neonates. Minneapolis, MN: University of Minnesota; 2011. [Google Scholar]
- Subramanian M, Birnbaum AK, Remmel RP. High-speed simultaneous determination of nine antiepileptic drugs using liquid chromatography-mass spectrometry. Ther Drug Monit. 2008;30:347–356. doi: 10.1097/FTD.0b013e3181678ecb. [DOI] [PubMed] [Google Scholar]
- Troconiz IF, Plan EL, Miller R, Karlsson MO. Modelling overdispersion and Markovian features in count data. J Pharmacokinet Pharmacodyn. 2009;36:461–477. doi: 10.1007/s10928-009-9131-y. [DOI] [PubMed] [Google Scholar]
- Britzi M, Perucca E, Soback S, Levy RH, Fattore C, Crema F, Gatti G, Doose DR, Maryanoff BE, Bialer M. Pharmacokinetic and metabolic investigation of topiramate disposition in healthy subjects in the absence and in the presence of enzyme induction by carbamazepine. Epilepsia. 2005;46:378–384. doi: 10.1111/j.0013-9580.2005.55204.x. [DOI] [PubMed] [Google Scholar]
- Shank RP, Doose DR, Streeter AJ, Bialer M. Plasma and whole blood pharmacokinetics of topiramate: the role of carbonic anhydrase. Epilepsy Res. 2005;63:103–112. doi: 10.1016/j.eplepsyres.2005.01.001. [DOI] [PubMed] [Google Scholar]
- Lezak MD, Howieson DB, Loring DW. Neuropsychological Assessment. New York: Oxford University Press, Inc; 2004. Verbal functions and language skills; pp. 501–530. 4th ed. [Google Scholar]
- Salinsky MC, Storzbach D, Spencer DC, Oken BS, Landry T, Dodrill CB. Effects of topiramate and gabapentin on cognitive abilities in healthy volunteers. Neurology. 2005;64:792–798. doi: 10.1212/01.WNL.0000152877.08088.87. [DOI] [PubMed] [Google Scholar]
- Aldenkamp AP, Baker G, Mulder OG, Chadwick D, Cooper P, Doelman J, Duncan R, Gassmann-Mayer C, de Haan GJ, Hughson C, Hulsman J, Overweg J, Pledger G, Rentmeester TW, Riaz H, Wroe S. A multicenter, randomized clinical study to evaluate the effect on cognitive function of topiramate compared with valproate as add-on therapy to carbamazepine in patients with partial-onset seizures. Epilepsia. 2000;41:1167–1178. doi: 10.1111/j.1528-1157.2000.tb00322.x. [DOI] [PubMed] [Google Scholar]
- Meador KJ, Loring DW, Hulihan JF, Kamin M, Karim R. Differential cognitive and behavioral effects of topiramate and valproate. Neurology. 2003;60:1483–1488. doi: 10.1212/01.wnl.0000063308.22506.19. [DOI] [PubMed] [Google Scholar]
- Loring DW, Williamson DJ, Meador KJ, Wiegand F, Hulihan J. Topiramate dose effects on cognition: a randomized double-blind study. Neurology. 2011;76:131–137. doi: 10.1212/WNL.0b013e318206ca02. [DOI] [PMC free article] [PubMed] [Google Scholar]
- Kockelmann E, Elger CE, Helmstaedter C. Significant improvement in frontal lobe associated neuropsychological functions after withdrawal of topiramate in epilepsy patients. Epilepsy Res. 2003;54:171–178. doi: 10.1016/s0920-1211(03)00078-0. [DOI] [PubMed] [Google Scholar]