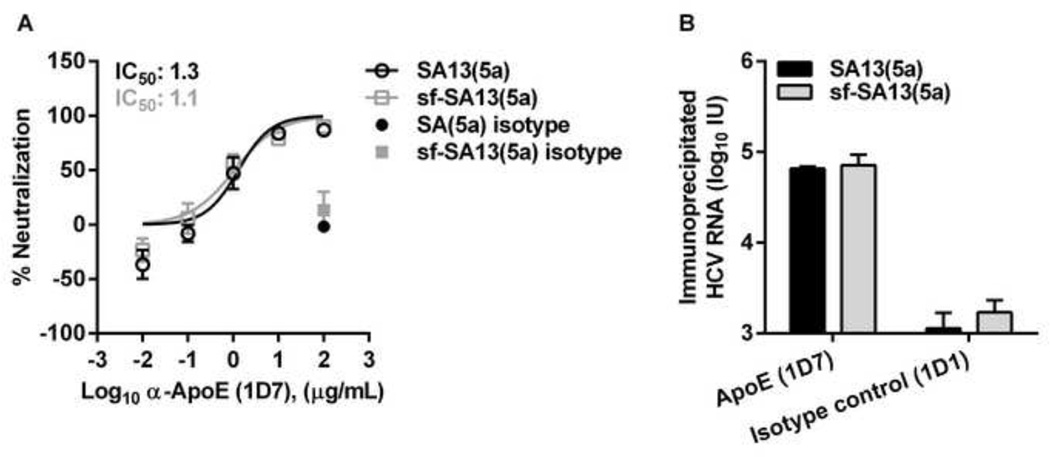
Figure 6. HCVcc and sf-HCVcc showed similar association with ApoE.
(A) Monoclonal α-ApoE antibody (1D7) and control mouse IgG1κ (1D1) were diluted in DMEM + 10% FBS to the indicated concentrations. SA13(5a) (black bars) and sf-SA13(5a) (grey bars) were diluted in DMEM + 10% FBS and incubated with dilutions of α-ApoE or mouse IgG1κ for 30 minutes at 37°C. The virus-antibody mixes were added to Huh7.5 cells, plated the previous day in poly-D-lysine coated 96 well plates. After 3 hours of incubation, virus-antibody mixes were removed and DMEM + 10% FBS was added. Cells were fixed 48 hours post infection and stained, and the number of single HCV NS5A positive cells per well was determined by automated counting as described in Materials and Methods. The % neutralization was calculated by relating counts of experimental wells to the mean count of six replicate wells with untreated control virus. Data points are means of three replicates with SEM (error bars). Following logarithmic transformation of X-values, variable-slope sigmoidal dose-response curves were fitted [Y = Bottom+(Top-Bottom)/(1 + 10(Log10EC50-X)×HillSlope)]. “Bottom” was constrained to “0” for all curves. “Top” was constrained to “100”. (B) Immunoprecipitation was carried out on 106 IU HCV RNA of SA13(5a) and sf-SA13(5a), using monoclonal α-ApoE (1D7) and control mouse IgG1κ (1D1) as described in Materials and Methods. Amounts of HCV RNA (IU) were determined in the immunoprecipitated fractions using TaqMan PCR as described in Materials and Methods. RNA titers are shown as the mean of two replicates with SEM.

