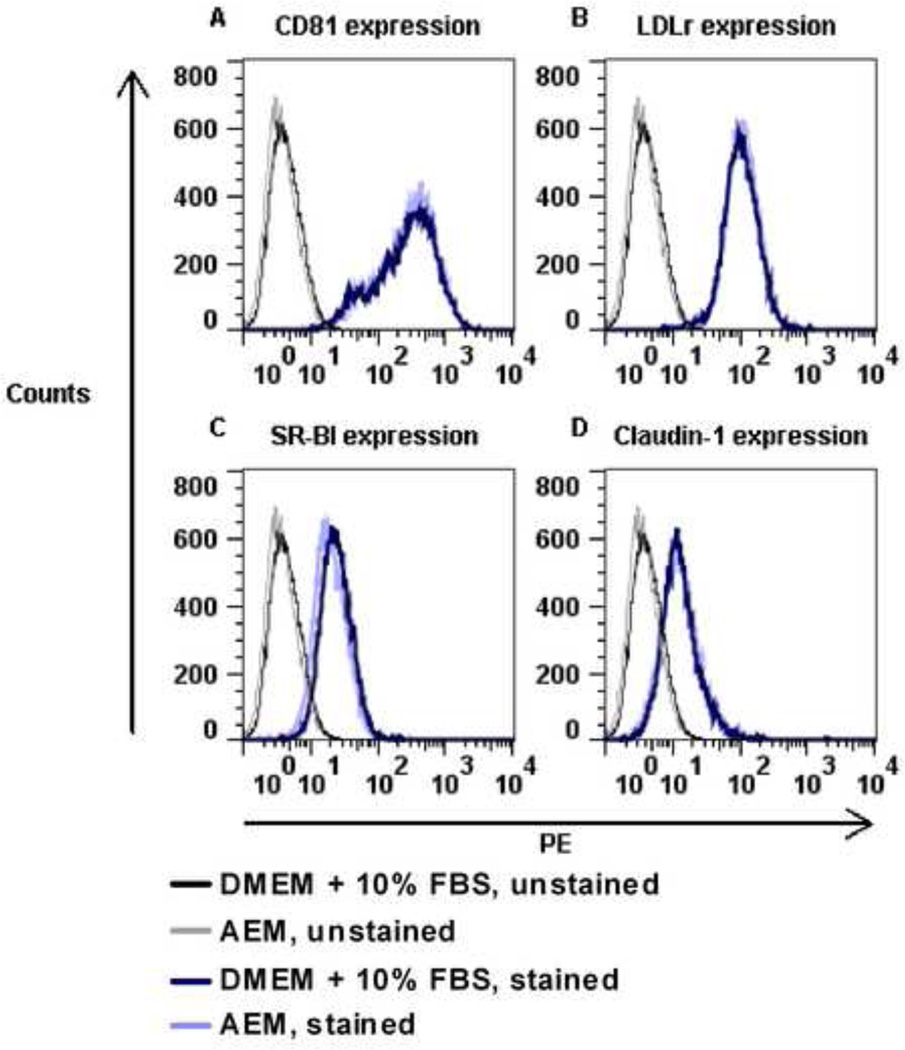
Figure 8. Huh7.5 cells cultured in DMEM + 10% FBS or AEM showed similar surface expression of HCV co-receptors.
Huh7.5 cells were incubated for 3 hours in DMEM + 10% FBS or AEM and subsequently prepared for flow cytometry analysis as described in Materials and Methods. Cell surface expression of HCV co-receptors was determined using antibodies against (A) CD81, (B) LDL-r, (C) SR-BI and (D) claudin-1 as described in Materials and Methods. PE signals were recorded on a BD FACSCalibur flow cytometer. Histograms show the co-receptor surface expression in cells cultured in DMEM + 10% FBS (dark blue) or AEM (light blue) compared to unstained cells (black and grey, respectively).

