Abstract
Given the repeated failure of amyloid-based approaches in Alzheimer’s disease, there is increasing interest in tau-based therapeutics. Although methylthioninium (MT) treatment was found to be beneficial in tau transgenic models, the brain concentrations required to inhibit tau aggregation in vivo are unknown. The comparative efficacy of methylthioninium chloride (MTC) and leucomethylthioninium salts (LMTX; 5–75 mg/kg; oral administration for 3–8 weeks) was assessed in two novel transgenic tau mouse lines. Behavioural (spatial water maze, RotaRod motor performance) and histopathological (tau load per brain region) proxies were applied. Both MTC and LMTX dose-dependently rescued the learning impairment and restored behavioural flexibility in a spatial problem-solving water maze task in Line 1 (minimum effective dose: 35 mg MT/kg for MTC, 9 mg MT/kg for LMTX) and corrected motor learning in Line 66 (effective doses: 4 mg MT/kg). Simultaneously, both drugs reduced the number of tau-reactive neurons, particularly in the hippocampus and entorhinal cortex in Line 1 and in a more widespread manner in Line 66. MT levels in the brain followed a sigmoidal concentration–response relationship over a 10-fold range (0.13–1.38 μmol/l). These data establish that diaminophenothiazine compounds, like MT, can reverse both spatial and motor learning deficits and reduce the underlying tau pathology, and therefore offer the potential for treatment of tauopathies.
Keywords: animal models, learning and memory, leucomethylthioninium, methylene blue, rat, RotaRod, tauopathies, water maze
Introduction
Alzheimer’s disease (AD) is an irreversible, neurodegenerative disorder characterized by progressive loss of memory and thinking skills. ‘Neurofibrillary tangles’ in the brain of a 55-year-old patient were presented by Alois Alzheimer as the pathological hallmark underlying dementia (Alzheimer, 1907). The neurofibrillary tangle is made of pathological filaments composed predominantly of a truncated 100-amino acid fragment of the microtubule-associated protein tau (Wischik et al., 1988; Novak et al., 1993). This truncated fragment can catalyse the conversion of normal soluble tau into an aggregated oligomer (Wischik et al., 1996), which, in turn, can spread to neighbouring neurons (Clavaguera et al., 2009; Frost et al., 2009; Walker et al., 2013). Tau aggregation in the brain is directly linked to clinical dementia (Mukaetova-Ladinska et al., 2000). The pattern of spread of the tau aggregation pathology in the human brain is highly stereotyped and forms the basis of the six-stage Braak staging system for neurofibrillary degeneration in AD (Braak and Braak, 1991). Contrary to the common belief that the neurofibrillary pathology is a late-stage process in AD, analysis of a large postmortem series showed that Braak stage 1 begins in the fourth and fifth decades of life and takes around 20–30 years to progress to stage 4, which is associated with clinical dementia (Ohm et al., 1995; Duyckaerts, 2011).
Recently, we reported two novel mouse models overexpressing different human tau protein constructs (Melis et al., 2015). One is a full-length tau protein construct carrying a double mutation [P301S/G335D; Line 66 (L66)] and the second is a truncated tau protein construct corresponding to the paired helical filament (PHF) core-tau fragment of the PHF in AD, corresponding to residues 296–390, linked to a signal sequence targeting it to the endoplasmic reticulum [Line 1 (L1)]. Like other transgenic models based on mutant full-length tau, L66 has abundant tau pathology widely distributed throughout the brain, with particularly high counts of affected neurons in the hippocampus and entorhinal cortex. The pathology is neuroanatomically static from the age of 3 months onwards and declines with age. Behaviourally, the model is devoid of a higher cognitive phenotype but presents with sensorimotor and motor learning deficits. L1 shows a much weaker histopathological phenotype, but shows evidence of neuroanatomical spread and amplification with age that resembles the Braak staging of AD. Behaviourally, the model has minimal motor impairment but shows spatial learning and memory deficits that affect particularly the rodent equivalent of episodic memory, which begins at 3 months and progresses with age. We have used these models to demonstrate the existence of two distinct, but nevertheless convergent, pathways of tau molecular pathogenesis.
Methylthioninium (MT) belongs to a class of diaminophenothiazines identified as pharmaceutically viable compounds selectively inhibiting tau–tau aggregation in vitro, without affecting the normal tau–tubulin interaction (Wischik et al., 1996). MT is able to disrupt the core structure of the PHFs isolated from AD brain tissues at a concentration of 0.16 μmol/l and has a Ki value of 0.12 μmol/l for prevention of tau aggregation in a cell model (Harrington et al., 2015). MT is a redox molecule; depending on the local environment (pH, oxygen, reducing agents, etc.), it exists in equilibrium between a reduced leucomethylthioninium form (LMT) and an oxidized form (MT+). As a chloride salt (commonly known as ‘methylene blue’), methylthioninium chloride (MTC) is stabilized in its oxidized form (MT+). The use of MTC as a means of delivering MT clinically is limited by poor tolerability, dose-dependent food interference with absorption and high first-pass metabolism converting MT to a labile inactive conjugate (Baddeley et al., 2015). The pharmacological limitations of MTC are due in part to the complexity of MT absorption when dosed as MT+, which requires thiazine dye reductase activity to convert MT+ to LMT to permit passive absorption across the cell membrane (May et al., 2004). We have synthesized a novel chemical entity in which LMT can be manufactured in a stable anhydrous salt form, LMTX, which has superior pharmacological properties (Baddeley et al., 2015) while retaining activity as a tau aggregation inhibitor (Harrington et al., 2015). In pharmacokinetic studies, MT dosed intravenously as LMTX showed 11-fold higher uptake into red cells and MT dosed orally in mice showed three-fold greater uptake in the brain in the dosing range of 2–20 mg MT/day (Baddeley et al., 2015). In the present study, we have sought to compare the activity of MT dosed as either MTC or LMTX in the two transgenic mouse models of tau aggregation.
Methods
Transgenic mice
Transgenic mice have been described recently (Melis et al., 2015). L1 mice express truncated tau296–390 fused with an N-terminal endoplasmic reticulum-directing signal sequence. L66 mice express full-length htau40 (1–441 amino acids) carrying two mutations (P301S and G335D). The numbering refers to the largest brain tau isoform (Goedert et al., 1992). Female, Naval Medical Research Institute (NMRI)-derived homozygous L1 mice (age 5 months) and heterozygous L66 mice (age 8–9 months) were tested together with nontransgenic wild-type (WT) control mice in behavioural tests and by pathological analysis. Selection of age and sex for cohorts was based on our phenotypic characterization of the two transgenic lines (Melis et al., 2015). Mice were bred commercially (Harlan, Hillcrest UK) and delivered to the experimental holding areas of the investigating institution 2–4 weeks before testing. They were group housed throughout in colony cages, with tubes and paper strips as enrichment, and maintained on a complete commercial diet with free access to water and food under standard conditions (temperature: 20°C±1°C; relative humidity: 60−65%; air changes: 17–20 changes per hour) on a 12-h light/dark cycle (light on at 07:00 h). Testing took place during the light phase of the cycle.
Experiments were carried out in accordance with the European Communities Council Directive (63/2010/EU) with local ethical approval, a project license under the UK Scientific Procedures Act (1986), and in accordance with the German Law for Animal Protection (Tierschutzgesetz).
Drugs, treatment cohorts and tissue harvest
Animals were assigned to one of the different treatment groups according to genotype, and compound or vehicle were administered orally by gavage. Animals were treated with MTC [3,7-bis(dimethylamino)phenothiazin-5-ylium chloride] or LMTX, either as the dihydrobromide [N,N,N’,N’-tetramethyl-10H-phenothiazine-3,7-diamine bis(hydrogen bromide)] or as the dihydromethane sulphonate [N,N,N’,N’-tetramethyl-10H-phenothiazine-3,7-diaminium bis(methanesulphonate)] salt form, as indicated (Fig. 1). Once administered within the body, the active moiety exists as a free base in redox equilibrium between MT+ and LMT (Schirmer et al., 2011). The dosages are expressed as weight of the compound inclusive of salt and extent of hydration and, for the different forms of MT, the amount of free MT base administered is given for each study. Thus, for certain experiments, the amount of free MT base may be up to 24% less for LMTX than for MTC.
Fig. 1.

Chemical structures of methylthioninium chloride (MTC) and leucomethylthioninium.2HX (LMTX). Two stabilized crystalline forms of LMTX were used in this study, one where X is bromide (LMTB) and the other where X is methane sulphonate (LMTM).
Compounds were administered at a dose range of 5–75 mg/kg at an injection volume of 5 ml/kg body weight, administered daily in the morning (08.00–10.00 h). MTC (Simpsons, Gwent, UK) was dissolved in deionized water. Stock solutions were kept at −4°C in darkness for up to 7 days. LMTX (TauRx Therapeutics Ltd., Aberdeen, UK) was dissolved in argon-sparged deionized water and administered within 20 min of dissolution. The MT content was measured by HPLC after complete oxidation of the drug.
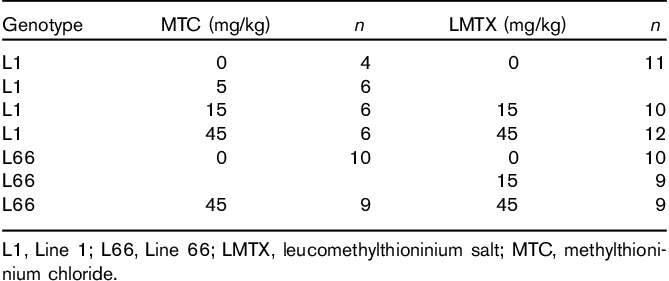
For behavioural observations of L1, we adopted a Monday–Friday gavaging regime over a period of up to 8 weeks (3 or 5 weeks before the test, 3 weeks during the test; Fig. 2a) for MTC and LMTX. For histopathological analysis, MTC and LMTX were administered consecutively for 19 days. By contrast, L66 mice were treated orally with daily injections for 19 successive days (14 days between the pretest and retest periods and 5 days during retest; Fig. 5a). Cohort sizes for each drug condition under behavioural testing have been summarized in Table 1. Between 24 and 48 h after the end of behavioural testing, the mice were killed by cervical dislocation; the brains were removed and snap frozen in liquid nitrogen for determination of MT content. Separate cohorts used for histological analysis of pathology without behavioural testing have been listed in Table 2, and the mice in these cohorts were euthanized 1 h after the last injection. Animals were treated with an overdose of Euthatal; thereafter, their skulls were opened and their brains removed rapidly; the brains were stored in 4% paraformaldehyde, embedded in wax and processed as described (Melis et al., 2015).
Fig. 2.
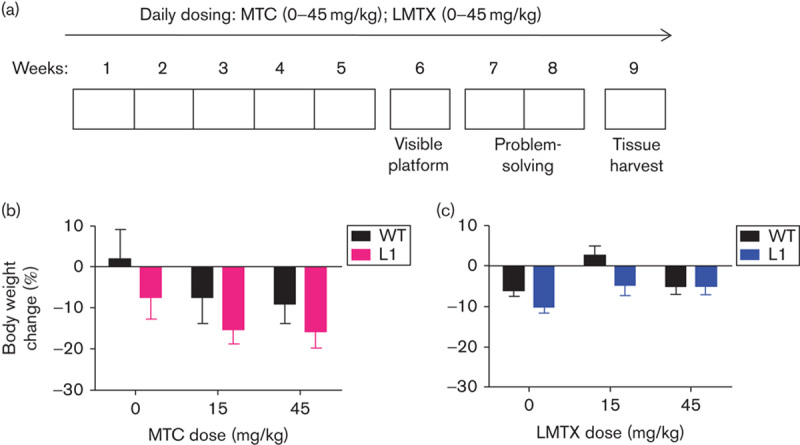
Experimental design adopted in the problem-solving task, and drug effects on body weight. (a) L1 and WT mice were orally treated for 5 weeks (Monday to Friday) with either vehicle, MTC or LMTX (15 and 45 mg/kg) and then tested in the water maze. The paradigm included visible platform training (week 6: 4 days), followed by training to criterion in three spatial problems (weeks 7 and 8) with continuing drug exposure. Brain tissue was collected during week 9. Effects of (b) MTC and (c) LMTX (in this case LMTM) on body weight in L1 and WT mice are shown. Body weight is expressed as the mean percentage change over 8 weeks relative to the start of treatment. Although there were some weight losses relative to pretreatment, drug exposure did not differ from vehicle for either genotype. The 45 mg/kg doses are equivalent to 35.1 mg MT/kg and 26.7 mg MT/kg for MTC and LMTM, respectively. Values are expressed as mean±SE. L1, Line 1; LMTX, leucomethylthioninium salt; MT, methylthioninium; MTC, methylthioninium chloride; WT, wild type.
Fig. 5.
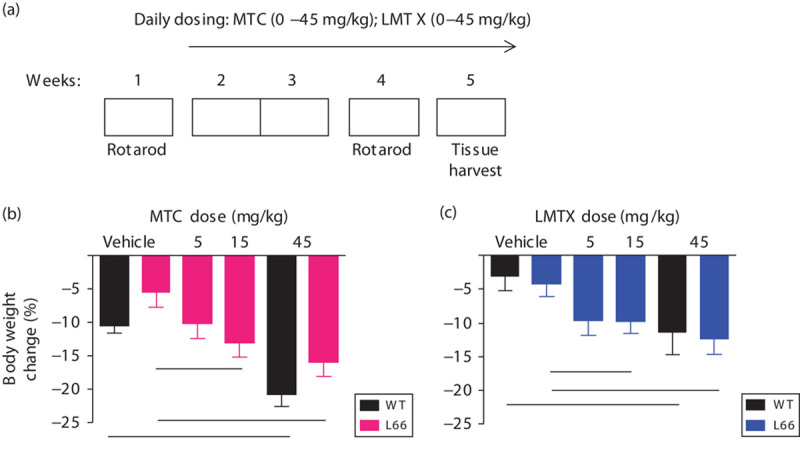
RotaRod study design and weight charts for L66 mice. (a) A RotaRod test in week 1 was used for cohort matching, followed by 2 weeks of daily drug treatment (Monday–Sunday) and a second RotaRod training (week 4). Tissue was harvested during week 5. In (b) L66 and (c) WT mice, MTC and LMTX (in this case, LMTB) induced a similar, yet significant, dose-dependent weight loss compared with vehicle controls (see asterisks). Values are expressed as mean±SE; *P<0.05. The 45 mg/kg doses are equivalent to 33 mg MT/kg for both MTC and LMTB. L66, Line 66; LMTX, leucomethylthioninium salt; MT, methylthioninium; MTC, methylthioninium chloride; WT, wild type.
Table 1.
Treatment groups and number of animals (n) according to genotype and dose tested to investigate the effect of MTC and LMTX on (A) the problem-solving water maze task and (B) on motor performance and motor learning on the RotaRod
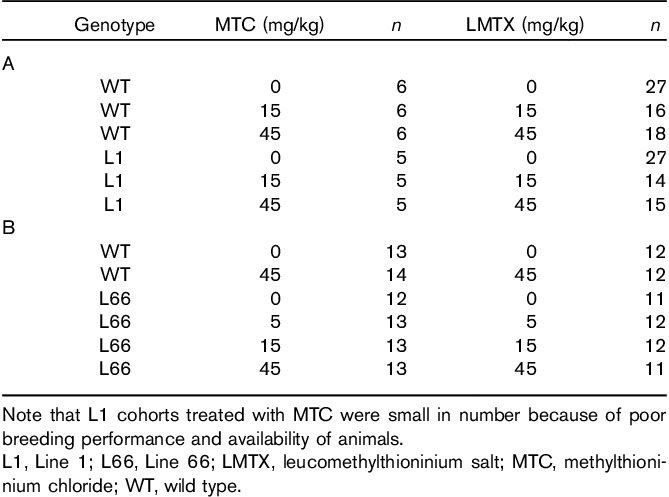
Table 2.
Treatment groups and cohort sizes (n) used for histopathology
Behavioural testing
Problem-solving task in the water maze
The water maze used in this study has been described previously (Melis et al., 2015). All extramaze cues were kept in place, and the grey pool (1.5 m diameter, 50 cm height) was filled with water (21±1°C) and a clear Perspex escape platform was submerged. An overhead video camera recorded the swim path online (Ethovision Pro 3.1; Noldus IT, Wageningen, the Netherlands). Curtains surrounded the circumference of the pool and could be drawn if needed.
Animals tested in the problem-solving water-maze task, as described previously (Melis et al., 2015), were randomly assigned to drug cohorts treated orally with the test compounds [either MTC or LMTX for a period of up to 5 weeks (Monday to Friday)], followed by a 15-day testing period, during which the animals were trained in the initial cued training (4 days) and training to criterion tests (2 weeks) to test the ‘learning capacity’ in acquiring three different platform locations (Fig. 2). During the cued training phase, mice were trained to locate a visible platform for four consecutive days and underwent four trials per day. A maximum time of 60 s was allowed to locate the platform; finding the platform was defined as staying on it for at least 2 s. A 10-min intertrial interval was included, during which the animals were allowed to warm up and dry under a 100 W heat lamp. The pool was surrounded by white curtains to occlude extramaze cues. The platform was cued by a flag placed on it (15 cm high), and the location was changed every training day in a predetermined manner to one of 20 possible sites.
During spatial training to criterion, the curtains were pulled back to reveal extramaze cues and the platform was submerged 1 cm below the water surface. Each animal was trained for up to eight trials per day for a maximum of 2 weeks to a rigorous performance criterion of three successive trials with an escape latency of less than 20 s. If the criterion was achieved before the eight daily trials were conducted, the session for this animal was terminated and a new problem (new platform location) was implemented on the following day. As measures of performance in the visible platform task, path length to reach the platform and the swim speed were recorded. In the problem-solving task, the dependent variable was the number of trials to criterion averaged across all three problems.
Motor performance and learning in the RotaRod test
We used a four lane rat RotaRod (TSE Systems, Bad Homburg, Germany) as described previously (Melis et al., 2015). Mice were placed on a rotating rod (1 rpm), which was accelerated from 1 to 45 rpm over 5 min. Trials were terminated either when the animals fell off the rod or when the maximum time had been reached. Lanes were allocated according to a Latin square design to counterbalance for rod position, time of testing and drug dose. Time to fall off, as an index of the speed of rotation sustained, was analysed as the dependent variable. In addition, several comparisons between predose and postdose performances were carried out to evaluate learning and memory (see the Results section). The apparatus was cleaned with 70% ethanol between trials.
Cohorts of different genotypes underwent initial assessment on the RotaRod that lasted for 3 days (four trials per day, intertrial interval 2–3 min), followed by allocation into drug groups matched by performance (Table 1B for animal numbers and doses). A treatment regime of 14 consecutive days commenced, with compounds administered orally by gavage, followed by a repeat of the 3-day RotaRod test to determine improvements induced by (i) previous exposure to the task and (ii) drug treatment (Fig. 5a). During post-treatment training, daily administration of test compound was continued. Dosing throughout the study was performed in the morning (08.00–10.00 h) and during the testing period, exactly 1 h before the first trial of each day. To determine the effects of drugs on WT controls, only the highest dose of each compound (45 mg/kg) was assessed. Two days after the last training trial, a final drug injection was administered and tissue was harvested 1 h later (the Tmax for drug; unpublished data) and frozen in liquid nitrogen. Samples were subjected to chemical analysis to determine the drug content in the brain (see below).
Insoluble tau was extracted from fast-frozen brain tissue of untreated L66 mice. Tissue was homogenized and tau isolated according to the procedure for preparing non-Pronase digested PHFs from AD tissue (Wischik et al., 1988; Harrington et al., 1991).
Histological procedures and measurement of methylthioninium
Immunohistochemical analysis
Mouse brains were treated as per standard protocol (Melis et al., 2015). Brains were fixed with paraformaldehyde, embedded in paraffin and 3–5 mm sections mounted on slides and stained using monoclonal antibody (mAb) 7/51 (hybridoma supernatant diluted 1 : 300) together with the EnVision Detection kit (Dako, Hamburg, Germany) for secondary anti-mouse-horseradish peroxidase. Tau-positive immunoreactivity was revealed with DAB/peroxidase, as per manufacturer’s instructions. The sections were counterstained with diluted haematoxylin.
Microscopy and cell counting
Sixteen 3-μm-thick sections of individual brains were stained simultaneously, including negative and positive controls (WT, L1 and L66 mice). Sections were viewed by light microscopy using a DM LB2 (Leica Microsystems, Wetzlar, Germany) or an Axiovert 135 (Zeiss Microscopy, Göttingen, Germany) microscope at ×50 to ×200 magnification. For histological sections of L1, tau-positive cells were counted by two experimenters blind to the experimental details in three sections, which were separated by a distance to avoid counting the same neurons in serial sections, corresponding to Bregma −3.16 mm, on the basis of the Mouse Brain Atlas (Franklin and Paxinos, 2008). Apart from the total number of cells labelled per section, regions of particular interest for tau load in cortical structures included the following: the entorhinal cortex, the hippocampus (Hip; polymorphic cells of dentate gyrus, CA3 and CA1), the visual cortex, the auditory cortex and the amygdala. To avoid recounting of the same cell, every fourth section was counted. The stronger histological labelling of tau-positive cells in L66 enabled the use of our in-house ‘tau-automated cell counter’ with manual correction. As a first step, regions of interest (see above) were defined manually and the software picked tau-positive cells of particular shape (hit-and-miss transform and Tophat transform) and stain intensity (Sobel operator on normalized colour plane) with greater than 70% correct counts. Faintly labelled cells or those with abnormal morphological shapes (due to differences in section plane), when identified, were manually added or deleted, as appropriate.
It turned out that the residuals of the number of counts was heavy tailed due to a few very high counts in some regions skewing the distribution. Consequently, data were log transformed (using the natural logarithm base, e) to normalize data distribution, and ln(count+1) was used for modelling of data.
Measurement of methylthioninium levels in the brain
Brain samples were analysed by means of the DCE liquid–liquid extraction method (Peter et al., 2000). Briefly, brain hemispheres were homogenized and sodium hexane sulphonate (0.5 ml, 5%), HCl (2 ml, 1 mol/l) and 1,2-dichloroethane (DCE; 2 ml) were added. Samples were then mixed for 15 min, after which the DCE layer was separated by centrifugation and evaporated to dryness under nitrogen. The concentration of MT in the DCE extract was determined by high pressure liquid chromatography using diode array detection at 660 nm. The lower limit of quantification was 30 ng/g.
Data analysis
Behavioural data were analysed using parametric statistics with factorial designs. Genotype and/or drug were treated as between-subject and trial/day as within-subject repeated-measures factors in analysis of variance, followed by the Bonferroni-corrected t-test. For other data, group comparison was by one-way analysis of variance followed by Student’s t-test, where appropriate. Correlations between drug levels and behavioural performance were established using Pearson’s linear regression. All analyses were two-tailed (unless stated otherwise) and were conducted using GraphPad Prism (V 4.01; GraphPad Software, La Jolla, California; behaviour) or the R software environment (cell counts; R Development Core Team, 2004), with linear models focussing on the variation between vehicle group and normalization of output by drug treatment, and α set to 5%. Statistical terms have been reported only for reliable differences. Outlier determination was performed with GraphPad QuickCalcs (http://graphpad.com/quickcalcs/); Z-values greater than 2.5 were calculated using the Grubbs method for identification of single extreme studentized deviates. Three values in total were excluded from analysis and have not been reported.
Results
Methylthioninium reverses spatial deficits in Line 1 tau mice and reduces tau pathology in the entorhinal–hippocampal axis
Behavioural effects
L1 and WT mice aged 5 months were dosed daily by oral gavage with MTC or LMTX at doses of 15 and 45 mg/kg (corresponding to 11.7 and 35.1 mg MT/kg for MTC and 8.9 and 26.7 mg MT/kg for LMTX; Fig. 2a). Both compounds led to weight reduction (Fig. 2b and c); effects were typically more pronounced in L1 mice compared with age-matched WT mice (main effect of genotype:F>1.4, P<0.05). However, the genotype×dose interaction was not significant, suggesting similar trends for all drug conditions (including vehicle) and, therefore, the absence of specific drug-related negative overall effects of either compound on general health and food consumption.
Methylthioninium chloride: When tested in the visual platform task in the water maze over 4 days (Fig. 3a), WT and L1 mice on vehicle performed equally [genotype effect: F(1,27)=3.2, NS] in terms of mean path length to platform, and both improved over days [F(3,27)=4, P<0.02]. In WT mice, there was a significant main effect of drug [F(2,45)=5.8, P<0.01] because of an improvement in the group receiving 15 mg/kg MTC relative to vehicle [dose effect: F(1,30)=12.2, P<0.01], especially on days 1 and 2 (t-values>2.2, P<0.05). However, the 45 mg/kg cohort did not differ from controls. No drug effect was observed in the L1 cohorts, but there was a strong effect of day [F(3,36)=13.6, P<0.001], indicating progressive improvement in performance. There was no genotype difference between the first and last trial. By contrast, there was a clear and persistent difference between genotypes in swim speed. L1 mice swam faster than WT mice [F(1,27)=21, P<0.001], and drug dosing did not alter the velocity in either genotype (Fig. 3b).
Fig. 3.
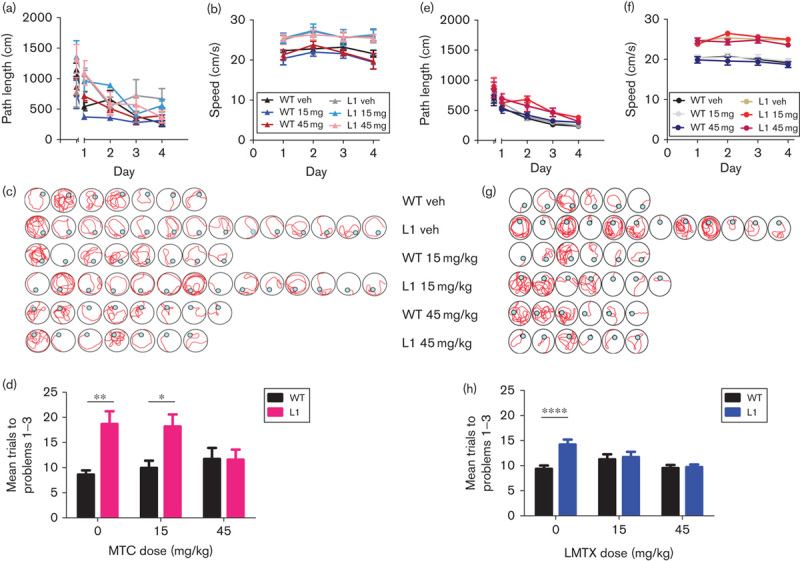
Visible platform training and spatial learning in the problem-solving task of the water maze, following either (a–d) MTC or (e–h) LMTX treatment. (a) Path length (including trial 1 of the first day of training) and (b) swim speed of the MTC cohorts recorded during 4 days of cued training. Although there was no difference between L1 and WT mice in path length, L1 mice swam significantly faster; however, there was no effect of MTC. Representative sample swim traces for MTC cohorts are shown in (c). Differences in the mean number of trials required to reach criterion in three problems (d) for the different MTC cohorts of L1 suggests deficits in these mice. Compared with vehicle-treated WT mice, L1 mice required more trials to attain criterion (asterisks), and this was reversed by MTC at 45 mg/kg. (e) Path length and (f) swim speed of LMTX cohorts recorded during cued training. Although there were small differences between L1 and WT in path length, the cohorts did not differ in trial 1 or in the final trials on day 4. Again, L1 mice swam consistently faster, but there was no effect of LMTX. (g) Representative sample swim traces of LMTX cohorts. (h) Results of the mean trial number required to reach criterion in three problems for the different LMTX cohorts confirm an impairment in L1 mice treated with vehicle (asterisks). Both 15 and 45 mg/kg LMTX reversed these deficits. The 45 mg/kg doses are equivalent to 35.1 mg MT/kg and 26.7 mg MT/kg for MTC and, in this case, LMTM, respectively. Values are expressed as mean±SE. *P<0.05; **P<0.01; ****P<0.0001. L1, Line 1; LMTX, leucomethylthioninium salt; MT, methylthioninium; MTC, methylthioninium chloride; WT, wild type.
When tested for solving three successive spatial problems, L1 mice presented with an overall deficit in terms of the mean number of trials required to solve each problem. Figure 3c depicts sample traces representative of each genotype and drug condition and indicates longer training required to meet criterion in L1 mice receiving either vehicle or 15 mg/kg MTC relative to the matching WT cohorts. This impairment was reversed in mice receiving 45 mg/kg MTC (i.e. 35.1 mg MT/kg; Fig. 3d). There was a significant genotype×drug interaction [F(2,27)=3.9, P<0.05] in L1 mice [F(2,14)=6.1; P<0.02] due to a significant dose effect but not in WT mice (F<1). These data provide evidence for reversal of learning and memory impairment in L1 mice. As for the visible platform test, swim speed was faster in L1 mice and was unaffected by MTC treatment (not shown).
Leucomethylthioninium: Visible platform training revealed an impairment in L1 mice relative to WT mice for path length [Fig. 3e; F(1,156)=34, P<0.001 for vehicle cohorts]. This was due mainly to longer swim paths on the first 2 days of testing, and there was no reliable difference at day 4. Treatment with neither 15 nor 45 mg/kg LMTX had any effect on path length for either genotype (genotype effect: F<2), confirming that treatment did not impair motor performance. Faster swim speed was again observed in L1 mice compared with WT mice (Fig. 3f; genotype effect: F(1,156)=75, P<0.001 for vehicle), and these differences were not altered by pretreatment with LMTX (drug effect: F<2).
In addition, problem-solving was impaired in vehicle-treated L1 mice, shown by both the sample traces (Fig. 3g) and the average number of trials required to achieve criterion (Fig. 3h). Treatment with LMTX at a dose of 15 mg/kg (8.9 mg MT/kg) was sufficient to reverse spatial impairment and restore the performance to WT levels, and the same effects were also seen at 45 mg/kg. Both genotype and drug effects were significant [F>3.9, P<0.02), as was the interaction between these factors [F(2,105)=5.5, P<0.005]. This was due entirely to the deficit in the vehicle L1 cohort, which was reversed by 15 and 45 mg LMTX/kg. In agreement with the data from the visible platform test (Fig. 3f), swim speed was also faster in the L1 cohorts during spatial training and was not modulated by LMTX.
Effects of methylthioninium chloride and leucomethylthioninium on immunohistochemical measures of aggregated tau in Line 1
Separate cohorts of mice were treated for 3 weeks with MTC before killing. Example photomicrographs of hippocampal and cortical sections from WT and L1 specimens are shown in Fig. 4a, and the data are summarized in Fig. 4b and c. For MTC, cohorts treated with 5 and 75 mg/kg were also included; the former was not tested behaviourally, and the latter caused some behavioural reactions (hunched posture, low activity, piloerection), which were transient but potentially confounding for behavioural assessments. For LMTX, the only doses tested were 15 and 45 mg/kg.
Fig. 4.
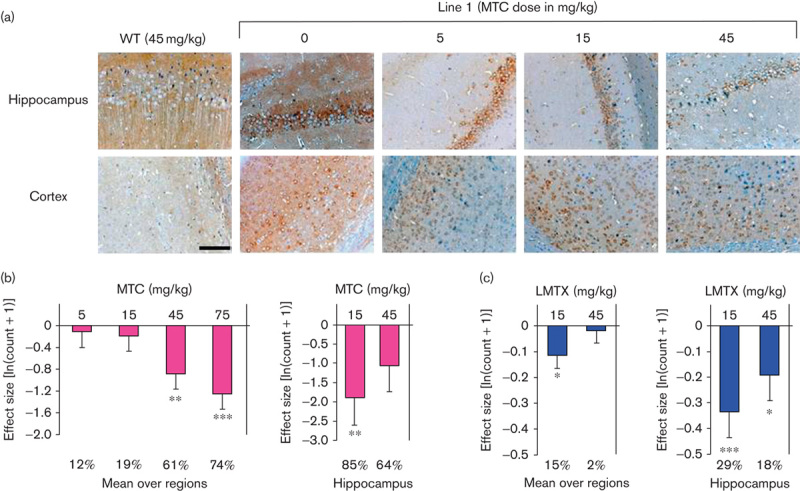
Immunohistochemical analysis of the effects of MT on tau aggregates in L1 mice. (a) Representative photomicrographs of WT and L1 brain sections, labelled with mAb 7/51, following treatment with MTC as indicated. Both the hippocampus and the cortex were free from tau aggregates in WT mice treated with 45 mg/kg MTC, whereas there were numerous tau-reactive neurons in L1 mice treated with either vehicle or 5 mg/kg MTC. Less tau-positive immunoreactivity was visible in L1 mice treated with 45 mg/kg MTC. Scale bar, 100 μm. The effect size, expressed as ln(count+1) +S.E., is shown for the mean value over all regions and in the hippocampus for (b) MTC and (c) LMTX (in this case, LMTB). *P<0.05, **P<0.01, ***P<0.001. The percentage reduction in counts compared with zero dose is shown at foot. The 45 mg/kg doses are equivalent to 35.1 mg MT/kg and 28.1 mg MT/kg for MTC and LMTB, respectively. L1, Line 1; LMTX, leucomethylthioninium salt; MT, methylthioninium; MTC, methylthioninium chloride; WT, wild type.
Methylthioninium chloride: A reduction in the counts of neurons showing reactivity with mAb 7/51 was visible at low power in the hippocampus and cortex at higher MTC doses (Fig. 4a), relative to WT controls exposed to the highest MTC dose (45 mg/kg). The mean counts of neurons with tau aggregates averaged across regions of interest and for the hippocampus are plotted in Fig. 4b. This shows a significant reduction in tau-reactive neurons in mice treated with MTC at 45 and 75 mg/kg, but not at 5 or 15 mg/kg. In the hippocampus, there were reductions at 15 and 45 mg/kg.
Leucomethylthioninium: Likewise, a significant reduction in the mean count of tau-positive cells averaged across regions of interest was seen in animals treated with LMTX at 15 mg/kg, but not at 45 mg/kg (Fig. 4c). In the hippocampus, the effect was significant at both doses; no other region showed statistically significant effects. These results are in line with the behavioural benefit seen in L1 mice after treatment with LMTX.
Methylthioninium reverses motor learning deficits in Line 66 tau mice and reduces brain tau pathology globally
L66 mice express widespread tau aggregation pathology, affecting particularly the entorhinal cortex and the hippocampus. Nevertheless, there was no evidence of a spatial memory deficit, but rather a prominent motor deficit that progressed with age, culminating in homozygous animals with a dyskinesia syndrome at about 7 months, reminiscent of Parkinsonian features seen clinically in frontotemporal lobar degeneration. The behavioural effect of treatment with MTC or LMTX was examined in heterozygous mice using the RotaRod (Melis et al., 2015). Exploratory studies showed that a shorter 2-week treatment regime could reduce the numbers of tau-reactive cells (see below). Hence, L66 mice were treated for 19 days with either vehicle or drug (MTC or LMTX) at doses of 5, 15 and 45 mg/kg (equivalent to 3.6, 11.0 and 33.0 mg MT/kg for both MTC and LMTX; Fig. 5a).
Methylthioninium chloride
After verification of the behavioural phenotype in a 3-day RotaRod test, animals were matched and treated for 2 weeks before a post-treatment test was administered. During the period of treatment, there was dose-dependent weight reduction in the L66 MTC cohorts independent of genotype [Fig. 5b, see asterisks; dose effect: F(3,50)=3.9, P<0.02]. A similar weight reduction was also observed in WT controls.
Heterozygous L66 mice (8–9 months) were significantly impaired in learning the RotaRod task before treatment (Fig. 6a). Mice did not differ on day 1 (trials 1–3), but controls were able to increase the time spent on the RotaRod during days 2 and 3, indicating motor learning. This was confirmed statistically by a reliable genotype×trial interaction [F(11,836)=5.5, P<0.001] and both main effects were also significant (F>5, P<0.05). The overall improvement in performance between trials 1 and 12 was significantly higher in WT compared with L66 mice (Fig. 6d). Mice were categorized into different drug cohorts on the basis of learning curves and were reassessed after 2 weeks of treatment.
Fig. 6.
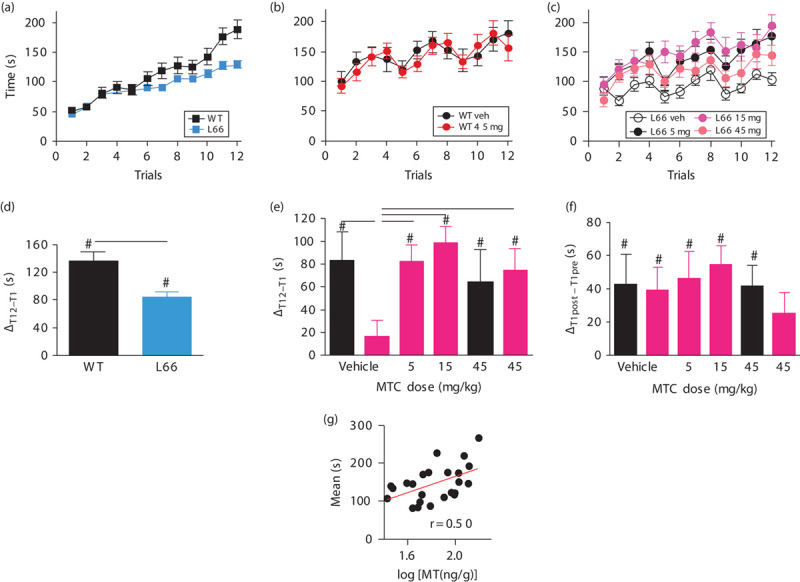
Motor performance and motor learning on the RotaRod in MTC-treated cohorts. (a) Pretreatment performance is plotted as the time sustained on the accelerating rod in both WT and heterozygous L66 mice. L66 mice showed no performance deficit initially, but WT mice more readily learned the task over 3 days (four trials per day). (b) MTC did not affect post-treatment performance in the WT cohort compared with vehicle, but (c) it improved L66 performance at doses of 5 and 15 mg/kg, but not 45 mg/kg. Overall learning (determined as the difference in performances between trial 12 and trial 1) was less in L66 mice compared with WT mice both (d) before treatment and (e) after treatment with vehicle. This motor learning deficit was rescued by MTC at all doses (e, asterisks). Memory (shown by the difference between pretreatment trial 1 and post-treatment trial 1, f) did not differ between groups and was independent of dose. Values are expressed as mean±SE; *P<0.05; ***P<0.001; #reliable learning (data significantly different from 0). (g) Motor performance in L66 mice was correlated with the concentration of total MT in the brain (r=0.50, P<0.01). The 15 mg/kg doses are equivalent to 11 mg MT/kg for MTC. L66, Line 66; MT, methylthioninium; MTC, methylthioninium chloride; WT, wild type.
MTC administered at 45 mg/kg did not affect the performance of WT controls (Fig. 6b). In contrast, there was a striking improvement in L66 mice receiving treatment compared with their vehicle controls [Fig. 6c; F(33,517)=4.1, P<0.01]. Doses of both 5 and 15 mg/kg produced significant benefit (dose effect: F>10, P<0.005), whereas 45 mg/kg did not. Post-treatment learning was shown by improvement in performance from trial 1 to trial 12 (Fig. 6e) and confirmed the absence of learning in the L66 vehicle cohort compared with the WT cohort. All doses of MTC produced full recovery of motor learning, as measured by the difference between trial 1 and trial 12. The effect of treatment on motor memory was tested by measuring the difference between pretreatment trial 1 and post-treatment trial 1 (Fig. 6f). No drug effect was found in either WT or L66 mice, and all animals started at a higher level of performance post-treatment.
The total MT concentrations in the brains of animals dosed with either 5 or 15 mg/kg were correlated with the mean performance on the RotaRod during post-treatment trials (r=0.5, P<0.01; Fig. 6g).
Leucomethylthioninium
Pretreatment RotaRod testing of 8–9-month-old heterozygous L66 and WT mice (Fig. 7a) revealed a significant difference between genotypes. Again, there was no difference during trials 1–3, indicating that motor performance was less severely affected than motor learning over 3 days. The main effects of genotype and trial were significant [F values>14.26, P<0.001], as was the interaction between both factors [F(11,759)=6.9, P<0.001]. The difference in learning was confirmed by the change in performance between the first and last pretreatment trials (Fig. 7d).
Fig. 7.
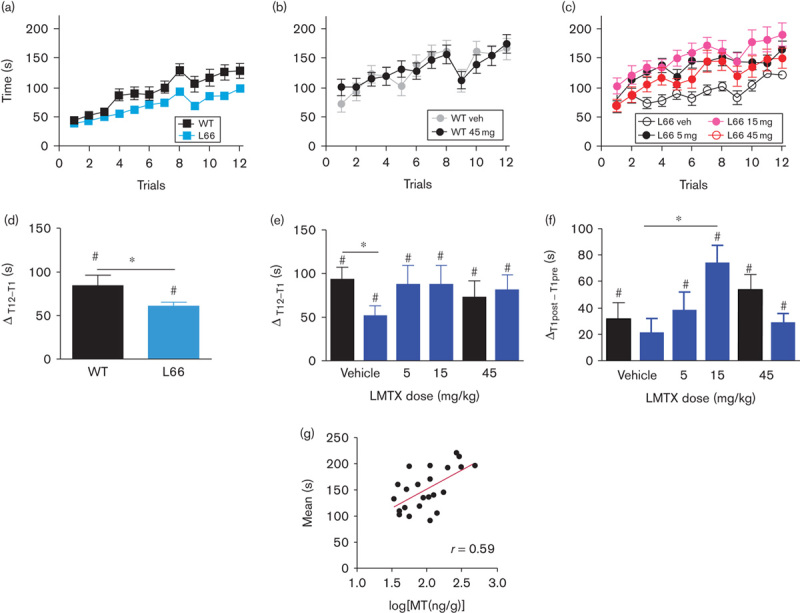
Motor performance and motor learning on the RotaRod in LMTX-treated mice. (a) Pretreatment performance is plotted as the time sustained on the accelerating rod for both WT and heterozygous L66 mice. L66 mice showed no performance deficit initially, but WT mice more readily learned the task over 3 days (four trials per day). (b) Compared with vehicle, LMTX did not affect post-treatment performance in WT mice. (c) In contrast, the performance of L66 mice was improved by all doses of LMTX. Overall learning scores in L66 mice were lower (d) before treatment but not (e) after treatment relative to WT. (f) All groups other than L66 mice treated with vehicle showed better performance, consistent with motor memory, from pretreatment trial 1 to post-treatment trial 1. L66 mice receiving 15 mg/kg LMTX showed significantly better motor memory than vehicle-treated L66 mice. Values are expressed as mean±SE. *P<0.05, #P<0.05 relative to 0. (g) The brain MT concentration and motor performance for L66 mice treated with LMTX (5 and 15 mg/kg; in this case LMTB) showed a positive correlation (r=0.59, P<0.01). The 15 mg/kg doses are equivalent to 11 mg MT/kg for LMTB. L66, Line 66; LMTB, leucomethylthioninium bromide; LMTX, leucomethylthioninium salt; MT, methylthioninium; MTC, methylthioninium chloride; WT, wild type.
After 2 weeks of LMTX treatment, WT mice treated with LMTX at 45 mg/kg did not differ from vehicle controls (Fig. 7b). Both groups improved in performance, as indicated by a significant main effect of trial [F(11,242)=9.04, P<0.001]. There was evidence of an effect of treatment in L66 mice receiving any dose of LMTX [Fig. 7c; F(3,473)=7.11, P<0.001]. The difference with respect to vehicle was significant at all three doses [5 mg/kg: F(1,231)=20.23, P<0.001; 15 mg/kg: F(1,231)=21.28, P<0.001; 45 mg/kg: F(1,231)=5.28, P<0.025]. A significant difference in post-treatment learning between WT and L66 mice receiving vehicle was revealed for the improvement in performance from trial 1 to trial 12 (Fig. 7e). There was an overall effect of drug in L66 mice at all doses, such that the difference between WT and L66 mice was eliminated by treatment (F<1). The effect of treatment on motor memory was tested by measuring the difference between pretreatment trial 1 and post-treatment trial 1. There was a significant benefit of treatment with LMTX at 15 mg/kg, but not at any other dose (Fig. 7f). At this dose, mice receiving LMTX between the pretreatment and post-treatment testing periods were better able to draw on motor learning acquired during the pretreatment period than vehicle-treated controls.
Total MT concentrations in the brain in animals dosed with 5 or 15 mg/kg were correlated with performance, as measured by the mean value for the 12 post-treatment trials (r=0.59, P<0.002; Fig. 7g).
Relationship between the total methylthioninium level in the brain and the mean RotaRod performance
Levels of MT were measured in brain tissue of mice treated with either MTC or LMTX at 5 or 15 mg/kg and correlated with the mean RotaRod performance in the 12 post-treatment trials (Fig. 8). Both MTC and LMTX led to similar MT brain concentrations, in the range of 0–0.7 μmol/l MT. In mice treated with MTC, MT levels in the brain did not exceed 0.7 μmol/l, whereas in two LMTX-treated mice dosed at 15 mg/kg, brain concentrations were higher (>1.2 μmol/l), and these mice also showed strongly improved performance. The data demonstrate that the concentration–response relationship is sigmoidal over a 10-fold range of concentrations (0.13–1.38 μmol/l MT) and reaches ceiling at MT concentrations of 0.6 µmol/l or higher.
Fig. 8.
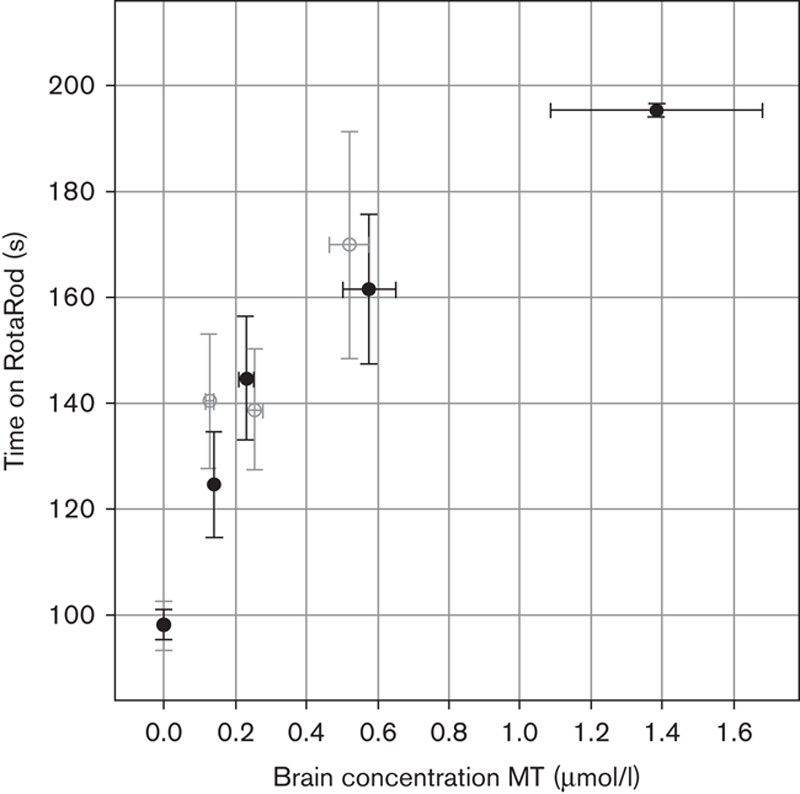
Motor performance of L66 mice treated with MTC and LMTX as a function of brain MT concentration. The performance, as measured by the mean time of 12 post-treatment trials spent on RotaRod, for L66 mice treated with 5 or 15 mg/kg MTC (○) or LMTX (●) is plotted as a function of brain MT concentration. Performance and brain concentrations of MT are similar, whether delivered as MTC or LMTX. There is nonlinear improvement in performance over a 10-fold MT concentration range, with evidence of plateauing at MT concentrations of 0.6 mmol/l (MTC) and 1.4 mmol/l (LMTX, in this case LMTB). The 5 and 15 mg/kg doses are equivalent to 3.7 and 11 mg MT/kg for both MTC and LMTB. L66, Line 66; LMTB, leucomethylthioninium bromide; LMTX, leucomethylthioninium salt; MT, methylthioninium; MTC, methylthioninium chloride; WT, wild type.
Effects of methylthioninium chloride and leucomethylthioninium on immunohistochemical measures of aggregated tau in L66
Separate cohorts of L66 mice were treated with MTC (45 mg/kg, 8–9 months, heterozygous) and LMTX (15 and 45 mg/kg, 3–4 months, homozygous) for 3 weeks, and brain tissues were processed for immunohistochemical analysis. Representative examples are depicted in Fig. 9a (vehicle) and Fig. 9b (LMTX at 45 mg/kg). There was considerably less tau immunoreactivity within entorhinal pyramidal cells for an animal treated with LMTX.
Fig. 9.
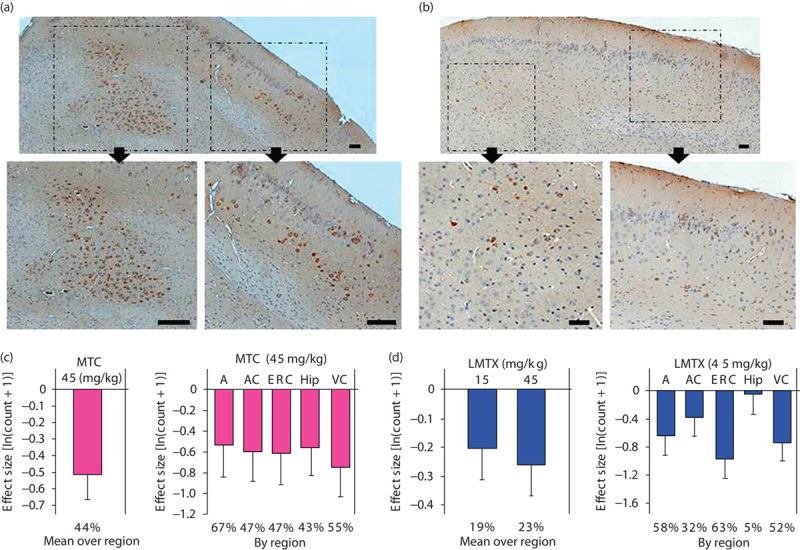
Immunohistochemical analysis of the effects of MT on tau aggregates in L66 mouse brain. Representative photomicrographs of L66 brain sections treated with (a) vehicle or (b) LMTX (45 mg/kg). The top sections depict intracellular tau stained with mAb 7/51 in the entorhinal cortex, with inserts showing regions of interest depicted with higher magnification below (arrows). There was less tau in the LMTX-treated tissue. Scale bar, 100 μm. The effect size, expressed as ln(count+1)+S.E., is shown for means over all regions and by individual region for (c) MTC and (d) LMTX. *P<0.05, **P<0.01, ***P<0.001. The percentage reduction in counts compared with zero dose is shown at foot. The 45 mg/kg doses are equivalent to 35.1 mg MT/kg and 28.1 mg MT/kg for MTC and, in this case, LMTB, respectively. A, amygdala; AC, auditory cortex; ERC, entorhinal cortex; Hip, hippocampus; L66, Line 66; LMTX, leucomethylthioninium salt; mAb, monoclonal antibody; MT, methylthioninium; MTC, methylthioninium chloride; VC, visual cortex; WT, wild type.
Methylthioninium chloride: There was a significant reduction in the number of tau-immunoreactive cells averaged across regions of interest (Fig. 9c). The differences were of comparable magnitude in the entorhinal cortex, the hippocampus, the amygdala, the auditory cortex and the visual cortex.
Leucomethylthioninium: Likewise, there were reductions in the mean number of tau-positive cells averaged across regions of interest at both doses (Fig. 9d). The effect of treatment with 15 mg/kg failed to reach statistical significance (P=0.065), but the effect was reliable at 45 mg/kg. The differences at the higher dose were significant in the entorhinal cortex, the amygdala and the visual cortex, but not in the hippocampus or the auditory cortex.
Effects of methylthioninium on aggregated tau extracted from Line 66 mouse brains
Aggregated tau was isolated from 8-month-old homozygous L66 mouse brains using the protocol developed for the isolation of non-Pronase-treated PHFs from AD brain tissue through differential centrifugation steps, yielding a low purity preparation of filamentous aggregates (Wischik et al., 1988). The predominant species of tau in this fraction migrated with an apparent mobility of 55–72 kDa (Fig. 10). A number of proteases were tested to determine whether the L66 tau aggregates showed evidence of binding through a proteolytically stable core-tau unit from the repeat domain similar to that found in AD PHFs (Wischik et al., 1988; Novak et al., 1993). The tau aggregates from L66 mice were found to be much more proteolytically susceptible than PHFs from AD brains, and Pronase, even at low concentrations, completely digested the aggregated tau (not shown). Micrococcal nuclease had mild proteolytic activity, sufficient to permit partial molecular dissection of aggregated tau from L66 mice. Partial digestion resulted in complete elimination of bands corresponding to full-length tau and an enrichment of species containing the repeat domain, corresponding to 14 and 24 kDa bands (Fig. 10), similar to those found in tau preparations extracted from the AD PHF core, where species of 12/14 kDa and their dimers were also found (Jakes et al., 1991). Ex vivo digestion with an exogenous protease, in the presence of MT at a concentration range 4–38 µmol/l, resulted in the elimination of these PHF core-tau species. Thus, the tau aggregates produced in L66 mice contain a core restricted to the repeat domain, which is relatively more proteolytically stable than the N-terminal and C-terminal domains. MT abolishes the proteolytic stability of the core-tau-binding domain and is therefore able to act as a tau aggregation inhibitor for the tau aggregates in L66 mice.
Fig. 10.
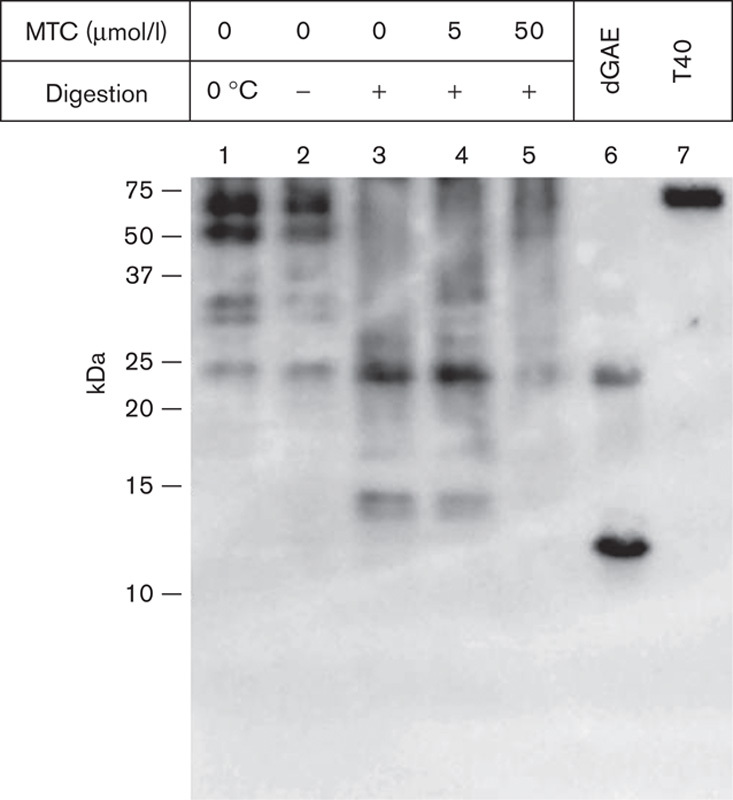
MTC disrupts tau aggregates extracted from mouse brains. Insoluble tau fractions were prepared from the brains of 8-month-old L66 mice that had not been treated with drug. These fractions were prepared using the method to produce non-Pronase PHFs from AD tissue. Fractions were incubated with micrococcal nuclease (2 U/ml in the presence of 3 mmol/l MgCl2) for 1 h at 37°C and centrifuged for 30 min at 42 000g; the pellet was analysed by SDS-PAGE and by immunoblotting with mAb 7/51. This led to the generation of a core-tau fragment having the gel mobility of a 12/14 kDa fragment (lane 3) and a more prominent dimer. These were decreased in intensity or absent when MTC was included at 5 and 50 μmol/l (lanes 4 and 5). Control samples were incubated for 1 h either on ice (lane 1) or at 37°C (lane 2) in the absence of nuclease. Tau proteins were included for reference: recombinant, truncated tau297–391 (dGAE; Novak et al., 1993) expressed in Escherichia coli and full-length htau40 (T40) expressed in eukaryotic cells. The positions of molecular weight markers, in kDa, are shown on the left. AD, Alzheimer’s disease; L66, Line 66; mAb, monoclonal antibody; MTC, methylthioninium chloride.
Discussion
With the failure, to date, of 19 clinical trials at phase 2 or 3 stages targeting various aspects of the pathway leading to pathological deposition of β-amyloid protein in the brain, there is increasing interest in the potential utility of treatments targeting the tau pathology of AD (Wischik et al., 2014). MT belongs to a class of diaminophenothiazines that have tau aggregation inhibitor activity in vitro (Wischik et al., 1996; Harrington et al., 2015). MTC, in which MT is dosed as MT+, was investigated in an exploratory phase 2 dose-ranging double-blind clinical trial of AD of mild or moderate severity in 321 participants (Wischik et al., 2015). The minimum effective dose was identified as 138 mg MT/day at both clinical and molecular imaging endpoints at 24 weeks. Treatment at this dose was found to prevent the decline in regional cerebral blood flow, particularly in medial temporal lobe structures and temporoparietal regions. Decline in blood flow in these brain regions on functional imaging scans measuring either blood flow or glucose uptake has been shown to be correlated with the extent of tau aggregation pathology measured by Braak stage (Wischik et al., 2015). These results are consistent with the possibility that the clinical benefit of treatment with MT may be linked to its activity as a tau aggregation inhibitor. In the present study, we have sought to confirm such activity using MT, administered in both oxidized (MTC) and reduced (LMTX) forms, in two transgenic mouse lines modelling cognitive and motor tauopathy endophenotypes. We have also sought to determine whether the brain concentrations required for activity on behavioural and pathological readouts are consistent both with the MT concentrations required for activity as a tau aggregation inhibitor in vitro and with the estimated brain MT concentrations occurring at the minimum effective dose determined clinically in AD.
There have been several reports of MTC having activity in transgenic mouse models of tauopathy. Global attenuation of tau pathology in a mouse model based on overexpression of full-length mutant tau (JNPL3, expressing the P301L mutation) was reported following 5 months of exposure to MTC in drinking water or 2 weeks of daily oral gavaging in mice (Congdon et al., 2012; Hosokawa et al., 2012), although there were no corresponding behavioural studies. Another mouse model (P301L), with tau expression under the control of the tetracycline-operative responsive element and producing a very strong pathological phenotype (rTg4510), was found to show benefit of treatment with MTC administered through an osmotic mini pump into one hippocampal hemisphere (Ramsden et al., 2005; O’Leary et al., 2010). In another study, MTC administered through drinking water was found to lower normal tau levels, but it did not affect the pre-established tau aggregation pathology (O’Leary et al., 2010; Spires-Jones et al., 2014). Other models with weaker pathology (e.g. 3xTg-AD mouse, Medina et al., 2011; P301S mouse, Stack et al., 2014) showed a reduction in tau pathology, although there have been contradictory findings (Spires-Jones et al., 2014). Although generally supportive, studies in which MTC is administered through drinking water do not control dose adequately, and investigators have not determined the effective brain concentration of MT required to yield benefit. There are significant technical difficulties to the measurement of MT in tissues, and some claims with regard to brain concentrations achieved after oral dosing are implausible and inconsistent with the results of studies using radiolabelled MT (Baddeley et al., 2015).
Although other models of tauopathy have been examined in the water maze (O’Leary et al., 2010), we have adopted more refined protocols to capture subtle improvements that can occur after short-term treatments. There was no effect of the L1 genotype on the performance during the visual phase of the water maze. We used a spatial problem-solving task that encompasses both reference memory and behavioural flexibility, which reflect the clinical problems in switching between tasks and cognitive inflexibility, which are early indicators of cognitive impairment in AD (Traykov et al., 2007; Weiler et al., 2014). In MTC-treated and LMTX-treated groups, both compounds rescued this learning impairment and restored behavioural flexibility. Following treatment, the performance of L1 mice became indistinguishable from that of WT controls. MTC was required at a dose of 45 mg/kg (equivalent to 35 mg MT/kg) to produce benefit, whereas with LMTX recovery was already evident at 15 mg/kg (9 mg MT/kg). Spatial learning and memory were normalized after 8 weeks of treatment at these doses. After 19 days of treatment, the 45 mg/kg dose of MTC produced an overall reduction of 61% in tau-reactive neurons, and in the subiculum, the reduction was 83%. It does not appear that a reduction of this magnitude is necessary for behavioural improvements, as with LMTX at 15 mg/kg, the reduction in tau-positive cells was 15% overall and 29% in the hippocampus after 19 days of treatment. As corticohippocampal processing is critical for working memory and behavioural flexibility, the reduction in tau-immunoreactive neurons in the hippocampus, the subiculum and the entorhinal cortex reflects the same change in tau aggregation that underlies the behavioural efficacy of MT in L1 mice.
As deficits in motor performance are the most prominent phenotypic feature of transgenic models of the L66 type, we have used the RotaRod to examine the effects of treatment. L66 is associated with a reliable motor learning deficit that manifests as failure to improve performance over repeated trials, without any difference in baseline performance. The motor learning deficit, as measured by the difference in time on the RotaRod between the first and the last trial, was corrected at all doses tested, including the lowest dose of 5 mg/kg (4 mg MT/kg). The two drugs produced equivalent benefit. However, it was possible to distinguish between MTC and LMTX on the basis of task memory, as measured by the difference between pretreatment trial 1 and post-treatment trial 1. L66 mice receiving LMTX at 15 mg/kg between the pretreatment and post-treatment testing periods were better able than vehicle-treated controls to retrieve motor learning acquired during the initial testing period. The effect on numbers of tau-immunoreactive cells was not determined at 5 mg/kg for either drug. The effect of treatment at a dose of 45 mg/kg for 19 days in L66 mice was a reduction in the number of tau-positive neurons overall by 44% with MTC and by 23% with LMTX. For both drugs, the effects were widespread, including effects on the hippocampus and the cortex.
Administration of MTC and LMTX had no effect on motor performance of WT mice, providing evidence of good tolerability. This is despite a weight loss of 15–20% arising over the course of 8 weeks of oral administration, which was identical in WT and L1 cohorts and was also unrelated to behavioural performance. The only behavioural effect of MT treatment on WT animals was a significant improvement during days 1 and 2 of the visual phase of the water maze, at an MTC dose of 15 mg/kg. This effect was not associated with any improvement in the subsequent problem-solving task and was also not seen at any dose of LMTX. The significance of this finding is unclear, although we have previously reported that MTC is able to reverse a spatial learning deficit caused pharmacologically by lowering of cholinergic tone using scopolamine in otherwise normal mice (Deiana et al., 2009).
We have established a consistent dose–response relationship between MT levels measured in the brain and the mean RotaRod performance in L66 mice for both MTC and LMTX. The RotaRod provides a technically more tractable paradigm in which to establish such relationships than the problem-solving version of the water maze paradigm. At the lowest effective dose (4 mg MT/kg), the mean brain concentrations of total MT were 0.15±0.01 and 0.19±0.02 μmol/l respectively for MTC and LMTX. As shown in Fig. 8, there was a progressively increasing performance benefit over a 10-fold concentration range of brain MT (0.13–1.38 μmol/l). In particular, we did not find evidence for a bell-shaped concentration–response relationship. Importantly, when corrected for brain concentration, the effects of MT were comparable whether dosed as MTC or LMTX. The relative superiority of LMTX compared with MTC is therefore more likely due to factors related to absorption, metabolism and distribution, rather than to inherent pharmacodynamic differences. The lowest brain concentration of MT at which benefit could be demonstrated corresponds closely to the Ki value (0.12 μmol/l) for MT activity as an inhibitor of tau aggregation in cells (Harrington et al., 2015). This brain concentration is also close to the estimated steady state trough brain concentration of MT and its pharmacologically active desmethyl metabolites in humans receiving the minimal clinically effective dose of 138 mg MT/day in the phase 2 trial of MTC (0.16 μmol/l; Baddeley et al., 2015).
Our data also confirm directly that MT has an effect on aggregated tau in extracts isolated from L66 brain tissues, similar to that found for PHFs isolated from AD brain tissues. In both, it is possible to define a relatively more proteolytically stable core that is restricted to the repeat domain of tau, corresponding to the critical tau–tau aggregation domain (Wischik et al., 1988; Novak et al., 1993). This proteolytic stability can be reversed in the presence of MT, a result similar to that first reported for AD PHFs (Wischik et al., 1996). The requirement for higher concentrations of MT in the partially enriched preparations of L66 tau aggregates (4–38 µmol/l), compared with highly purified preparations of PHFs isolated from AD brain tissues (0.15–0.20 µmol/l; Harrington et al., 2015), is unlikely to be due to a different inherent activity at the tau–tau binding domain in L66 aggregates, as activities on tau–tau binding in vitro, in cell models of tau aggregation and in isolated PHFs, all occur at comparable concentrations of MT. Rather, the shortness of the incubation period (1 h), the need to conduct the experiment on ice and nonspecific binding of MT in the brain homogenate are likely to be factors contributing to the lower apparent activity. As the proteolytic stability of the repeat domain in L66 aggregates can be entirely abolished in the presence of MT, we conclude that this property is due to aggregation through the repeat domain, and that MT acts as a tau aggregation inhibitor in the L66 mouse model.
There are numerous other known pharmacological activities of MT. Most of these would require brain concentrations of MT well in excess of those that could be achieved in experimental models in vivo, let alone clinically (reviewed by Schirmer et al., 2011 and Oz et al., 2013). The only non-tau activities of MTC reported at the brain concentrations that we have identified are enhancement of mitochondrial β-oxidation (0.3 μmol/l; Visarius et al., 1997) and inhibition of monoamine oxidase A (0.16 μmol/l; Ramsay et al., 2007). It is conceivable that these activities might contribute indirectly to both behavioural benefit and reduction in load of tau aggregation pathology in the tauopathy models at the doses that we have examined. However, effects in WT animals would have been expected if such mechanisms were operative, and they would not explain the dependence on expression of transgenic tau for the effects that we have demonstrated.
In summary, we have examined the effect of MT, administered in oxidized (MTC) or reduced (LMTX) forms, in two distinct transgenic mice that model different aspects of the AD and frontotemporal lobar degeneration tauopathies, namely impairment in spatial learning (L1) and motor learning (L66), respectively. The comparisons between MTC and LMTX have been carried out at comparable doses in the same transgenic animal lines, at the same ages, using the same behavioural protocols. LMTX appears to have a superior pharmacological profile compared with MTC, on the basis of a similar efficacy at a quarter of the dose of MT in L1. However, detailed examination of the relationship between the brain concentration of MT and the behavioural effect in L66 mice demonstrates that MT produces the same effect at the same brain concentration whether dosed as LMTX or MTC. The apparent differences in potency are therefore more likely to be explained by differences in absorption, metabolism and distribution. We have evidence that LMTX produced four-fold higher concentrations of MT in mice brains at similar doses (Baddeley et al., 2015). The behavioural and pathological effects that we have demonstrated occur at brain concentrations that are consistent with the concentrations required for tau aggregation inhibitor activity in vitro. These concentrations overlap the estimated steady state concentrations achieved in humans receiving the minimum clinically effective dose of MTC in a phase 2 trial of MTC (Baddeley et al., 2015). We conclude that the primary action of MT responsible for producing both clinical and imaging benefits in humans, as well as behavioural and pathological benefits in transgenic mouse models of tauopathy, is its property of inhibiting tau aggregation.
Acknowledgements
The authors acknowledge the contributions of Bettina Seelhorst (histological analysis), Anna Thoma (animal care), Marlene Arthur (animal dosing) and Pierre-Henri Moreau (experimental discussions). This work was supported by TauRx Therapeutics Ltd., Singapore.
Conflicts of interest
C.R.H. (Chief Scientific Officer), J.M.D.S. (Head of Technical) and C.M.W. (Executive Chairman) declare that they are officers in TauRx Therapeutics Ltd. For the remaining authors there are no conflicts of interest.
Footnotes
Valeria Melis, Mandy Magbagbeolu, Franz Theuring and Gernot Riedel contributed equally to the research.
References
- Alzheimer A. (1907). Über eine eigenartige Erkrankung der Hirnrinde [article in German]. Allg Z Psych Psych-gerich Med 64:146–148. [Google Scholar]
- Baddeley TC, McCaffrey J, Storey JM, Cheung JK, Melis V, Horsley D, et al. (2015). Complex disposition of methylthioninium redox forms: partial dissociation of cognitive and hematological activity. J Pharmacol Exp Ther 352:110–118. [DOI] [PubMed] [Google Scholar]
- Braak H, Braak E. (1991). Neuropathological staging of Alzheimer-related changes. Acta Neuropathol 82:239–259. [DOI] [PubMed] [Google Scholar]
- Clavaguera F, Bolmont T, Crowther RA, Abramowski D, Frank S, Probst A, et al. (2009). Transmission and spreading of tauopathy in transgenic mouse brain. Nat Cell Biol 11:909–913. [DOI] [PMC free article] [PubMed] [Google Scholar]
- Congdon EE, Wu JW, Myeku N, Figueroa YH, Herman M, Marinec PS, et al. (2012). Methylthioninium chloride (methylene blue) induces autophagy and attenuates tauopathy in vitro and in vivo.. Autophagy 8:609–622. [DOI] [PMC free article] [PubMed] [Google Scholar]
- Deiana S, Harrington CR, Wischik CM, Riedel G. (2009). Methylthioninium chloride reverses cognitive deficits induced by scopolamine: comparison with rivastigmine. Psychopharmacology (Berl) 202:53–65. [DOI] [PubMed] [Google Scholar]
- Duyckaerts C. (2011). Tau pathology in children and young adults: can you still be unconditionally baptist? Acta Neuropathol 121:145–147. [DOI] [PubMed] [Google Scholar]
- Franklin KBJ, Paxinos G. (2008). The mouse brain in stereotaxic coordinates Compact, 3rd ed. New York: Academic Press. [Google Scholar]
- Frost B, Jacks RL, Diamond MI. (2009). Propagation of tau misfolding from the outside to the inside of a cell. J Biol Chem 284:12845–12852. [DOI] [PMC free article] [PubMed] [Google Scholar]
- Goedert M, Spillantini MG, Cairns NJ, Crowther RA. (1992). Tau proteins of Alzheimer paired helical filaments: abnormal phosphorylation of all six brain isoforms. Neuron 8:159–168. [DOI] [PubMed] [Google Scholar]
- Harrington CR, Mukaetova-Ladinska EB, Hills R, Edwards PC, Montejo de Garcini E, Novak M, Wischik CM. (1991). Measurement of distinct immunochemical presentations of tau protein in Alzheimer disease. Proc Natl Acad Sci USA 88:5842–5846. [DOI] [PMC free article] [PubMed] [Google Scholar]
- Harrington CR, Storey JMD, Clunas S, Harrington KA, Horsley D, Ishaq A, et al. (2015). Cellular models of aggregation-dependent template-directed proteolysis to characterize tau aggregation inhibitors for treatment of Alzheimer’s disease. DOI: 10.1074/jbc.M114.616029. [Epub ahead of print]. [DOI] [PMC free article] [PubMed] [Google Scholar]
- Hosokawa M, Arai T, Masuda-Suzukake M, Nonaka T, Yamashita M, Akiyama H, Hasegawa M. (2012). Methylene blue reduced abnormal tau accumulation in P301L tau transgenic mice. PLOS ONE 7:e52389. [DOI] [PMC free article] [PubMed] [Google Scholar]
- Jakes R, Novak M, Davison M, Wischik CM. (1991). Identification of 3- and 4-repeat tau isoforms within the PHF in Alzheimer’s disease. EMBO J 10:2725–2729. [DOI] [PMC free article] [PubMed] [Google Scholar]
- May JM, Qu ZC, Cobb CE. (2004). Reduction and uptake of methylene blue by human erythrocytes. Am J Physiol Cell Physiol 286:C1390–C1398. [DOI] [PubMed] [Google Scholar]
- Medina DX, Caccamo A, Oddo S. (2011). Methylene blue reduces Aβ levels and rescues early cognitive deficit by increasing proteasome activity. Brain Pathol 21:140–149. [DOI] [PMC free article] [PubMed] [Google Scholar]
- Melis V, Zabke C, Stamer K, Magbagbeolu M, Schwab K, Marschall P, et al. (2015). Different pathways of molecular pathophysiology underlie cognitive and motor tauopathy phenotypes in transgenic models for Alzheimer’s disease and frontotemporal lobar degeneration. Cell Mol Life Sci [Epub ahead of print]. doi: 10.1007/s00018-014-1804-z. [DOI] [PMC free article] [PubMed] [Google Scholar]
- Mukaetova-Ladinska EB, Garcia-Siera F, Hurt J, Gertz HJ, Xuereb JH, Hills R, et al. (2000). Staging of cytoskeletal and beta-amyloid changes in human isocortex reveals biphasic synaptic protein response during progression of Alzheimer’s disease. Am J Pathol 157:623–636. [DOI] [PMC free article] [PubMed] [Google Scholar]
- Novak M, Kabat J, Wischik CM. (1993). Molecular characterization of the minimal protease resistant tau unit of the Alzheimer’s disease paired helical filament. EMBO J 12:365–370. [DOI] [PMC free article] [PubMed] [Google Scholar]
- Ohm TG, Müller H, Braak H, Bohl J. (1995). Close-meshed prevalence rates of different stages as a tool to uncover the rate of Alzheimer’s disease-related neurofibrillary changes. Neuroscience 64:209–217. [DOI] [PubMed] [Google Scholar]
- O’Leary JC, 3rd, Li Q, Marinec P, Blair LJ, Congdon EE, Johnson AG, et al. (2010). Phenothiazine-mediated rescue of cognition in tau transgenic mice requires neuroprotection and reduced soluble tau burden. Mol Neurodegener 5:45. [DOI] [PMC free article] [PubMed] [Google Scholar]
- Oz M, Lorke DE, Yang KHS, Petroianu G. (2013). On the interaction of β-amyloid peptides and α7-nicotinic acetylcholine receptors in Alzheimer’s disease. Curr Alzheimer Res 10:618–630. [DOI] [PubMed] [Google Scholar]
- Peter C, Hongwan D, Küpfer A, Lauterburg BH. (2000). Pharmacokinetics and organ distribution of intravenous and oral methylene blue. Eur J Clin Pharmacol 56:247–250. [DOI] [PubMed] [Google Scholar]
- Ramsay RR, Dunford C, Gillman PK. (2007). Methylene blue and serotonin toxicity: inhibition of monoamine oxidase A (MAO A) confirms a theoretical prediction. Br J Pharmacol 152:946–951. [DOI] [PMC free article] [PubMed] [Google Scholar]
- Ramsden M, Kotilinek L, Forster C, Paulson J, McGowan E, SantaCruz K, et al. (2005). Age-dependent neurofibrillary tangle formation, neuron loss, and memory impairment in a mouse model of human tauopathy (P301L). J Neurosci 25:10637–10647. [DOI] [PMC free article] [PubMed] [Google Scholar]
- R Development Core Team (2004). R: a language and environment for statistical computing. Vienna, Austria: R Foundation for Statistical Computing; Available at: http://www.r-project.org [Accessed 20 February 2015]. [Google Scholar]
- Schirmer RH, Adler H, Pickhardt M, Mandelkow E. (2011). "Lest we forget you – methylene blue...". Neurobiol Aging 32:2325.e7–16. [DOI] [PubMed] [Google Scholar]
- Spires-Jones TL, Friedman T, Pitstick R, Polydoro M, Roe A, Carlson GA, Hyman BT. (2014). Methylene blue does not reverse existing neurofibrillary tangle pathology in the rTg4510 mouse model of tauopathy. Neurosci Lett 562:63–68. [DOI] [PMC free article] [PubMed] [Google Scholar]
- Stack C, Jainuddin S, Elipenahli C, Gerges M, Starkova N, Starkov AA, et al. (2014). Methylene blue upregulates Nrf2/ARE genes and prevents tau-related neurotoxicity. Hum Mol Genet 23:3716–3732. [DOI] [PMC free article] [PubMed] [Google Scholar]
- Traykov L, Raoux N, Latour F, Gallo L, Hanon O, Baudic S, et al. (2007). Executive functions deficit in mild cognitive impairment. Cogn Behav Neurol 20:219–224. [DOI] [PubMed] [Google Scholar]
- Visarius TM, Stucki JW, Lauterburg BH. (1997). Stimulation of respiration by methylene blue in rat liver mitochondria. FEBS Lett 412:157–160. [DOI] [PubMed] [Google Scholar]
- Walker LC, Diamond MI, Duff KE, Hyman BT. (2013). Mechanisms of protein seeding in neurodegenerative diseases. JAMA Neurol 70:304–310. [DOI] [PMC free article] [PubMed] [Google Scholar]
- Weiler M, Fukuda A, Massabki LH, Lopes TM, Franco AR, Damasceno BP, et al. (2014). Default mode, executive function, and language functional connectivity networks are compromised in mild Alzheimer’s disease. Curr Alzheimer Res 11:274–282. [DOI] [PubMed] [Google Scholar]
- Wischik CM, Novak M, Thøgersen HC, Edwards PC, Runswick MJ, Jakes R, et al. (1988). Isolation of a fragment of tau derived from the core of the paired helical filament of Alzheimer disease. Proc Natl Acad Sci USA 85:4506–4510. [DOI] [PMC free article] [PubMed] [Google Scholar]
- Wischik CM, Edwards PC, Lai RYK, Roth M, Harrington CR. (1996). Selective inhibition of Alzheimer disease-like tau aggregation by phenothiazines. Proc Natl Acad Sci USA 93:11213–11218. [DOI] [PMC free article] [PubMed] [Google Scholar]
- Wischik CM, Harrington CR, Storey JMD. (2014). Tau-aggregation inhibitor therapy for Alzheimer’s disease. Biochem Pharmacol 88:529–539. [DOI] [PubMed] [Google Scholar]
- Wischik CM, Staff R, Wischik DJ, Bentham P, Murray A, Storey JMD, et al. (2015). Tau aggregation inhibitor therapy: an exploratory Phase 2 study in mild or moderate Alzheimer’s disease. J Alzheimer’s Dis 44:705–720. [DOI] [PubMed] [Google Scholar]


