Abstract
Introduction
Prenatal ethanol exposure compromises fetal growth by impairing placentation. Invasive trophoblastic cells, which mediate placentation, express the insulin-IGF regulated gene, aspartyl-asparaginyl β-hydroxylase (ASPH), which has a critical role in cell motility and invasion. The aims of this study were to characterize effects of ethanol on trophoblastic cell motility, and assess ethanol dose -dependent impairments in placentation and fetal development.
Methods
Pregnant Long Evans dams were fed with isocaloric liquid diets containing 0%, 8%, 18% or 37% ethanol (caloric content) from gestation day (GD) 6 to GD18. Fetal development, placental morphology, density of invasive trophoblasts at the mesometrial triangle, as well as placental and mesometrial ASPH and Notch-1 protein expression were evaluated. Directional motility of control and ethanol-exposed HTR-8/SVneo cells was assessed by ATP Luminescence-Based assay.
Results
Severity of fetal growth impairment correlated with increasing doses of ethanol. Ethanol exposure produced dose-dependent alterations in branching morphogenesis at the labyrinthine zone, and inhibited physiological transformation of maternal arteries. ASPH and Notch-1 protein expression levels were reduced, corresponding with impairments in placentation.
Discussion
Prenatal ethanol exposure compromises fetal growth and placentation in a dose-responsive manner. Ethanol’s adverse effects on placental development are mediated by: 1) altered branching morphogenesis in labyrinthine zone; 2) suppression of invasive trophoblastic precursor cells; and 3) inhibition of trophoblastic cell adhesion and motility, corresponding with reduced ASPH and Notch-1 protein expression.
Keywords: Fetal alcohol spectrum disorders, placental morphology, placentation, fetal growth, trophoblast, aspartyl-asparaginyl β-hydroxylase
INTRODUCTION
Fetal alcohol syndrome (FAS) is the leading preventable cause of birth defects and developmental disorders in the United States [1]. The severity of alcohol-induced physical defects, and cognitive and behavioral disabilities varies by the timing, dose and duration of the alcohol exposure, nutritional status, genetic polymorphisms, maternal characteristics (gravity, parity, body mass index), and additional exposures (smoking/drugs); collectively, the phenotype is termed “Fetal Alcohol Spectrum Disorders” (FASD) [2–5].
Intrauterine growth restriction (IUGR) is a key feature of FASD. Previously, we showed that prenatal ethanol exposure impairs fetal growth and placentation [6]; placentation is crucial for establishing the maternal-fetal interface needed for nutrient delivery and waste removal. A critical step in establishing the maternal-fetal interface is that invasive trophoblasts must invade maternal spiral arteries, and thereby disrupt the media and replace the endothelial cells [7, 8]. This process transforms the normally small muscular arteries into distended, flaccid, high-flow, low-resistance vessels, enabling continuous nutrient supply through placenta to the fetus. Prenatal ethanol exposure disrupts this process [6]. Mechanistically, ethanol inhibits insulin/insulin-like growth factor (IGF) signaling and expression of downstream target genes, including aspartyl-asparaginyl β-hydroxylase (ASPH) [6, 9].
ASPH is an insulin/IGF responsive gene whose hydroxylase activity regulates cell motility and invasiveness via activation and enhancement of Notch signaling [10–12]. ASPH is a positive regulator of trophoblastic cell motility. Previous in vitro and in vivo experiments demonstrated that siRNA inhibition of ASPH expression inhibits trophoblastic cell motility and alters signaling through Notch-1 leading to decreased expression levels of Notch’s downstream target gene Hairy and Enhancer of Split 1 (Hes-1) [13]. The present study was designed to examine ethanol dose-effects on trophoblastic cell motility in relation to ASPH expression and fetal development.
MATERIALS AND METHODS
In vivo model
Pregnant Long Evans rats were fed isocaloric liquid diets (BioServ, Frenchtown, NJ) containing 0%, 8%, 18%, or 37% ethanol by caloric content [14]. The liquid diets were initiated on gestation day (GD) 6 and ended on GD18. After mating, onset of pregnancy (gestation day 0; G0) was confirmed by both the presence of sperm and characteristic metestrous stage cellular changes in the vaginal smears [15]. The dams were weighed on GD 0 and weekly to monitor weight gain. Fetuses, placentas, and maternal serum were harvested on GD 18. Placental weights and fetal body weights and crown-rump lengths were measured. GD was confirmed according to fetal developmental stage [16]. Placental tissue with underlying mesometrial triangle (implantation site) was weighed and either immersion fixed whole in Histochoice, and embedded in paraffin, or divided to separately snap freeze placenta and mesometrial triangle [6]. Adjacent histological sections were stained with hematoxylin and eosin (H&E) to study structural alterations associated with ethanol exposure, and immunohistochemical staining to assess shifts in invasive trophoblast cell populations. Frozen tissue was stored at −80°C. The dams’ blood alcohol levels were measured using a GM7 analyzer (Analox Instruments Ltd., Lunenburg, MA) according to the manufacturer’s protocol. The Institutional Animal Welfare Committee at Rhode Island Hospital approved this study.
Immunohistochemistry
Histological sections of placenta with underlying mesometrial triangle (5 µm thick) were immunostained with monoclonal antibody to cytokeratin (CK) to detect invasive trophoblastic cells at the implantation site [13, 17]. Three samples per litter were included in the evaluation (N=21, 0%; N=15, 8%; N=18, 18%; N=27, 37%). Deparaffinized, rehydrated tissue sections were incubated in preheated EnVision™ FLEX Target Retrieval Solution (high pH=9.0) for 20 minutes at 95–100°C. Slides were the n rinsed in EnVision™ FLEX wash buffer and treated with 3% hydrogen peroxide for 5 minutes to quench the endogenous peroxidase activity. The slides were incubated for 20 minutes at room temperature with a 1:50 dilution of monoclonal cytokeratin antibody (DAKO # M0821, clone MNF-116). Antibody binding was detected with EnVision™ FLEX/HRP reagent (dextran backbone coupled to a large number of HRP molecules) and diaminobenzidine tetrahydrochloride (DAB) as the chromogen. The sections were counterstained lightly with hematoxylin and preserved under coverglass. All immunohistochemical staining reactions were performed using the Dako Autostainer (Dako, Carpenteria, CA).
Stereology
We quantified the trophoblastic giant cells in H&E stained sections and invasive trophoblastic cells in CK-stained sections using unbiased stereology [13]. Numerical density calculations were performed with the aid of an Olympus BX60 light microscope (Olympus America Inc., Center Valley, PA) with attached MS-2000 XYZ Inverted Stage (Applied Scientific Instrumentation, Eugene, OR), and Stereologer software (Stereology Resource Center, Inc., Chester, MD). The anatomical area of interest was the entire junctional zone for trophoblastic giant cell quantification, whereas, the entire mesometrial triangle extending up to the placental junctional zone was selected as the anatomical area of interest for quantifying CK-positive invasive trophoblasts. The upper boundary of the mesometrial triangle was delineated by the diffuse CK-immunoreactivity of junctional zone. Sections showing linear maternal spiral arteries with maternal channel continuation were selected for the evaluation to maintain uniformity. Unbiased counting frames were applied under software control. Cells of interest were counted at 400× magnification using optical dissector method and normalized to volume based on the Cavalieri point grid method [13].
Enzyme-linked immunosorbant assay (ELISA)
Direct binding enzyme-linked immunosorbant assay was used to measure ASPH and Notch-1 immunoreactivity. Control and ethanol-exposed placental and mesometrial triangle tissues were homogenized in RIPA buffer containing protease and phosphatase inhibitors using a TissueLyser II apparatus (Qiagen Inc., Valencia, CA) [18, 19]. Protein samples were prepared as described above. Samples containing 50 ng of protein in 100 µl Tris-buffered saline, pH 7.4 (TBS) were adsorbed to the bottom flat surfaces of opaque white Maxisorp polystyrene 96-well plates (Nunc ThermoScientific, Rochester, NY) overnight at 4°C. Non-specific binding sites were blocked by a 3-hour room temperature incubation with 300 µl TBS + 0.05% Tween 20 + 3% BSA. Samples were then incubated with either A85G6 monoclonal antibody (mAb) to ASPH or Notch-1 mAb (0.5–1.0 µg/ml) for 1 h at 37°C. Antibody binding was detect ed with HRP-conjugated secondary antibody (Pierce, Rockford, IL) and the Amplex UltraRed soluble fluorophore (Molecular Probes, Eugene, OR) [19]. Immunoreactivity was measured (Ex 530/Em 590) in a SpectraMax M5 microplate reader (Molecular Devices Corp., Sunnyvale, CA). The results were normalized to protein content in each well as quantified using the NanoOrange® Protein Quantitation Kit (Molecular Probes, Eugene, OR). Negative control reactions included omission of protein sample, or the primary antibody, secondary antibody, or both antibodies. Between steps, the wells were washed 3 times with TBST using a Nunc Immunowash apparatus (Nunc, Rochester, NY).
In vitro model
HTR-8/SVneo cells are immortalized, first trimester, human trophoblast cells that have properties of invasive extravillous cytotrophoblasts [20]. Cultures were maintained in Roswell Park Memorial Institute (RPMI) 1640 media (Lonza Walkersville, Inc., Walkersville, MD) supplemented with 10% fetal bovine serum (FBS) and 2.1 mM L-glutamine at 37°C in a 5% CO2 incubator. After determining the optimal ethanol dose based on ethanol dose-response studies that utilized cell viability and toxicity assays (data not shown), cells were exposed to 0 mM or 128 mM vaporized ethanol for 48 hours in sealed humidified chambers [21] and then harvested for motility assays and Western blot analysis.
Directional Motility Assay
Directional motility was measured using the ATP Luminescence-Based Motility-Invasion (ALMI) assay [22]. Briefly, blind-well chambers (Neuro Probe, Gaithersburg, MD) partitioned by polycarbonate filters with 12 µm pore diameter were used for the experiments. Culture medium containing 1% FBS and 0.1 µg/ml IGF2 as the trophic factor was placed in the lower chambers and 100,000 viable (Trypan blue excluded) control and ethanol-exposed cells, suspended in 100 µL serum-free medium, were seeded into the upper chamber. Cell migration was allowed to proceed for 30 minutes at 37°C in a CO2 incubator. Cells harvested from the upper chamber (sessile), undersurface of the membrane (motile, adherent), and lower chamber (motile non-adherent) were quantified using ATPlite reagent, and luminescence was measured in a TopCount machine (Perkin-Elmer, Waltham, MA). The percentages of sessile (non-motile), motile adherent, motile non-adherent, and total motile (adherent + non-adherent) cells were calculated, and statistical analyses were performed using results from 8 replicate assays.
Western blot analysis
Western blot analysis was used to measure ASPH immunoreactivity. Control and ethanol-exposed HTR8 cells were homogenized in radio-immunoprecipitation assay (RIPA) buffer (50 mM Tris-HCl, pH 7.5, 1% NP-40, 0.25% Na-deoxycholate, 150 mM NaCl, 1 mM EDTA, 2 mM EGTA) containing protease (1 mM PMSF, 0.1 mM TPCK, 1µg/ml pepstatin A, 0.5 µg/ml leupeptin, 1 mM NaF, 1 mM Na4P2O7) and phosphatase (2 mM Na3VO4) inhibitors. Supernatant fractions obtained after centrifuging the samples at 14,000 × g for 10 minutes at 4°C were used in Western blot assays as described [23]. Protein concentrations were determined using the bicinchoninic acid (BCA) assay (Pierce, Rockford, IL). The blots were probed with the A85G6 monoclonal antibody (mAb) to ASPH (0.5–1 µg/ml) [6, 23] and immunoreactivity was detected using horseradish peroxidase (HRP)-conjugated secondary antibody and SuperSignal enhanced chemiluminescence reagents (ECL, Pierce Chemical Company, Rockford, IL) as described. Western blot signals were quantified by digital imaging with the Kodak Digital Science Imaging Station (NEN Life Sciences, Boston, MA). Sample loading was assessed by re-probing stripped blots with polyclonal anti-p85 (subunit of PI3 kinase) [10].
Sources of reagents
Monoclonal antibody to cytokeratin (CK clone MNF-116) was purchased from Dako (Carpenteria, CA). Polyclonal antibody to p85 was purchased from Millipore (Temecula, CA). The 85G6 ASPH monoclonal antibody was generated to human recombinant protein and purified over a Protein G column (Healthcare, Piscataway, NJ) [6, 23]. Monoclonal antibody to Notch-1 was purchased from Abcam Inc. (Cambridge, MA). Histochoice fixative was purchased from Amresco Corp. (Solon, OH). BCA reagents were purchased from the Pierce Chemical Company (Rockford, IL). ATPLite substrate was obtained from Perkin-Elmer Corp. (Waltham, MA). Polycarbonate filters used in directional motility assays were purchased from GE Osmonics Labstore (Minnetonka, MN). All other fine chemicals and reagents were purchased from Calbiochem-EMD Biosciences (La Jolla, CA), Pierce Biotechnology Inc. (Rockford, IL), or Sigma-Aldrich (St. Louis, MO).
Statistical analysis
Graphs depict means ± S.E.M.’s. Inter-group comparisons were made using Student t-test, one-way analysis of variance (ANOVA), or two-way ANOVA with the Dunnett multiple comparison post-hoc test. Data were analyzed and graphed using GraphPad Prism 5 software (GraphPad Software, Inc., La Jolla, CA). P<0.05 was regarded as statistically significant.
RESULTS
Prenatal ethanol exposure alters fetal growth in a dose-responsive manner
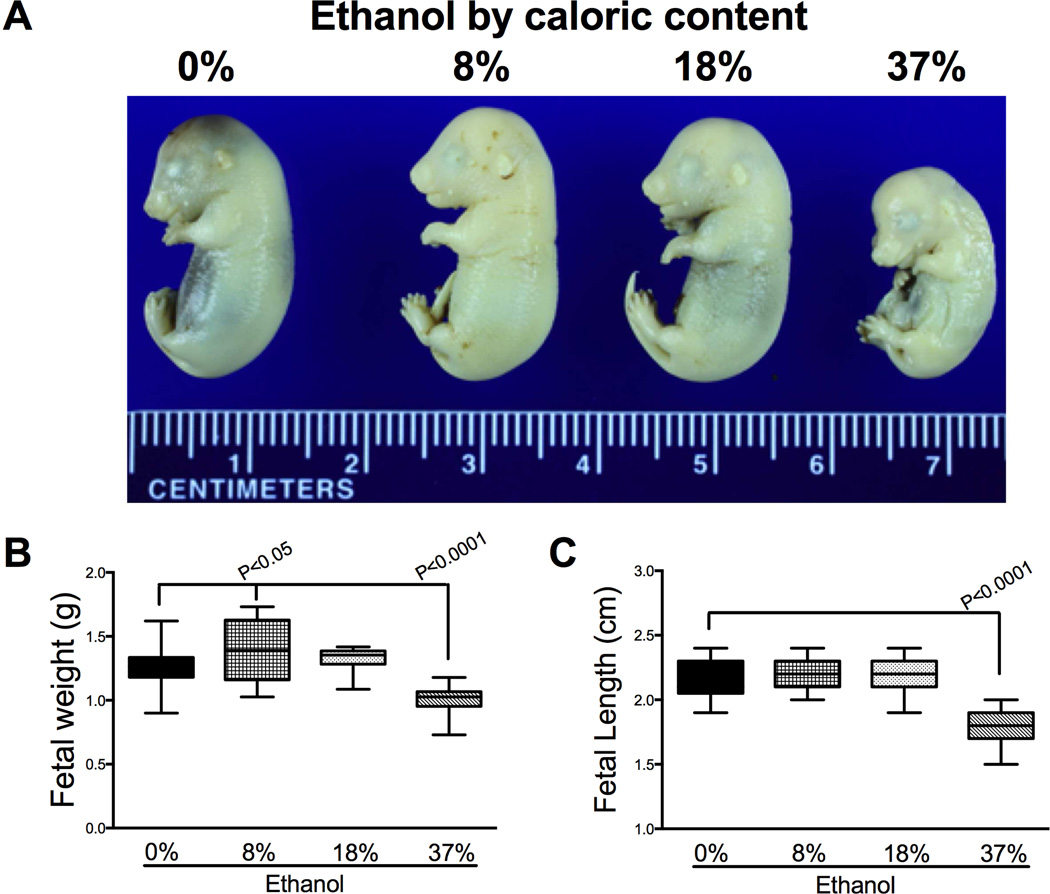
On GD18, we detected pregnancy loss in 5 of 10 (50%) dams in 8%, 3 of 9 (33%) dams in 18% and 5 of 14 (36%) dams in 37% ethanol exposure groups. There was no pregnancy loss in the control group. We harvested the placentas and fetuses of the remainder dams: 0% (control, N=7), 8% (N=5), 18% (N=6), or 37% (N=9) ethanol by caloric content. The information regarding weight gain and blood alcohol levels of dams (mean ± S.E.M.) and litter size is summarized in Table 1. The blood alcohol levels achieved in the 37% group (132 ± 7.1) were within the range documented in chronic alcoholics [24]. The range of blood alcohol levels documented in the other groups was similar to previous studies [25]. The dams exposed to high-dose (37%) ethanol demonstrated significantly reduced weight gain relative to other groups (Mean [95% CI]; 0%: 70.3 [60.4 – 80.3], 8%: 65.4 [61.6 – 69.2], 18%: 66.5 [62.6 – 70.4], 37%: 26.4 [23.3 – 29.5]; P<0.0001). The fetal body weight demonstrated an ethanol dose response with significant alterations at both ends of the dose spectrum. While the fetuses gained weight in low-dose ethanol group (mean ± S.E.M., 1.4 ± 0.08; P<0.05), high-dose ethanol exposure significantly reduced the fetal weight (1.01 ± 0.02; P<0.0001), whereas moderate-dose (18%) had no effect (1.3 ± 0.02) compared to controls (1.3 ± 0.02, Figs. 1A–1B). The fetal crown-rump length was significantly reduced in high-dose group compared to all other exposure groups (P<0.0001). We then determined the fetal-placental weight ratio as a measure of placental efficiency [26] (Fig. 1C). While low-dose ethanol exposure resulted in an upward trend, moderate-dose significantly increased the placental efficiency (P<0.0001), which was significantly reduced by high-dose ethanol exposure (P<0.0001).
Table 1.
Chronic gestational ethanol exposure model
| Ethanol dose | 0% | 8% | 18% | 37% |
|---|---|---|---|---|
| Group size (dams) | 7 | 5 | 6 | 9 |
| Dam weight gain (g) | 64 ± 5 | 58.2 ± 1.7 | 63.33 ± 4.3 | 26.4 ± 1.1 |
| Blood alcohol level (mg/dl) | 0 | 29 ± 5.7 | 84 ± 11.6 | 132 ± 7.1 |
| Litter size (Median, range) | 9 (5 – 14) | 2 (1 – 10) | 12 (4 – 13) | 7 (1 – 12) |
Figure 1.
Effects of gestational ethanol exposure on fetal growth. Pregnant dams were chronically fed with isocaloric liquid diets containing 0%, 8%, 18%, or 37% ethanol by caloric content. A) Pups were harvested on GD 18. Fetal body weights (B) and crown-rump lengths (C) were measured. Boxplots depict means (horizontal bars), 95% confidence intervals (box limits), and range (whiskers). Inter-group comparisons were made using one-way ANOVA with the Dunnett’s multiple comparison test.
Ethanol-altered placental and implantation site morphology
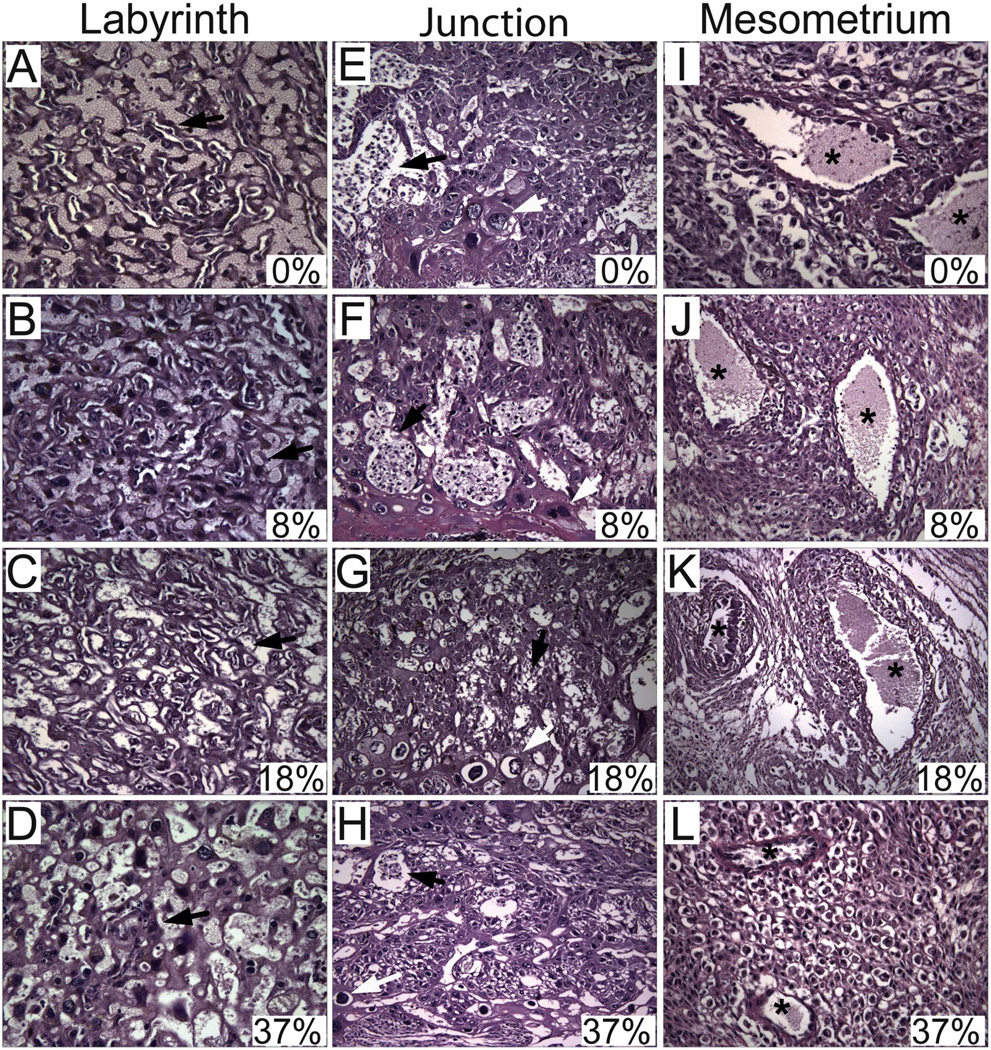
H&E stained sections of full thickness placentas with underlying mesometrial triangle were examined by light microscopy. We selected the placentation sites of 4–5 dams with comparable litter sizes for experimental groups of 0%, 18% and 37%, and chose the 2 dams with high litter sizes from 8% group in order to control for litter size effect. Four-to-six placentas per litter were analyzed to generate the data (N=21 in 0%, N=15 in 8%, N=24 in 18%, N=27 in 37%). The vascular channels within the labyrinthine region became disorganized with increasing ethanol doses (Figs. 2A–2D). In control and low-dose ethanol groups, large collections of glycogen cells were easily identified in the junctional zone (Figs. 2E–2F). Whereas, the glycogen cells were either not evident or they formed small clusters in moderate- and high-dose ethanol groups (Figs. 2G–2H). In addition, exposure to high-dose ethanol significantly reduced the trophoblastic giant cells (0.25 ± 0.05 (mean ± S.E.M.)) relative to other exposure groups (control 0.67 ± 0.08, low-dose 0.64 ± 0.05, moderate-dose 0.49 ± 0.06; P=0.0005). We then examined the maternal vessels at the mesometrial triangle to determine the degree of physiological transformation. In control and low-dose ethanol groups, the vasculature was diffusely transformed into ectatic vessels with no identifiable smooth muscle layer (Figs. 2I–2J). In moderate-dose group, the transformation was not uniform and smaller vessels lined with trophoblastic cells were evident (Fig. 2K). Whereas, in the high-dose group, the maternal vessels were uniformly small and they lacked signs of vascular transformation (Fig. 2L).
Figure 2.
Gestational ethanol exposure alters placental morphology and impairs placentation in a dose-responsive manner. Placentas with underlying mesometrial triangle were harvested on GD18 from ethanol-exposed dams. H&E stained sections depict labyrinth (A–D) [original magnification ×40] and junctional (E–H) [original magnification ×20] zones of placenta, and mesometrium (I–L) [original magnification ×40] exposed to 0%, 8%, 18% or 37% ethanol by caloric content.
Prenatal ethanol exposure reduces invasive trophoblasts at the implantation site
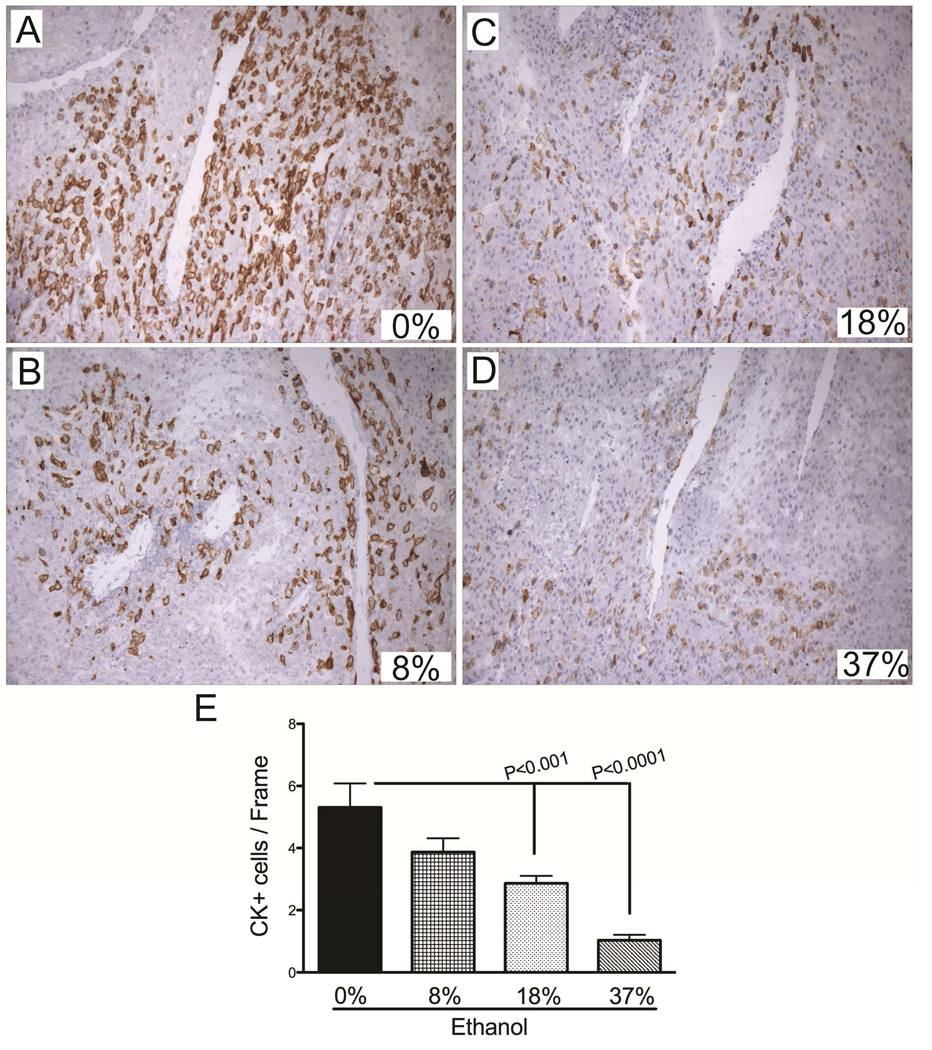
To determine the degree to which ethanol-dose contributes to impaired placentation, we quantified the number of invasive trophoblasts in control and ethanol-exposed mesometrial triangles. Serial sections of the placentas examined morphologically were immunostained with CK antibody and analyzed to generate the data. The CK-positive invasive trophoblasts were abundant in the control group (Mean [95% CI]; 5.3 [3.4 – 7.2]) and they concentrated around the vessels (Fig. 3A, 3E). With introduction of the ethanol into the diet, the number of invasive trophoblasts was reduced (3.9 [2.6 – 5.1], Fig. 3B) and the degree of reduction corresponded to increasing ethanol doses (18%: 2.9 [2.2 – 3.5]; 37%: 1.0 [0.5 – 1.6]; P=0.0005; Figs. 3C–3E). Furthermore, the interaction between the invasive trophoblasts and the vessels was altered by ethanol exposure (Figs. 3C–3D).
Figure 3.
Gestational ethanol exposure reduces invasive trophoblasts at the implantation site. A–D) Cytokeratin (CK) immunostained sections demonstrate the distribution of invasive trophoblasts at the mesometrium of dams exposed to 0%, 8%, 18%, or 37% of ethanol by caloric content. Invasive trophoblasts were quantified by stereology. Graph (E) depicts the mean ± S.E.M. corresponding to the numerical density of CK-positive cells in each group. Inter-group comparisons were made using one-way ANOVA with the Dunnett’s multiple comparison test.
Prenatal ethanol exposure reduces ASPH and Notch-1 protein levels in placentas and implantation sites
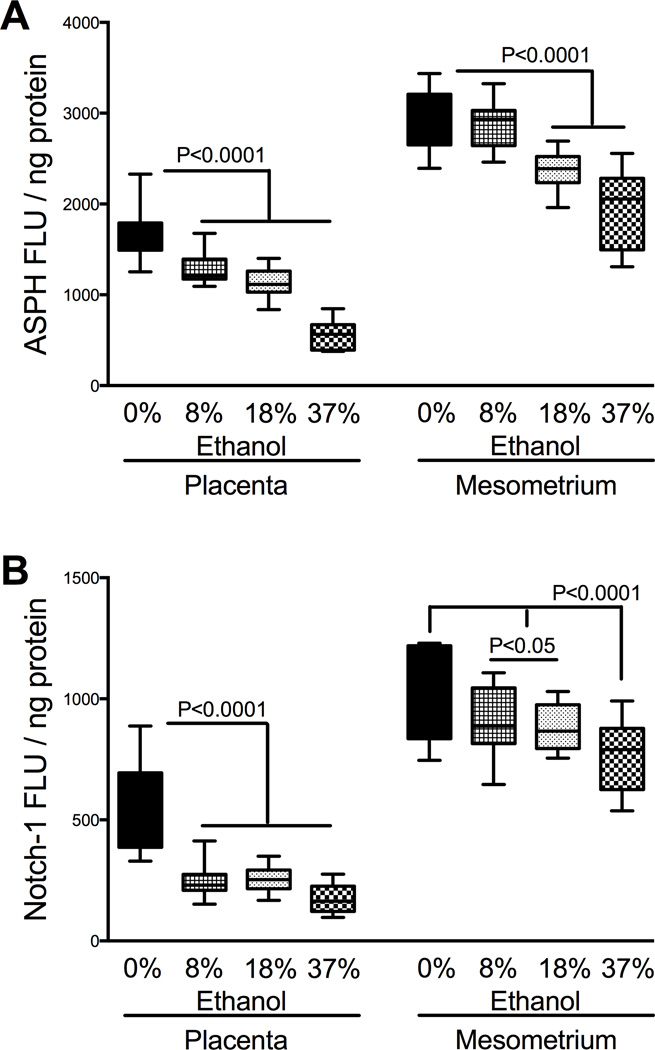
Previously, we demonstrated that ASPH is a positive regulator of trophoblastic cell motility, and its inhibition alters Notch signaling mechanisms [13]. Furthermore, higher ASPH, Notch-1, and Jagged-1 protein expression levels in mesometrial triangle relative to placenta reflected the tissue localization of invasive trophoblasts [6, 13]. Though Notch 2 receptor was shown to play an important role during mice placentation [27], our initial survey studies demonstrated that Notch-1 was the most abundant isoform in GD16-18 rat placentas, closely followed by Notch-2. To determine the effects of ethanol-dose on spatial ASPH and Notch-1 levels, we utilized placental and mesometrial triangle tissue homogenates separately. Similar to ASPH, the protein expression levels of Notch-1 were significantly higher in the mesometrial triangle than in placenta (P<0.0001, Figs. 4A–4B). Moreover, the expression levels of ASPH were significantly higher than Notch-1 in both tissue compartments (P<0.0001). Additionally, there was significant interaction between ASPH and Notch-1 expression in placenta (F=26.32; P<0.0001) and mesometrial triangle (F=13.31; P<0.0001).
Figure 4.
Prenatal ethanol exposure reduces placental and mesometrial ASPH and Notch protein expression. Expression levels of ASPH (A) and Notch-1 (B) were measured in placental and mesometrial tissue homogenates using ELISA. Results were normalized to protein content. Boxplots depict means (horizontal bars), 95% confidence intervals (box limits), and range (whiskers). Inter-group comparisons were made using one-way ANOVA with the Dunnett’s multiple comparison test.
Exposure to ethanol inhibits trophoblastic cell motility and adhesion
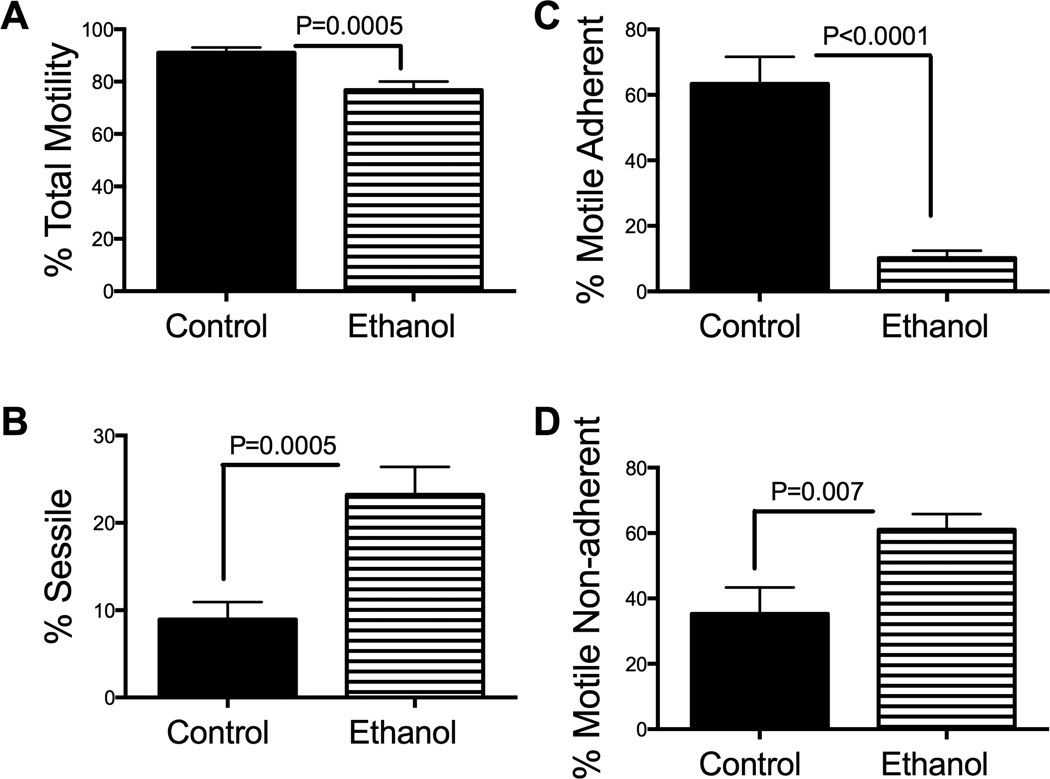
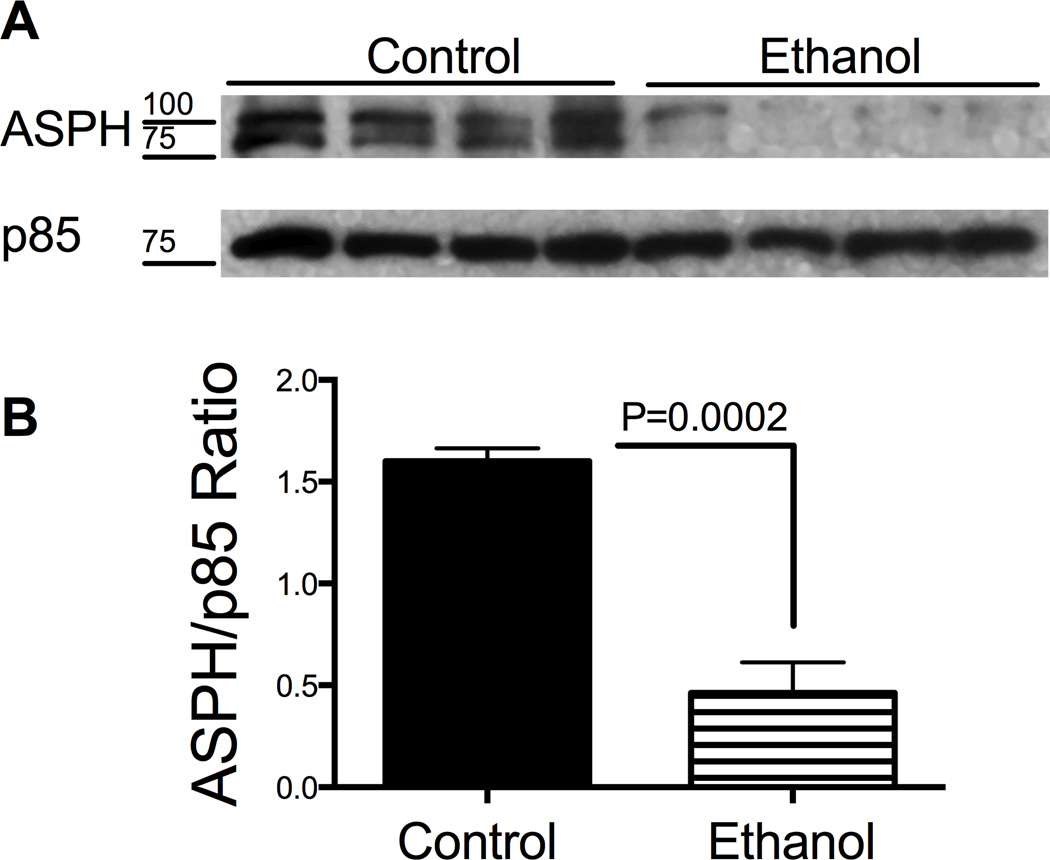
Exposure to ethanol significantly impaired the directional motility of HTR-8/SVneo cells (Mean ± S.E.M.; control: 91.1 ± 2.0; ethanol: 76.8 ± 3.2; P=0.0005; Fig. 5A) resulting in increased percentages of sessile cells in the ethanol group (23.2 ± 3.2) relative to control (8.9 ± 2.0; P=0.0005; Fig. 5B). The major effect of ethanol was to reduce the mean percentages of motile adherent cells (10.2 ± 2.3) and increase the proportion of motile non-adherent cells (61 ± 4.8) relative to control (63.3 ± 8.3, P<0.0001; and 35.3 ± 8, P=0.007, respectively) (Figs. 5C and 5D). This suggests ethanol impairs cell adhesion in trophoblastic cells. Since ASPH is a positive regulator of trophoblastic cell motility, we measured the effects of ethanol on its protein expression by Western blot analysis. The A85G6 mAb detected the full length (~86 kD) and post-translationally modified/phosphorylated (~110 kD) ASPH protein [9] (Fig. 6A, upper panel). Ethanol exposure reduced the ASPH protein levels in HTR-8/SVneo cells. Equal protein loading was confirmed by re-probing the stripped membrane with antibodies to the p85 subunit of PI3 kinase (Fig. 6A, lower panel). Quantification of the digital signals demonstrated that ethanol significantly reduced the ASPH/p85 ratio relative to control (P=0.0002; Fig. 6B).
Figure 5.
Ethanol impairs directional motility and adhesion in HTR-8/SVneo cells. HTR-8/SVneo cells were exposed to 0 mM or 128 mM ethanol for 48 hours in sealed humidified chambers. Directional motility was measured using the ATP luminescence-based motility-invasion assay. The percentages of (B) sessile, (C) motile adherent, (D) motile non-adherent, and (A) total motile (adherent + non-adherent) cells were calculated, and statistical analyses were performed using results from eight replicate assays. Graphs depict the mean ± S.E.M. levels. Inter-group comparisons were made using Student t-tests.
Figure 6.
Ethanol inhibits aspartyl-asparaginyl β-hydroxylase (ASPH) expression in HTR-8/SVneo cells. A) ASPH protein expression was measured by Western blot analysis in HTR-8/SVneo cells that were exposed to 0 mM or 128 mM ethanol for 48 hours in sealed humidified chambers (upper panel). The blots were stripped and re-probed with p85 subunit of PI3 kinase as a sample loading control (lower panel). B) Immunoreactivity was quantified by digital imaging and the mean ± S.E.M. ASPH/p85 ratios are depicted graphically. Inter-group comparisons were made using Student t-tests.
DISCUSSION
This study demonstrates the inhibitory effects of ethanol on trophoblastic cell motility and adhesion, and dose-dependent effect on fetal growth and placentation. The severity of clinical symptoms of FASD has been attributed to variations in timing, duration and dose of maternal alcohol consumption, nutritional status, genetic polymorphisms, maternal characteristics (gravity, parity, body mass index), and additional exposures (smoking/drugs) [2–5, 28]. Herein, we demonstrate increased pregnancy loss in all ethanol doses suggesting that there is no safe level of alcohol consumption during pregnancy. Fetal body weight had bimodal distribution in response to prenatal alcohol exposure. While high-dose ethanol inhibited fetal growth, low-dose ethanol had the opposite effect. Considering that the fetal length was not altered by low-dose ethanol, the weight gain could represent increased body mass index. The weight gain, at least in part, could be explained by the increased placental efficiency noted in low- and moderate-dose ethanol exposure groups. However, we acknowledge that reduced litter size is an important confounder in low-dose group. It is well known that both extremes of the birth weight increase the risk of obesity and metabolic syndrome in adulthood [29–31] [32] and as a result, adverse effects of prenatal ethanol exposure may not be limited to developmental problems. For example, prenatal alcohol exposure could alter fetal programming and induce epigenetic effect, but information along these lines is lacking. Furthermore, evidence suggests that the manner of ethanol exposure impacts placental development and function since repeated binge exposures adversely affect maternal uterine vasculature [33], whereas moderate exposures impair agonist-induced uterine artery vasodilation [34]. Further studies are needed to determine if maternal binge drinking increases susceptibility or alters duration of alcohol-induced vasoconstriction in placental bed vessels.
Fetal growth depends on placental supply of nutrients. Placental size, morphology and blood flow are crucial determinants of placental nutrient transfer [35]. Herein, we demonstrate altered branching morphogenesis in the labyrinthine zone, reduced glycogen cell and trophoblastic giant cell populations in the junctional zone, and impaired maternal vascular transformation at the implantation site of ethanol-exposed placentas. The degree of morphological alterations was positively correlated with increasing ethanol dose. The labyrinthine zone proved to be the region most sensitive to ethanol. Even with low-dose ethanol, vascular channels within the labyrinth exhibited mild disorganization. Alteration in branching morphogenesis became more conspicuous with increasing ethanol dose, and at the highest dose, the vascular channels were devoid of organization. Since maternal-fetal exchange occurs within the labyrinthine region [36], this finding suggests the these critical exchanges were compromised at all ethanol doses. Morphological alterations involving the junctional zone and implantation site occurred only with moderate or high-dose ethanol exposures. Glycogen and trophoblastic giant cells are both precursors of invasive trophoblasts that mediate maternal vascular transformation at the implantation site [37]. Previously, we demonstrated that gestational ethanol exposure reduces these cell populations in a gestational age specific manner [38]. The present study adds to our understanding by showing that ethanol’s adverse effects on precursor cells are dose dependent. Correspondingly, the invasive trophoblastic cell population was significantly reduced and vascular transformation was impaired in the moderate and high-dose ethanol groups.
Trophoblastic cell motility is required for implantation and placentation [39]. Previous studies showed that ASPH, under the control of insulin and insulin-like growth factors, mediates cell motility and invasion in various transformed cell types as well as trophoblasts, and functions by increasing Notch signaling [9–11, 13].
Corresponding to its role in cell motility, expression levels of ASPH are higher in invasive trophoblasts than in non-invasive villous trophoblasts [40]. This study demonstrates that ethanol-impaired trophoblastic cell motility and adhesion correlates with reduced ASPH protein expression in HTR-8/SVneo cells. Moreover, in vivo studies demonstrated that ethanol-associated reductions in invasive trophoblasts at the implantation site correlates with reduced levels of Asph and Notch-1 protein. Importantly, all levels of gestational ethanol exposure inhibited expression of Notch-1 and ASPH proteins in placenta. Conceivably, these proteins may have important roles in trophoblastic differentiation and placental vasculogenesis via cross-talk with other signaling pathways.
In conclusion, ethanol impairs rat placentation in a dose-dependent manner, and alters fetal growth via 3 interdependent mechanisms including: 1) reduced branching morphogenesis within the labyrinthine zone; 2) decreased population of precursor cells that give rise to invasive trophoblasts which are needed to transform maternal arteries; and 3) inhibition of trophoblastic cell motility/adhesion correlating with reductions in ASPH and Notch-1 protein expression. Fetal growth and maintenance of pregnancy have been tightly linked to placental development and function. Our findings implicate impaired placentation as an important factor contributing to fetal demise, fetal growth restriction, and stillbirth in FASD. Future studies would determine the degrees to which placentation impairments, fetal growth restriction, and stillbirth correlate with levels and gestational timing of maternal alcohol consumption in humans.
HIGHLIGHTS.
Prenatal ethanol exposure impairs placentation in a dose-responsive manner.
Severity of fetal growth impairment correlates with increasing doses of ethanol.
Ethanol alters branching morphogenesis in labyrinthine zone regardless of dose.
Ethanol inhibits trophoblastic cell adhesion and motility.
ACKNOWLEDGEMENTS
We are grateful to Terry Pasquariello for performing immunohistochemistry. This work was supported by National Institutes of Health grant K08AA-016783 to F.G. and K24-16126, AA-12908, AA-11347 to S.D.L.M.
Abbreviations
- ASPH
Aspartyl-asparaginyl β-hydroxylase
- GD
Gestation day
Footnotes
Publisher's Disclaimer: This is a PDF file of an unedited manuscript that has been accepted for publication. As a service to our customers we are providing this early version of the manuscript. The manuscript will undergo copyediting, typesetting, and review of the resulting proof before it is published in its final citable form. Please note that during the production process errors may be discovered which could affect the content, and all legal disclaimers that apply to the journal pertain.
REFERENCES
- 1.Bailey BA, Sokol RJ. Pregnancy and alcohol use: evidence and recommendations for prenatal care. Clin Obstet Gynecol. 2008;51(2):436–444. doi: 10.1097/GRF.0b013e31816fea3d. [DOI] [PubMed] [Google Scholar]
- 2.Barr HM, Streissguth AP. Identifying maternal self-reported alcohol use associated with fetal alcohol spectrum disorders. Alcohol Clin Exp Res. 2001;25(2):283–287. [PubMed] [Google Scholar]
- 3.Guerri C, Bazinet A, Riley EP. Foetal Alcohol Spectrum Disorders and alterations in brain and behaviour. Alcohol Alcohol. 2009;44(2):108–114. doi: 10.1093/alcalc/agn105. [DOI] [PMC free article] [PubMed] [Google Scholar]
- 4.Warren KR, Li TK. Genetic polymorphisms: impact on the risk of fetal alcohol spectrum disorders. Birth Defects Res A Clin Mol Teratol. 2005;73(4):195–203. doi: 10.1002/bdra.20125. [DOI] [PubMed] [Google Scholar]
- 5.May PA, Gossage JP. Maternal risk factors for fetal alcohol spectrum disorders: not as simple as it might seem. Alcohol Res Health. 2011;34(1):15–26. [PMC free article] [PubMed] [Google Scholar]
- 6.Gundogan F, Elwood G, Longato L, Tong M, Feijoo A, Carlson RI, et al. Impaired placentation in fetal alcohol syndrome. Placenta. 2008;29(2):148–157. doi: 10.1016/j.placenta.2007.10.002. [DOI] [PMC free article] [PubMed] [Google Scholar]
- 7.Pijnenborg RBJ, Robertson WB, Dixon G, Brosens I. The pattern of interstitial trophoblastic invasion of the myometrium in early human pregnancy. Placenta. 1981;2(4):303–316. doi: 10.1016/s0143-4004(81)80027-6. [DOI] [PubMed] [Google Scholar]
- 8.Dunk C, Petkovic L, Baczyk D, Rossant J, Winterhager E, Lye S. A novel in vitro model of trophoblast-mediated decidual blood vessel remodeling. Lab Invest. 2003;83(12):1821–1828. doi: 10.1097/01.lab.0000101730.69754.5a. [DOI] [PubMed] [Google Scholar]
- 9.Carter JJ, Tong M, Silbermann E, Lahousse SA, Ding FF, Longato L, et al. Ethanol impaired neuronal migration is associated with reduced aspartyl-asparaginyl-beta-hydroxylase expression. Acta Neuropathol. 2008;116(3):303–315. doi: 10.1007/s00401-008-0377-z. [DOI] [PMC free article] [PubMed] [Google Scholar]
- 10.Cantarini MC, de la Monte SM, Pang M, Tong M, D'Errico A, Trevisani F, et al. Aspartyl-asparagyl beta hydroxylase over-expression in human hepatoma is linked to activation of insulin-like growth factor and notch signaling mechanisms. Hepatology. 2006;44(2):446–457. doi: 10.1002/hep.21272. [DOI] [PubMed] [Google Scholar]
- 11.de la Monte SM, Tamaki S, Cantarini MC, Ince N, Wiedmann M, Carter JJ, et al. Aspartyl-(asparaginyl)-beta-hydroxylase regulates hepatocellular carcinoma invasiveness. J Hepatol. 2006;44(5):971–983. doi: 10.1016/j.jhep.2006.01.038. [DOI] [PubMed] [Google Scholar]
- 12.Lawton M, Tong M, Gundogan F, Wands JR, de la Monte SM. Aspartyl-(asparaginyl) beta-hydroxylase, hypoxia-inducible factor-alpha and Notch cross-talk in regulating neuronal motility. Oxidative medicine and cellular longevity. 2010;3(5):347–356. doi: 10.4161/oxim.3.5.13296. [DOI] [PMC free article] [PubMed] [Google Scholar]
- 13.Gundogan F, Bedoya A, Gilligan J, Lau E, Mark P, De Paepe ME, et al. siRNA inhibition of aspartyl-asparaginyl beta-hydroxylase expression impairs cell motility, Notch signaling, and fetal growth. Pathol Res Pract. 2011;207(9):545–553. doi: 10.1016/j.prp.2011.06.001. [DOI] [PMC free article] [PubMed] [Google Scholar]
- 14.Xu J, Yeon JE, Chang H, Tison G, Chen GJ, Wands J, et al. Ethanol impairs insulin-stimulated neuronal survival in the developing brain: role of PTEN phosphatase. J Biol Chem. 2003;278(29):26929–26937. doi: 10.1074/jbc.M300401200. [DOI] [PubMed] [Google Scholar]
- 15.Inderdeo DS, Edwards DR, Han VK, Khokha R. Temporal and spatial expression of tissue inhibitors of metalloproteinases during the natural ovulatory cycle of the mouse. Biol Reprod. 1996;55(3):498–508. doi: 10.1095/biolreprod55.3.498. [DOI] [PubMed] [Google Scholar]
- 16.Altman PL, Dittmer DS. Biology Data Book. Amrl-Tr-64-100. AMRL TR. 1964;1 [PubMed] [Google Scholar]
- 17.Vercruysse L, Caluwaerts S, Luyten C, Pijnenborg R. Interstitial trophoblast invasion in the decidua and mesometrial triangle during the last third of pregnancy in the rat. Placenta. 2006;27(1):22–33. doi: 10.1016/j.placenta.2004.11.004. [DOI] [PubMed] [Google Scholar]
- 18.Lester-Coll N, Rivera EJ, Soscia SJ, Doiron K, Wands JR, de la Monte SM. Intracerebral streptozotocin model of type 3 diabetes: Relevance to sporadic Alzheimer's disease. J Alzheimers Dis. 2006;9(1):13–33. doi: 10.3233/jad-2006-9102. [DOI] [PubMed] [Google Scholar]
- 19.Cohen AC, Tong M, Wands JR, de la Monte SM. Insulin and insulin-like growth factor resistance with neurodegeneration in an adult chronic ethanol exposure model. Alcohol Clin Exp Res. 2007;31(9):1558–1573. doi: 10.1111/j.1530-0277.2007.00450.x. [DOI] [PubMed] [Google Scholar]
- 20.Graham CH, Hawley TS, Hawley RG, MacDougall JR, Kerbel RS, Khoo N, et al. Establishment and characterization of first trimester human trophoblast cells with extended lifespan. Exp Cell Res. 1993;206(2):204–211. doi: 10.1006/excr.1993.1139. [DOI] [PubMed] [Google Scholar]
- 21.Banerjee K, Mohr L, Wands JR, de la Monte SM. Ethanol inhibition of insulin signaling in hepatocellular carcinoma cells. Alcohol Clin Exp Res. 1998;22(9):2093–2101. [PubMed] [Google Scholar]
- 22.de la Monte SM, Lahousse SA, Carter J, Wands JR. ATP luminescence-based motility-invasion assay. Biotechniques. 2002;33(1):98–100. doi: 10.2144/02331rr01. 2, 4 passim. [DOI] [PubMed] [Google Scholar]
- 23.de la Monte SM, Tong M, Carlson RI, Carter JJ, Longato L, Silbermann E, et al. Ethanol inhibition of aspartyl-asparaginyl-beta-hydroxylase in fetal alcohol spectrum disorder: potential link to the impairments in central nervous system neuronal migration. Alcohol. 2009;43(3):225–240. doi: 10.1016/j.alcohol.2008.09.009. [DOI] [PMC free article] [PubMed] [Google Scholar]
- 24.Urso T, Gavaler JS, Van Thiel DH. Blood ethanol levels in sober alcohol users seen in an emergency room. Life Sci. 1981;28(9):1053–1056. doi: 10.1016/0024-3205(81)90752-9. [DOI] [PubMed] [Google Scholar]
- 25.Soscia SJ, Tong M, Xu XJ, Cohen AC, Chu J, Wands JR, et al. Chronic gestational exposure to ethanol causes insulin and IGF resistance and impairs acetylcholine homeostasis in the brain. Cell Mol Life Sci. 2006;63(17):2039–2056. doi: 10.1007/s00018-006-6208-2. [DOI] [PMC free article] [PubMed] [Google Scholar]
- 26.Wilson ME, Ford SP. Comparative aspects of placental efficiency. Reproduction. 2001;58 (223-32. [PubMed] [Google Scholar]
- 27.Gasperowicz M, Otto F. The notch signalling pathway in the development of the mouse placenta. Placenta. 2008;29(8):651–659. doi: 10.1016/j.placenta.2008.06.004. [DOI] [PubMed] [Google Scholar]
- 28.May PA, Gossage JP. Maternal risk factors for fetal alcohol spectrum disorders. Not as simple as it might seem. Alcohol Res Health. 2011;34(1):15–26. [PMC free article] [PubMed] [Google Scholar]
- 29.Barker DJ, Osmond C, Golding J, Kuh D, Wadsworth ME. Growth in utero, blood pressure in childhood and adult life, and mortality from cardiovascular disease. Bmj. 1989;298(6673):564–567. doi: 10.1136/bmj.298.6673.564. [DOI] [PMC free article] [PubMed] [Google Scholar]
- 30.Dabelea D, Hanson RL, Lindsay RS, Pettitt DJ, Imperatore G, Gabir MM, et al. Intrauterine exposure to diabetes conveys risks for type 2 diabetes and obesity: a study of discordant sibships. Diabetes. 2000;49(12):2208–2211. doi: 10.2337/diabetes.49.12.2208. [DOI] [PubMed] [Google Scholar]
- 31.Catalano PM, Presley L, Minium J, Hauguel-de Mouzon S. Fetuses of obese mothers develop insulin resistance in utero. Diabetes Care. 2009;32(6):1076–1080. doi: 10.2337/dc08-2077. [DOI] [PMC free article] [PubMed] [Google Scholar]
- 32.Eriksson JG, Gelow J, Thornburg KL, Osmond C, Laakso M, Uusitupa M, et al. Long-term effects of placental growth on overweight and body composition. Int J Pediatr. 2012;2012 doi: 10.1155/2012/324185. (324185. [DOI] [PMC free article] [PubMed] [Google Scholar]
- 33.Ramadoss J, Jobe SO, Magness RR. Alcohol and maternal uterine vascular adaptations during pregnancy-part I: effects of chronic in vitro binge-like alcohol on uterine endothelial nitric oxide system and function. Alcoholism, clinical and experimental research. 2011;35(9):1686–1693. doi: 10.1111/j.1530-0277.2011.01515.x. [DOI] [PMC free article] [PubMed] [Google Scholar]
- 34.Subramanian K, Naik VD, Sathishkumar K, Yallampalli C, Saade GR, Hankins GD, et al. Chronic binge alcohol exposure during pregnancy impairs rat maternal uterine vascular function. Alcoholism, clinical and experimental research. 2014;38(7):1832–1838. doi: 10.1111/acer.12431. [DOI] [PMC free article] [PubMed] [Google Scholar]
- 35.Fowden AL, Ward JW, Wooding FP, Forhead AJ, Constancia M. Programming placental nutrient transport capacity. J Physiol. 2006;572(Pt 1):5–15. doi: 10.1113/jphysiol.2005.104141. [DOI] [PMC free article] [PubMed] [Google Scholar]
- 36.Cross JC, Nakano H, Natale DR, Simmons DG, Watson ED. Branching morphogenesis during development of placental villi. Differentiation. 2006;74(7):393–401. doi: 10.1111/j.1432-0436.2006.00103.x. [DOI] [PubMed] [Google Scholar]
- 37.Simmons DG, Cross JC. Determinants of trophoblast lineage and cell subtype specification in the mouse placenta. Dev Biol. 2005;284(1):12–24. doi: 10.1016/j.ydbio.2005.05.010. [DOI] [PubMed] [Google Scholar]
- 38.Gundogan FGJ, Ooi JH, Sung J, Qi W, Naram R, de la Monte SM. Dual mechanisms of ethanol-impaired placentation: Experimental model. Journal of Clinical and Experimental Pathology. 2013;3(2) [Google Scholar]
- 39.Bischof P, Irminger-Finger I. The human cytotrophoblastic cell, a mononuclear chameleon. Int J Biochem Cell Biol. 2005;37(1):1–16. doi: 10.1016/j.biocel.2004.05.014. [DOI] [PubMed] [Google Scholar]
- 40.Gundogan F, Elwood G, Greco D, Rubin LP, Pinar H, Carlson RI, et al. Role of aspartyl-(asparaginyl) beta-hydroxylase in placental implantation: relevance to early pregnancy loss. Hum Pathol. 2007;38(1):50–59. doi: 10.1016/j.humpath.2006.06.005. [DOI] [PubMed] [Google Scholar]


