

Abstract
The immune system is a complex system of chemical and cellular interactions that responds quickly to queues that signal infection and then reverts to a basal level once the challenge is eliminated. Here, we present a general, four-component model of the immune system’s response to a Staphylococcal aureus (S. aureus) infection, using ordinary differential equations. To incorporate both the infection and the immune system, we adopt the style of compartmenting the system to include bacterial dynamics, damage and inflammation to the host, and the host response. We incorporate interactions not previously represented including cross-talk between inflammation/damage and the infection and the suppression of the anti-inflammatory pathway in response to inflammation/damage. As a result, the most relevant equilibrium of the system, representing the health state, is an all-positive basal level. The model is able to capture eight different experimental outcomes for mice challenged with intratibial osteomyelitis due to S. aureus, primarily involving immunomodulation and vaccine therapies. For further validation and parameter exploration, we perform a parameter sensitivity analysis which suggests that the model is very stable with respect to variations in parameters, indicates potential immunomodulation strategies and provides a possible explanation for the difference in immune potential for different mouse strains.
Keywords: immunology, mathematical modelling, MRSA, osteomyelitis
1. Introduction
1.1 Overview
When a pathogen enters a host, a complex sequence of responses takes place to remove the challenge and prevent any further damage. In most instances, a healthy body’s immune system is successful in eliminating the foreign microbes; however, there are several possible complications that can arise. The infection may become endemic, or there may be reoccurring bouts of infection followed by periods of relative inactivity. Each of the outcomes hinge on the interplay between the immune system and the bacterial dynamics. The goal of this investigation is to determine if a simple compartmental model which incorporates the known major interactions can reflect each of the outcomes of recent experimental results for mice challenged with osteomyelitis due to Staphylococcal aureus (S. aureus). The model presented serves to develop and test treatment methods as well as a building block for more detailed biofilm models.
There are many layers to the immune system involving cellular, chemical and neural pathways. We used a simplified system of components: the pro-inflammatory response, which in regard to the experiments described later, represents the inflammatory cytokines and cells of the Th1 and Th17 responses (IL-2, IL-12p70, IL-6, IL-17, TNF-α, IL-1β, neutrophils) and the anti-inflammatory response for the Th2 and Treg responses (IL-4, IL-10). Another component of the model is ‘inflammation’, which is used as a general compartment which we choose to represent higher blood flow, cellular damage and pro-inflammatory chemical signalling. Before a challenge, the immune system is maintained at a low level of activation with no active response and low levels of passive/innate response components (Delves & Roitt, 2000b). Under ideal circumstances, the interplay between the pro-inflammatory, anti-inflammatory and ‘inflammation’ components will bring the body back to a basal or healthy level.
Finding the best course of treatment for pathogens that overwhelm the immune system’s response such as persistent infections due to S. aureus, both Methicillin Sensitive and Methicillin Resistant (MRSA) strains, and Streptococcus spp. is a difficult problem. One of the goals of this study is to develop a model that incorporates current observations—in particular, how different parameter regimes reflect observable outcomes regarding bacterial clearance, proper immune response and vaccine strategies. In the next section, we overview the specific biological observations that we incorporate into the model.
1.2 Biological background
It is difficult to eliminate and prevent aggressive infections using standard treatment protocols (Shirtliff et al., 2001). Treatment is often complicated for infections caused by strains that are resistant to an array of antimicrobial agents, such as MRSA (Gould et al., 2012). This pathogen is a rising problem, not only from infections such as skin, soft tissue, pneumonia or musculoskeletal infections, but also due to the burgeoning increase in the use, and the resulting infections of, indwelling medical devices such as intravenous catheters and prosthetic implants. MRSA has a number of genetically encoded resistance mechanisms, such as efflux pumps, antibiotic-degrading/deactivating enzymes or altering the antibiotic target. MRSA can also tolerate high levels of antibiotics to which it is normally sensitive due to its growth as a community of microbes termed biofilm. Biofilms are formed by bacteria attaching to a surface and embedding themselves in an extracellular hydrated slime matrix derived from both the microbes themselves and the host (Shirtliff et al., 2002). This forms a source of infection that resists clearance by the host immune response and antimicrobial agents.
Despite genetically encoded resistance mechanisms, the antibiotic tolerance enjoyed by the microbes within a biofilm is due to a variety of protective mechanisms including reduced antibiotic penetration, low metabolic rate and specialized phenotypic expression (Gilbert et al., 1990; Proctor et al., 1998; Stewart & Costerton, 2001; Thien-Fah et al., 2001; Stewart, 2003). These tolerance mechanisms enable 102- to 103-fold increased tolerance to antimicrobial agents compared with their free-floating, planktonic counterparts. There is also growing evidence that the biofilm mode of growth increases the spread of advantageous mutations that induce drug resistance (Cogan, 2006). Therefore, biofilm infections usually cannot be resolved using antimicrobial agents alone, and once a mature biofilm forms within the host, surgical removal of the biofilm becomes necessary to eliminate the infection, causing significantly more morbidity, mortality and complications for the patient (Prabhakara et al., 2011b).
In this study, the pathogen is treated as a growing population whose growth depends explicitly on the inflammation and damage—which we generalize as our ‘inflammation’ component of the model. Studies have shown that biofilm infections can benefit from inflammatory responses which increase the level of nutrients to the area. One example of this is Helicobacter pylori, which infects a nutrient poor area of the stomach between epithelial and mucosal layers. Activation of the pro-inflammatory response makes nutrients available to these bacteria for growth (Baldari et al., 2005). In addition, there is evidence suggesting that S. aureus can induce pro-inflammatory cytokines (Assenmacher et al., 1998; Sinha et al., 1999; Breuer et al., 2005). In inducing a pro-inflammatory response, S. aureus can then lyse leucocytes and blood cells brought by increased blood flow using a variety of different toxins, and then subsequently use several types of uptake systems to collect nutrients (Dinges et al., 2000). This is in addition to the eukaryotic extracellular matrix proteins brought to the infection which the bacteria target to attach and promote colonization. The pro-inflammatory component of the immune system decreases the pathogen level as leucocytes attack the infection. Simultaneously, the bacteria increase the damage to the host. In the beginning stages of biofilm development, a flood of proteins are expressed by S. aureus to promote adherence and colonization. Many of these proteins cause damage to the host to harvest nutrients for colony growth. This formation of biofilm is the root of osteomyelitis, which is the focus of the biological experiments that the model reflects (Brady et al., 2006). This coupled interaction between the infection and inflammation/damage is a distinction of the current study.
The Shirtliff group at the University of Maryland has been interested in identifying new ways to prevent these biofilm infections such as vaccines and immunomodulation. They have performed a series of experiments to identify different aspects of the immune response to osteomyelitis in mice. In these experiments, S. aureus biofilms were grown on a pin and implanted into the tibia of mice. At multiple days, post-infection, samples were collected in order to determine local cytokine production, regulatory T-cell (Treg) frequency and neutrophil infiltration and culture of bones was done to detect the presence of infection (Brady et al., 2011; Prabhakara et al., 2011a,b; Shirtliff et al., 2012).
Three different strains of mice were used in these experiments, the main two being: BALB/c and C57BL/6. These mice strains have biased immune responses where C57BL/6 mice have dominant pro-inflammatory response (Th1 and Th17 cellular responses), and BALB/c mice have stronger anti-inflammatory responses (Th2 and Treg cellular responses) (Chen et al., 2005; Prabhakara et al., 2011a). Inflammation results in increased blood flow and inflammatory cell influx into areas of infection, which can often eliminate the invading pathogens. However, if not specific or overly activated, host tissue damage can result from uncontrolled inflammation. Contrasting these responses are the anti-inflammatory responses that reduce inflammation through host immune cells, cytokines and chemokines (Delves & Roitt, 2000a).
The first of a series of experiments compared the immune responses of BALB/c and C57BL/6 mice. The infection was less severe in BALB/c mice than the C57BL/6 mice. BALB/c mice had increased anti-inflammatory (Th2 and Treg) cytokine levels, while C57BL/6 mice had increased inflammatory cytokines (IL-12, IL-17, TNF-α and IL-β).
In addition, they compared the neutrophil infiltration (damage caused by neutrophils moving into the infected area) at the pin implant site of the C57BL/6 and the BALB/c mice. After staining the tibia of the infected mice, they observed significant physiological disruption to the C57BL/6 tibia, whereas the BALB/c tibia looked like the C57BL/6 tibia implanted with sterile pins.
To test the hypothesis that a robust Th2 response allows the BALB/c mice to resolve the infection, they performed the same experiment on another strain of mice, STAT6 KO BALB/c. The STAT6 gene has well-documented roles in the differentiation of Th2 cells, expression of cell surface markers and class switching of immunoglobulins. Therefore, the knockout strain has a Th2 defect due to lack of this important component of the Th2 signalling pathway. The STAT6 KO BALB/c experiment resulted in chronic infection for all the mice compared with clearance in the majority of wild-type BALB/c mice. This suggests that the Th2 is necessary to eliminate S. aureus biofilm infections for BALB/c mice. However, these mice had similar gross morphology and bacterial numbers in their tibia to the wild-type BALB/c mice. Evidently, either the STAT6 KO BALB/c mice have a compensatory mechanism, like higher Treg levels, or the intense Th1 and Th17 responses of the C57BL/6 mice increased the severity of their infections (Prabhakara et al., 2011b).
By treating the BALB/c mice with anti-CD25 antibodies, the Shirtliff group was able to test whether the Treg response was also necessary for the BALB/c mice to eliminate the infection. These antibodies effectively eliminate the majority of Treg cells in the mice. From this experiment, they found that most of the BALB/c mice were no longer able to clear the infection without their Treg cells (Prabhakara et al., 2011b).
To determine if the pro-inflammatory (Th1 and Th17) responses of the C57BL/6 mice exacerbate the infection, they treated these mice with two different types of antibodies. First, they treated with antibodies against a Th17 cytokine (anti-IL-6) and then antibodies against a cytokine common to both Th1 and Th17 immune responses (anti-IL-12p40). They observed a slight reduction of infection in the mice overall for the first antibody treatment, but with the combined antibody treatment, there was a significant reduction (Prabhakara et al., 2011b).
Finally, the Shirtliff group developed two different vaccines for osteomyelitis caused by MRSA. Efforts towards vaccine development for MRSA is important due to their antibiotic resistance and ability to form a biofilm. However, S. aureus presents major challenges to current vaccine strategies which are not addressed by the majority of these vaccine development efforts (including polymicrobial infection, biofilm maturation and host carrier status). For a full discussion on the development of vaccines for S. aureus, see (Harro et al., 2010). Bacterial vaccines can consist of various types (killed-whole bacteria, live-attuentuated bacteria, toxoid, protein only, polysaccharide only and protein–polysaccharide conjugate (Harro et al., 2010)); the two vaccines described here use target proteins specific to the S. aureus biofilm as antigens.
Without vaccination, it is understood that the C57BL/6 mice would not have a quick or strong enough immune response to these antigens before a protective biofilm matrix forms at the implant site. The first vaccine showed some protection against an S. aureus biofilm infection. However, since the vaccine was composed of biofilm-specific antigens only, adjunctive antibiotic therapy was required in these studies to clear the free-floating, and antibiotic-sensitive, planktonic populations (Brady et al., 2011). These planktonic populations are often shed from the biofilm colony/structure. The second vaccine was a pentavalent (five-component) vaccine consisting of the original four components of the earlier vaccine with an additional antigen. The additional antigen is expressed by the planktonic bacteria in vivo during the infection. The five-component vaccine provided complete protection and elimination of S. aureus populations in the mouse model with prosthetic implant infections (Shirtliff et al., 2012).
In the model we present below, we do not look at specific elements of the immune system but at general components. Therefore, we do not include the vaccine directly into the model, but adjust parameters that govern the affected components. The functions of host antibodies include neutralization, aiding in removal and destruction of pathogens (especially bacteria). In addition, recent evidence shows that plasma cells (activated B cells which are the source of antibodies) produce pro-inflammatory cytokines (Vettermann et al., 2011). Since our pro-inflammatory response is the only component that eliminates/prevents infection, we consider these vaccination benefits pro-inflammatory. We specify the particular parameter changes below.
For a summary of the mouse strains and their basic biological elements, see Table A1 in the Appendix.
1.3 Mathematical background
Many models have been developed to describe the immune system including the causes and affects of inflammation. Considering the number of interconnected components of the immune system, including the signalling cytokines, active cellular machinery and the transduction of the cytokine signal, detailed models require a substantial number of variables and assumptions which can be problematic since many of these immune system components are not completely characterized (Wigginton & Kirschner, 2001; Marino & Kirschner, 2004; Marino et al., 2004; Chow et al., 2005; Gammack et al., 2005). Although these models are more biologically detailed, they can be quite difficult to analyse and are not as well-suited for developing a general understanding of the main components.
In an attempt to handle the complexity of the immune system, many modellers take a simplified, mechanistic approach. For example, in one study, the pro-inflammatory response was divided into two components: early and late (Kumar et al., 2004). This model was capable of describing many clinically relevant outcomes but without specific experiments/organisms implicated. In an extended model, the anti-inflammatory response was incorporated and played several important roles in the system’s recovery (Day et al., 2006; Reynolds et al., 2006). In particular, the anti-inflammatory component was responsible for expanding the basin of attraction for the healthy steady state. In a similar model, the anti-inflammatory response was included to determine if the anti-inflammatory cytokines could be applied as a therapy to suppress chronic inflammation (Herald, 2010). These successful compartmental models are the groundwork for our current study.
In choosing the compartmental approach, we present a four-component ordinary differential equation model that includes the inflammatory immune response to an infection of S. aureus. This model incorporates an immune response consisting of three elements: the pro-inflammatory response, anti-inflammatory response and inflammation, similar to the previous work mentioned above, which first incorporated and explored the addition of the anti-inflammatory response (Day et al., 2006; Reynolds et al., 2006), but there are several notable differences.
We use simpler kinetics to reduce the number of parameters required—specifically, we eliminate the use of Michaelis–Menten kinetics for more direct interactions.
We also require that the model exhibit a natural basal level when there is no pathogen exposure (an all-positive equilibrium), reflecting the disease-free state. This is separate from an all-zero equilibrium which remains unstable throughout.
An additional, and important, direct interaction between the inflammation damage and bacterial pathogen is included, where the pathogen benefits from the inflammation/damage and also causes inflammatory damage.
Another direct interaction between the inflammation/damage and anti-inflammatory response is included where the anti-inflammatory response is hindered by the inflammation/damage.
Finally, we consider alterations in the parameters that are motivated by a range of experiments with different mouse strains (i.e. different immune potential) and vaccine strategies.
This model is capable of capturing this range of experiments—indicating the flexibility of the model structure. In addition, the results of a parameter sensitivity analysis indicate that the model is stable with respect to variations in the parameters, and the analysis suggests an explanation for the difference in immune potential between two of the mouse strains.
The interactions included in this system were motivated by the experimental designs described above and recent biological evidence. We also dynamically link the decay rates of the pro- and anti-inflammatory responses with the presence of an infection to reflect the immune system’s ongoing effort (Coxon et al., 1999). With these modifications, we are able to include the different mice strains and vaccine strategies needed to represent the Shirtliff experiments (Brady et al., 2011; Prabhakara et al., 2011b; Shirtliff et al., 2012).
The model is simple and does not incorporate the interactions of specific cell types and chemical signalling; despite this, we found that it can predict several clinically relevant outcomes. The model includes 16 parameters, some of which can be well-estimated. For the linear stability analysis, we used Maple to determine equilibria and their eigenvalues for stability. In order to evaluate the effect of variations in the other key parameters, we performed a sensitivity analysis and found that our results are quite robust to a range of perturbations.
2. Model
We now introduce the full model which consists of four components: pro- (P) and anti-inflammatory (A) responses, inflammation (I) and a bacterial infection (B). Inflammation represents the damage caused by an injury or a pathogen, and the pro- and anti-inflammatory responses are the components of the immune system that work to repair damage and eliminate the problem-causing issue. The bacterial component directly interacts with the pro-inflammatory response and inflammation of the immune system subsystem (Fig. 1). The full system is as follows:
| (2.1) |
| (2.2) |
| (2.3) |
| (2.4) |
Fig. 1.
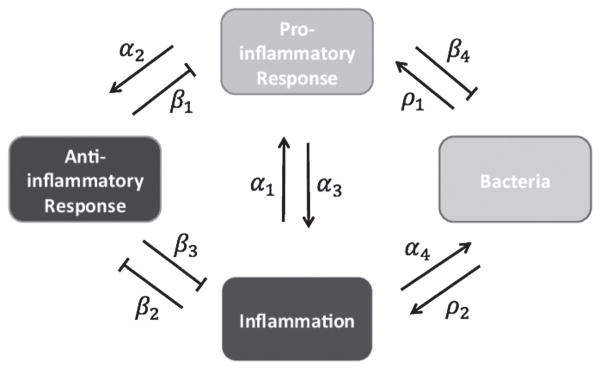
Model diagram for component interactions. Arrow-ended lines represent the up-regulation or promotion of one component by another. Flat-ended lines represent down-regulation or blockage of one component by the corresponding component. The general interactions outlined by this figure are described by the following parameters: α1 is the response or recruitment rate of pro-inflammatory cells and signalling to inflammatory signalling; ρ1 is the response rate of the pro-inflammatory response to the infection itself; β1 is the rate the anti-inflammatory cells and signalling reduce/inhibit the response of the pro-inflammatory response; α2 is the response or recruitment rate of the anti-inflammatory response to pro-inflammatory signalling; β2 is the rate at which inflammation inhibits the anti-inflammatory response; α3 is the rate of inflammation/damage produced by the pro-inflammatory response; ρ2 is the rate of inflammation/damage produced by the infection; β3 is the rate at which the anti-inflammatory response removes inflammatory signalling and damage; α4 is the rate at which the infection benefits from inflammation and damage and β4 is the rate at which the pro-inflammatory response kills or removes the bacteria. These descriptions as well as other parameters are listed in Table A2.
The pro-inflammatory component (P) is the combined efforts of the Th1 and Th17 responses of mice described by the Shirtliff group. This response is recruited by inflammation with rate α1. However, this recruitment is not exponential. Since the immune system is designed with a maximal, active capacity, it depends on the amount of the pro-inflammatory response present. This is similar to Kumar et al. (2004), but we do not make the assumption that this includes anti-inflammatory cytokines but treat the anti-inflammatory response separately. The pro-inflammatory also depends on the bacterial presence with rate ρ1. The pro-inflammatory response is down-regulated by the anti-inflammatory response directly with rate β1, and it decays at a rate μ1. In addition, we assume that the natural decay rate decreases when bacteria are present in the system, agreeing with the biological evidence that the production of granulocyte/macrophage colony-stimulating factor (GM-CSF) released by activated endothelial cells causes anti-apoptotic activity and enhanced survival in neutrophils (Coxon et al., 1999).
The anti-inflammatory component (A) represents the effort of the Treg cells. In the model, the anti-inflammatory response is recruited by the pro-inflammatory response at rate α2. This is a simplification since the anti-inflammatory response is actually recruited by the inflammation. We make this simplifying assumption because the anti-inflammatory response should not be effective against the inflammation until macrophages (part of the pro-inflammatory response) are activated, similar to Herald (2010). This separate activation is the ‘reprogramming’ of already active macrophages by Treg cells. The anti-inflammatory response is decreased by inflammation caused by platelet blockage impeding Treg recruitment (Moura & Tjwa, 2010) with rate β2 and by its natural decay rate μ2. We again assume that the natural decay rate also depends on the magnitude of the infection since GM-CSF affects monocytes as well and are the precursors for macrophages.
The inflammation component (I) reflects the damage caused by both the pro-inflammatory response and the bacteria. It is reduced by the anti-inflammatory response and natural decay. The coupling between the pathogen and damage has not been incorporated in previous models and plays a key role in our results. The pro-inflammatory response and infection cause the inflammation to increase with rates α3 and ρ2, respectively. The inflammation is reduced by the immune system’s anti-inflammatory response with rate β3 and by its natural decay rate represented by μ3.
The bacteria component (B) is treated as a growing population that benefits from inflammation—unlike previously mentioned models (Kumar et al., 2004; Reynolds et al., 2006; Herald, 2010) and is reduced by the pro-inflammatory response. We use logistic-type growth since we are not accounting for nutrient for the bacteria to harvest from the body where g is the growth rate. The bacteria directly benefit from the inflammation with rate α4 and are eliminated by the pro-inflammatory response with rate β4. In addition, we include a source term e−γt representing the initial source of the biofilm infection which was incorporated to better represent the slowly decaying infection from the pin in the experiments.
We note that the Th2 response is represented in the combination of both pro-inflammatory and anti-inflammatory components. Th2 recruits cells to attack the biofilm (pro-inflammation component). Th2 also produces cytokines that reduce the Th1 and Th17 responses (anti-inflammatory component).
These variables quantify the response of each component rather than give a quantitative count. In the experiments, the data that can be collected are those of the cytokine concentration, which is less useful in understanding the interactions at a mechanistic level. Our analysis combines several of the components the Shirtliff experiments describe and gives a qualitative relationship between the model predictions and the experimental data.
Without an infection, the immune subsystem has five equilibria. Only two of these equilibria are biologically relevant (they do not have any negative values). One of the biologically relevant equilibria is the all-zero equilibrium which is unstable (P̄, Ā, Ī) = (0, 0, 0). The other is a stable, non-zero (all-positive) equilibrium that is considered the natural basal level (P̄, Ā, Ī) ≈ (0.82, 0.20, 2.10). This is unlike the models previously mentioned where their healthy state does not correspond to a basal level due to a zero value for one of the immune system components (Kumar et al., 2004; Reynolds et al., 2006). Depending on which component is perturbed from this healthy equilibrium, the system will follow a particular recovery pathway.
If only the inflammation is initially higher than the basal level, the pro-inflammatory response increases and then the anti-inflammatory response follows. Eventually all three components return back to the basal level. If only the initial amount of pro-inflammatory response is higher than the basal level, both the inflammation and anti-inflammatory responses increase in response to the pro-inflammatory signalling, and again, everything returns to the basal level. An increase in only the anti-inflammatory response results in the anti-inflammatory response simply returning to the basal level (see Fig. 2 for examples of the immune system responding to different initial conditions).
Fig. 2.

Immune response to basal levels: the parameter set used for these particular simulations is the BALB/c mouse set listed in the parameter table. The basal level is (P̄, Ā, Ī) ≈ (0.82, 0.20, 2.10) with eigenvalues λ ≈ −0.17, −0.44, −0.95. Top left: initial high inflammation, pro-inflammatory response and anti-inflammatory response, top right: initial high pro-inflammatory response and anti-inflammatory response, but low inflammation, bottom: initial high pro-inflammatory response and even higher anti-inflammatory response with low initial inflammation.
As key parameters are changed, the healthy steady state, which has a low level of inflammation after bacterial challenge, moves to a chronically inflamed state. Notably, chronic inflammation persists even in the absence of bacterial challenge, which is a hallmark of that disease. The model does not admit a separate equilibrium from the basal level equilibrium but rather indicates that chronic inflammation is due to particular defects in the immune system and not necessarily caused by a particular event. This interpretation of chronic inflammation can be reached by:
decreasing the anti-inflammatory response rate, α2, representing a deficiency in the anti-inflammatory response;
increasing the production of inflammation/damage due to the pro-inflammatory response, α3, representing an immune response more sensitive to its own cells;
increasing the rate at which inflammation hinders the anti-inflammatory response, β2, representing blockage to anti-inflammatory cells and cytokines/chemokines;
and decreasing the rate at which the anti-inflammatory response reduces inflammation, β3, representing an ineffectiveness of the anti-inflammatory cells (Fig. 2).
These parameter changes allow for the healthy steady state to have a significantly higher level for at least it is inflammation component. Chronic inflammation is not of particular interest for the biological or mathematical models presented here, but we provide our interpretation for comparison back to the literature.
After adding the bacterial dynamics, several new steady states are obtained. Note that the source term for bacteria goes to zero, so our steady state and linearization calculations neglect that contribution. There are eight total equilibria for the full system. Depending on the parameter choices, there can be two to three biologically relevant equilibria (they do not have negative or imaginary values for any of the components). The most clinically relevant represent the clearance of the infection or a return to health (or perhaps chronic inflammation) and chronic infection, similar to previous work (Kumar et al., 2004; Reynolds et al., 2006; Herald, 2010). The values for the steady states and their eigenvalues vary for the different parameter choices for experiments. These are listed in the figures for the experimental results. There is also the all-zero equilibrium which remains unstable for all of our experiments.
The simplest medical state the model can achieve is bacterial clearance by the immune response followed by the suppression of the inflammation. Here the equilibrium has a zero value for the bacterial component and all positive values for the immune system components at the basal level ((P̄, Ā, Ī, B̄) ≈ (0.82, 0.20, 2.10, 0) with all negative eigenvalues for the BALB/c mouse parameter set).
By changing clinically relevant parameters, a new stable equilibrium is introduced with all positive values while the previous steady states (all-zero equilibrium and the healthy equilibrium) persist. There is a transfer in stability between the new, infected state and the healthy state. Similar switches were found in Kumar et al. (2004), Day et al. (2006), Reynolds et al. (2006) and Herald (2010) where detailed phase-plane analysis was used. By decreasing the pro-inflammatory effectiveness (β4), the bacteria can survive the immune response. Alternatively, chronic infection can occur if the recruitment rate of the anti-inflammatory response is decreased (α2). By decreasing the rate at which the anti-inflammatory response eliminates inflammation (β3, such as neutralizing Treg cells), we see a stable, chronic infection. Finally, by increasing the amount that the inflammation component hinders the anti-inflammatory response (β2), the infection becomes chronic. The second and third parameter changes discussed above ultimately result in too strong a pro-inflammatory response for the anti-inflammatory response to compensate, which in turn causes too much inflammation/damage as seen by the evidence of neutrophil infiltration.
The model is also capable of representing both non-aggressive and aggressive species of bacteria. For the non-aggressive species (relatively low growth rate, g), the immune response is able to clear the infection. For more aggressive growth rates, the bacteria can still be cleared if the pro-inflammatory effectiveness (β4) is increased. This shows a threshold between health and infection dependent upon the virulence of the pathogen, previously and extensively described in the exploration of a constant versus dynamical anti-inflammatory response (Reynolds et al., 2006). This is similar to work describing the competition between pathogenic and probiotic populations in the gut where if the pathogenic growth rate exceeds a certain threshold, it dominates over the probiotic bacteria (Arciero et al., 2010).
A summary of model assumptions is as follows:
The bacteria do not hinder the pro- or anti-inflammatory responses (there are no direct inhibitory interactions from the bacteria to the pro- and anti-inflammatory responses).
Bacteria induce more inflammation than the pro-inflammatory response (i.e. the body is more sensitive to invaders than its own cells, α3 > ρ2 for normal, effective immune systems).
Inflammation is only suppressed by the anti-inflammatory response and a natural decay.
The presence of bacteria decreases the rate of decay of the anti-inflammatory response.
The pro-inflammatory cells respond more quickly to signals from host signals caused by inflammation than the pathogen itself (α1 > ρ1, for normal, effective immune systems).
3. Comparison with experimental results
In this section, we describe the results of several experiments using immunomodulation and specific mice strains. The Shirtliff lab investigated several levels of the immune responses of different types of mice and used different antibody treatments to further characterize those elements (Brady et al., 2011; Prabhakara et al., 2011b; Shirtliff et al., 2012). In each case, alterations in the related parameters in the model yield predictions that are consistent with the experiments. We note that previous models have been able to qualitatively describe clinically relevant states (e.g. persistent infection, clearance, etc.), but to our knowledge, none are specifically designed to compare with immunotherapy, vaccination or specific knock-out animal models. Reasonable changes to parameters in the current model can predict a wide range of experimental observations, indicating that the core model is capturing the dominant biological processes involved. The key contribution of our efforts indicates that the concept of ‘inflammation’ is more subtle than previously assumed and that simple compartmental models are capable of representing this complex system for specific biological experiments.
We have found that, for each experiment, the model gives similar results to those observed in the animal model experiments. We have included a table of parameters for the BALB/c mouse as our basis set of values (Table A2). The parameter values changed for each individual experiment are identified in the captions of each experiment’s figure. For each of the experiments, we have included the stable equilibrium in the figure citations as well, along with their eigenvalues. For all the simulations, the initial values for the immune components are below basal level (but not zero), the idea being that post-surgical implantation the mice would have lost fluids and some immune capability.
For a summary of the mathematical results compared with the biological results for each experiment, see Table A3.
Experiment 1: BALB/c
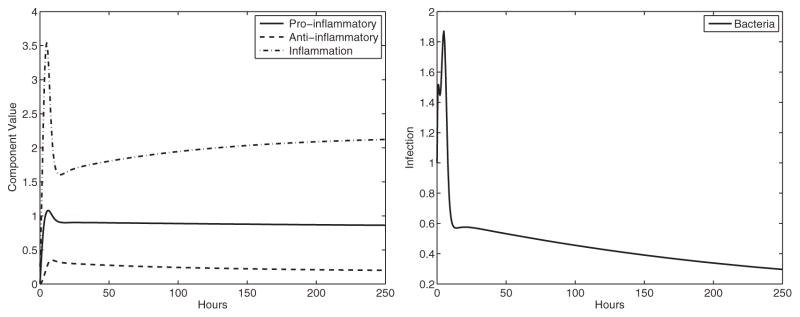
The mice of type BALB/c, which have Th2 biased responses, are able to clear the infection when implanted with a biofilm covered pin. We consider this as our basis experiment for the parameters in the model. Our model captures the clearance of the infection by BALB/c mice (the steady state is for zero bacteria and basal levels of the immune system unlike Reynolds et al. (2006), with eigenvalues that have negative real parts differing from Kumar et al., 2004, see Fig. 3).
Fig. 3.

Experiment 1: BALB/c response results in the clearance of infection. We consider this our basis experiment to compare other experimental responses. The stable equilibrium (basal level) is (P̄, Ā, Ī, B̄) ≈ (0.82, 0.20, 2.10, 0) with eigenvalues λ ≈ −0.06, −0.17, −0.44, −0.95. Top left: immune system components, top right: bacterial component, bottom: we present this dimensional simulation of the model output to compare with the experimental data for this particular experiment. We scaled the model output based on the observed Colony Forming Units (CFUs) of bacteria.
Experiment 2: C57BL/6
Recall that the C57BL/6 mice have decreased Th2 and Treg cytokines than BALB/c and are unable to clear the infection. Moreover, they have higher inflammation/neutrophil damage. Since the Th2 component has both pro- and anti-inflammatory roles, with these mice we lowered the pro-inflammatory effectiveness against the infection by lowering β4 lowered the reduction of the pro-inflammatory response by the anti-inflammatory response by decreasing β1 and lowered the recruitment rate of the anti-inflammatory response by decreasing α2. The model reflects the inability of the immune system to clear the infection. The model also indicates higher levels of inflammation that is consistent with the observation that C57BL/6 mice had higher neutrophil infiltration than the BALB/c mice. The inflammation part of the steady state for BALB/c is I ≈ 2.10, whereas for C57BL/6, in this experiment, it is I ≈ 2.69 (see Fig. 4).
Fig. 4.
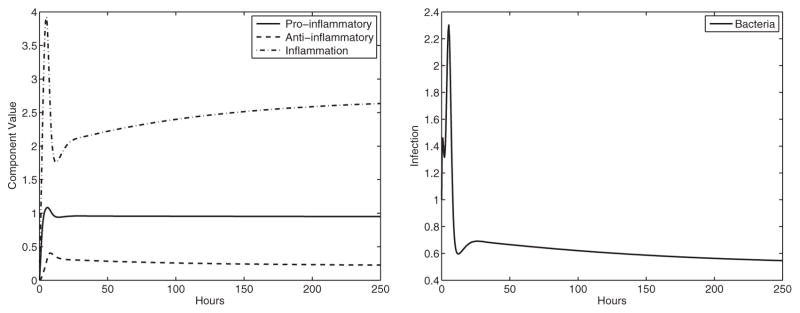
Experiment 2: C57BL/6 response. We changed specific parameters compared with the BALB/c mice (β1 = 0.007, α2 = 0.09, β4 = 4.75), resulting in chronic infection. The stable equilibrium is (P̄, Ā, Ī, B̄) ≈ (0.94, 0.22, 2.69, 0.54) with eigenvalues λ ≈ −0.07 + 0.33i, −1.04 + 0.33i, −1.04 −0.33i, −0.07 −0.33i. Left panel: immune system components, right panel: bacterial component.
Experiment 3: STAT6 KO BALB/c
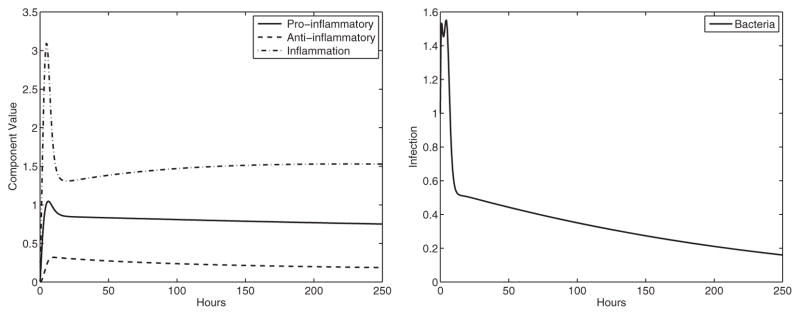
STAT6 KO BALB/c mice entirely lack the Th2 response. The parameters match the BALB/c parameters except for the pro-inflammatory effectiveness against the infection, which was lowered (β4). We also lowered the reduction of the pro-inflammatory response by the anti-inflammatory response (β1). Just as in the experiments, the infection is not cleared. In addition, these mice were found to have lower amounts of damage than C57BL/6 mice which is also predicted by the model (the inflammation component of the steady state for C57BL/6 is I ≈ 2.69, whereas for STAT6 KO BALB/c, it is I ≈ 1.56). Although these mice remain infected, the steady state has a lower amount of inflammation (see Fig. 5).
Fig. 5.
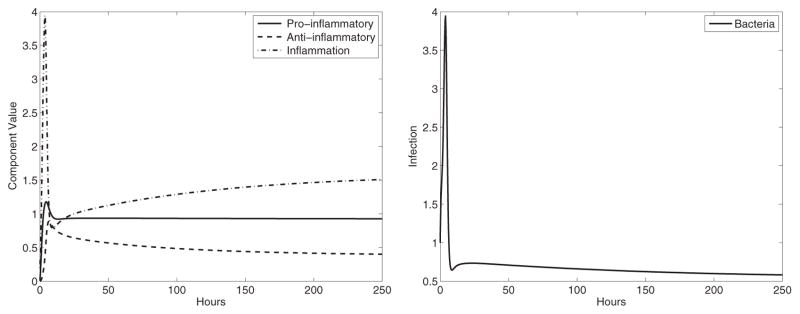
Experiment 3: STAT6 KO BALB/c response (β1 = 0.005, β4 = 3) where the Th2 response is removed—resulting in chronic infection. The stable equilibrium is (P̄, Ā, Ī, B̄) ≈ (0.91, 0.38, 1.56, 0.57) with eigenvalues λ ≈ −0.08 + 0.39i, −0.64, −1.33, −0.08 −0.39i. Left panel: immune system components, right panel: bacterial component.
Experiment 4: BALB/c treated with anti-CD25 antibodies eliminating Treg populations
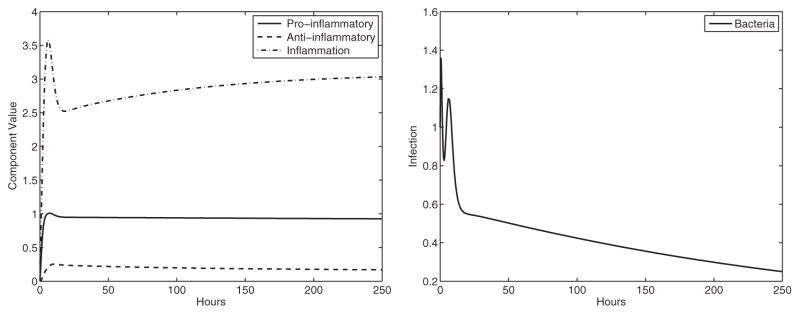
Experiments indicate that Tregs protect BALB/c mice from chronic infection. To test this, BALB/c mice were treated with anti-CD25 antibodies against Tregs. By decreasing the rate, the anti-inflammatory response reduces the pro-inflammatory response (β1) and the rate the anti-inflammatory response reduces inflammation (β3), the model captures the experimental results. The model shows that damage and infection amounts remain significantly high (see Fig. 6).
Fig. 6.
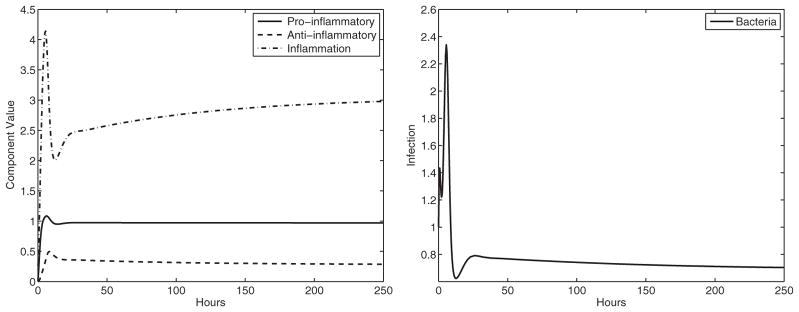
Experiment 4: BALB/c treated with Treg antibodies (β1 = 0.005, β3 = 1.5). Again, the result is infection, indicating that the Treg component of the immune system partially protects BALB/c mice from infection. The stable equilibrium is (P̄, Ā, Ī, B̄) ≈ (0.96, 0.28, 3.03, 0.70) with eigenvalues λ ≈ −0.06 + 0.36i, −1.16 + 0.43i, −1.16 −0.43i, −0.06 −0.36i. Left panel: immune system components, right panel: bacterial component.
Experiment 5: C57BL/6 mice treated with anti-IL-6 antibodies reducing Th17
C57BL/6 mice were given anti-IL-6 antibodies decreasing the Th17 response and the infection load (anti-IL-6, 15% of mice were able to clear the infection). Using the same parameters as the untreated C57BL/6 mice, with the exception of a reduction in the recruitment of the pro-inflammatory response (α1) and lowering the rate of inflammation caused by the pro-inflammatory response (α3, since the Th17 response was neutralized), the model indicates a lower level of infection but not a significant amount (similar to the observations in the physical experiments; see Fig. 7).
Fig. 7.
Experiment 5: C57BL/6 treated with Th17 antibodies (α1 = 0.225, β1 = 0.007, α2 = 0.09, α3 = 0.875, β4 = 4.75) results in reduced infection and damage, but does not clear the infection. The stable equilibrium is (P̄, Ā, Ī, B̄) ≈ (0.84, 0.18, 2.17, 0.18) with eigenvalues λ ≈ −0.09 + 0.18i, −0.62, −0.80, −0.09 −0.18i. Left panel: immune system components, right panel: bacterial component.
Experiment 6: C57BL/6 mice treated with anti-IL-12p40 antibodies reducing both the Th1 and Th17 host responses
When C57BL/6 mice are treated with antibodies against a cytokine common to both Th1 and Th17, 62.5% of the mice remained infected. We lowered the two parameters discussed in experiment 5 even more (α1, α3). If the multiplier is reduced enough, the infection is cleared. This indicates that whether the mouse is able to clear the infection or not depends on a threshold of the Th1 and Th17 response and may vary within the mice, which could explain why 62.5% of the mice remained infected (see Fig. 8).
Fig. 8.
Experiment 6: C57BL/6 treated with Th17 and Th1 antibodies with clearance of infection (α1 = 0.18, β1 = 0.007, α2 = 0.09, α3 = 0.7, β4 = 4.75). Here the treatment allows the mice to overcome the infection with the combined reduction of the two inflammatory responses. The stable equilibrium is (P̄, Ā, Ī, B̄) ≈ (0.68, 0.16, 1.46, 0) with eigenvalues λ ≈ −0.16, −0.19 + 0.08i, −0.72, −0.19 −0.08i. The healthy state (basal level) is lower than the healthy state of the BALB/c mice here due to the immunomodulation. Left panel: immune system components, right panel: bacterial component.
Experiment 7: C57BL/6 and four-component vaccine
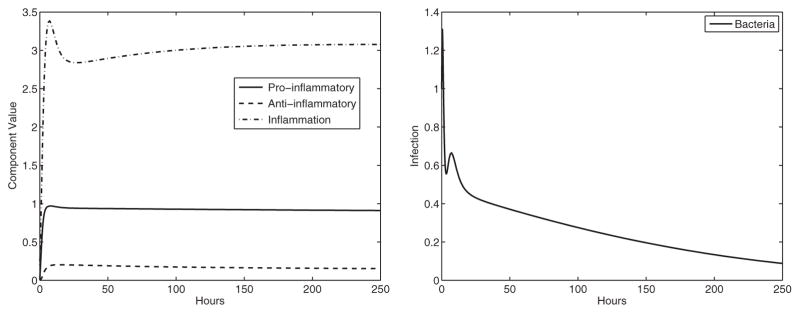
For another experiment, C57BL/6 mice were treated with four-component vaccine and antibiotics. With this vaccine, the pro-inflammatory response rate for the C57BL/6 mice is increased (α1), and the effectiveness of the pro-inflammatory response against infection is also increased (β4). Without the antibiotics, the vaccine is not sufficient to prevent infection (see Fig. 9). Antibiotics alone were also insufficient to clear the infection, and our model agrees with this.
Fig. 9.
Experiment 7: C57BL/6 treated with four-component vaccine resulting in no clearance (α1 = 0.36, β1 = 0.007, α2 = 0.09, β4 = 6). The four-component vaccine is unable to prime the immune system to remove the infection entirely. The stable equilibrium is (P̄, Ā, Ī, B̄) ≈ (0.91, 0.15, 3.08, 0.07) with eigenvalues λ ≈ −0.07 + 0.07i, −0.78, −1.25, −0.07 −0.07i. Left panel: immune system components, right panel: bacterial component.
Experiment 8: C57BL/6 and five-component vaccine
However, when C57BL/6 mice are treated with a five-component vaccine, the infection is prevented. For the five-component vaccine, we only increased the pro-inflammatory response rate to the same level as the four-component vaccine but increased the pro-inflammatory effectiveness against infection even more. By priming the immune system with this vaccine, it prepares the cells to be able to eliminate the infection faster and stronger. The model gives clearance of the infection (see Fig. 10).
Fig. 10.
Experiment 8: C57BL/6 treated with a five-component vaccine (α1 = 0.36, β1 = 0.007, α2 = 0.09, β4 = 7). Here the C57BL/6 mice clear the infection. The stable equilibrium is (P̄, Ā, Ī, B̄) ≈ (0.90, 0.15, 3.06, 0) with eigenvalues λ ≈ −0.82, −0.11, −0.68, −1.30. Left panel: immune system components, right panel: bacterial component.
4. Parameter sensitivity
One of the most useful tools that modellers use to understand the effects of uncertainty on model predictions is sensitivity analysis. This term refers to a broad group of methods that attempts to sort the parameters by their effect variations have on the model predictions. The value of this analysis is that the effects of parameters on the system can easily be identified and ranked accordingly without extensive exploration. The ability to identify parameters that exert more control on the output of the system provides insight into the biological processes that play a pivotal role. Additionally, for most biologically motivated mathematical models, parameters are approximated which leaves a certain level of uncertainty in model results, but if the majority of parameters can be identified as having low overall effect on the system, a degree of confidence is added to parameter approximations. Finally, identifying parameters that may be ‘frozen’ reduces the parameter space to explore.
We performed a parameter sensitivity analysis previously used for biological models for the parameters and initial conditions (Blower & Dowlatabadi, 1994). This sensitivity analysis is based upon Latin Hypercube Sampling (LHS) and the calculation of partial rank correlation coefficients (PRCCs). Sensitivity analysis indicates how changes in the values of a parameter affect the results of the model.
The first step in the analysis is to form the LHS matrix that organizes the parameter values for each of the N simulations. We are not able to draw any particular forms of probability distributions for our parameters, so we chose a uniform distribution with ranges between 0.002 and 7 for the parameters while the initial conditions range between 0.003 and 1. The distributions are divided into N intervals, where N is the number of simulations. The value K is the number of parameters being tested (here, K = 20, 16 parameters and 4 initial values). For our model, we choose N = 300 (it has been previously established that N > 4/3K must be satisfied (McKay et al., 1979; Blower & Dowlatabadi, 1994)). Each of these N parameter values are paired randomly with the N values of the other parameters. The LHS table is an NxK matrix. Once the LHS table has been established, N simulations are performed using parameter values from each of the rows of the LHS table. Next we calculate the PRCC value for each parameter and initial value corresponding to each output variable. As noted by Blower & Dowlatabadi (1994), a PRCC value indicates the monotonicity of the input variables (parameters) to the particular outcome variable. The sign of the PRCC indicates the qualitative relationship and the magnitude indicates the importance of the uncertainty.
We found that none of the parameters gave a PRCC value greater than 0.5 (values are shown in Table A4 in the Appendix). Correlation values below 0.5 are considered not significant individually. This analysis implies that the model’s results are stable for reasonable parameter choices.
More interestingly, we found that some of the parameters did stand out from the others with their PRCC values—specifically α2, β2, α3 and α4, which can be used as targets for experiments. The parameters β2 and α4, parameters added for interactions not previously incorporated into models, may be, in fact, significant to the model outcomes, which we are currently exploring mathematically and experimentally. Alternatively, α2, the recruitment of the anti-inflammatory response, possibly provides an explanation for the differences in immune potential between the two different mouse strains even though several parameters change between these experiments. The parameters α2, β2 and α3 were identified earlier as possible parameters for changing the immune stability between states. It has been suggested previously that this type of sensitivity analysis can identify bifurcation parameters (Marino et al., 2008). This sensitivity analysis narrows down interesting parameters to be explored.
5. Discussion
With this model, we are able to predict the outcome of a wide range of specific experiments by reasonable alterations in the parameter values. The model was motivated and analysed with the aim of reflecting particular experiments that lead to biologically and clinically relevant vaccine strategies. We have incorporated several interactions including: the positive feedback between the infection and inflammation, the dynamic decay rates for the pro- and anti-inflammatory response when the pathogen is present, the negative effect of the inflammation on the anti-inflammatory response and representing a slowly decaying bacterial load rather than a single bolus.
We have also performed a parameter sensitivity analysis to verify the acceptability of our parameter values—the parameter space already being smaller than some of other models mentioned previously. This analysis not only indicates that our parameter choices are reasonable but also that the model is very stable with parameter changes. This gives confidence that the model fit is robust—which is not the case for all models. In addition, the sensitivity analysis also provides guidance for which components of the immune system are important, and hence, good targets for immunotherapies.
It is of particular importance that the core model can capture all of the relevant experimental outcomes—including the healthy basal state represented by a non-zero equilibrium—by altering certain parameters that are comparable with different experimental designs. We also provide an alternative interpretation for the chronic inflammation state not described as a separate equilibrium. Knowing that the model is able to predict each of these experimental outcomes allows for major insights about the system interactions for successful vaccine strategies.
Not only can it predict experiments that manipulate the immune response, but it can also represent different mouse strains as well as the results from the introductions of both aggressive and non-aggressive species of bacteria. Perhaps this suggests that, mathematically, not every detail needs to be included to investigate a complex system. There is value for the biological investigators in being able to narrow down the scope of the characterization of the full immune response to the biofilm infections even though the exact mechanism may not be identified. However, the model can easily be built upon by adding more interactions as they are discovered, changing interactions to be less direct or expanding the model for more detailed biological interests.
Further experiments involving specific time course data are needed to investigate the model’s predictions for the behaviours of immune response components are accurate—such as early spikes in the model results and oscillations which can be induced by certain parameter changes not shown here. These behaviours are interesting biologically and are already motivating future experiments.
Acknowledgments
Funding
N.G.C. was supported by National Science Foundation DMS-1122378 M.E.S. was supported by the NIH, National Institute of Allergy and Infectious Diseases (AI069568-02 and ARRA Supplement AI069568) and the National Institute of Dental and Craniofacial Research (DE016257).
Appendix
Table A1.
Comparison of mouse strains: their dominant responses, antibodies involved for testing and list of experiments.
| Mouse strain | Basic description | Biological elements | Experiments |
|---|---|---|---|
| BALB/c | Anti-inflammatory response dominates | Th2, Treg dominate (Treg treated with: anti-CD25 antibodies) | 1,4 |
| C57BL/6 | Pro-inflammatory response dominates | Th17, Th1 dominate (treated with: anit-IL-6, anti-IL-12p40 antibodies) | 2,5–8 |
| STAT6 KO BALB/c | BALB/c mice with Th2 response removed | Treg dominates | 3 |
Note: the Th2 response has both pro- and anti-inflammatory characteristics
Table A2.
Parameters used in the model for the BALB/c mouse. All parameters have units h−1 except for the following: β1, β2, β3, β4 and α4 have units of (amount * h)−1; KB has units of relative amount. Estimated parameters have relatively low PRCC values, indicating that variations do not significantly alter results.
| Parameters | Values used | Description | Ref. |
|---|---|---|---|
| α1 | 0.27a | Response or recruitment rate of pro-inflammatory cells and signalling (P) to inflammatory signalling (I) | Estimated |
| ρ1 | 0.2 | Response rate of the pro-inflammatory response (P) to the infection itself (B) | Estimated (Reynolds et al., 2006) |
| β1 | 0.01a | Rate the anti-inflammatory cells and signalling (A) reduce/inhibit the response of the pro-inflammatory response (P) | Estimated |
| μ1 | 0.12 | Natural decay rate of the pro-inflammatory response (P) | Coxon et al. (1999) |
| α2 | 0.11a | Response or recruitment rate of the anti-inflammatory response (A) to pro-inflammatory signalling (P) | Estimated |
| β2 | 0.1 | Rate at which inflammation (I) inhibits the anti-inflammatory response (A) | Moura & Tjwa (2010) |
| μ2 | 0.25 | Natural decay rate of the anti-inflammatory response (A) | Huhn et al. (1997) and Coxon et al. (1999) |
| α3 | 1.05a | Rate of inflammation/damage (I) produced by the pro-inflammatory response (P) | Estimated |
| ρ2 | 0.45 | Rate of inflammation/damage (I) produced by the infection (B) | Estimated |
| β3 | 2a | Rate the anti-inflammatory response (A) removes inflammatory signalling and damage (I) | Brandwood et al. (1992), Edelson et al. (1975) and Matsui et al. (1983) |
| μ3 | 0.0174 | Natural decay rate of inflammation (I) | Reynolds et al. (2006) |
| g | 0.9 | Bacterial (B) growth rate | Spector (1956) |
| KB | 1 | Carrying capacity for infection (B) | Assumed |
| α4 | 1.5 | Rate the infection (B) benefits from inflammation and damage (I) | Estimated |
| β4 | 5a | Rate the pro-inflammatory response (P) kills or removes the bacteria (B) | Brandwood et al. (1992), Edelson et al. (1975) and Matsui et al. (1983) |
| γ | 0.01 | Decaying source of bacteria (B) from the implant | Estimated |
Parameters changed for specific experiments. Changed values for each experiment are identified in the captions of their simulations
Table A3.
Qualitative summary of the model results compared with experimental evidence (d = days)
| Experiment description | Model results | Corresponding biological results |
|---|---|---|
| 1. BALB/c tibia implanted with S. aureus-coated pin | Clearance of infection and return to basal/healthy equilibrium | After 21d, 41.67% of mice infected and after 49d, 25% infected—with decreasing CFU amounts; no biofilm formation; lack of neutrophil infiltration to bone (Prabhakara et al., 2011b) |
| 2. C57BL/6 tibia implanted with S. aureus-coated pin | Infection persists and bacteria positive equilibrium is stable which has a higher inflammation/damage value | At all time points 100% of mice infected; definite biofilm formation; large numbers of neutrophil infiltration to bone (Prabhakara et al., 2011b) |
| 3. STAT6 KO BALB/c tibia implanted with S. aureus-coated pin | Infection persists and bacteria positive equilibrium is stable. However, it has a lower inflammation/damage value | After 21d, 100% of mice were still infected but with CFU amounts comparable with BALB/c mice still infected at 21d (Prabhakara et al., 2011b) |
| 4. BALB/c tibia implanted with S. aureus-coated pin and treated with Treg antibodies | Infection persists and bacteria positive equilibrium is stable | After 21d, infected mice increased to 87.5% (Prabhakara et al., 2011b) |
| 5. C57BL/6 tibia implanted with S. aureus-coated pin and treated with Th17 antibodies | Infection persists and bacteria positive equilibrium is stable but with a lower level of infection | After 21d, infected mice decreased slightly to 85.7% (Prabhakara et al., 2011b) |
| 6. C57BL/6 tibia implanted with S. aureus-coated pin and treated with Th17 and Th1 antibodies | Small changes in the specific parameters for experiments 5 and 6 result in either persistence of infection or clearance | After 21d, infected mice decreased slightly to 62.5% (Prabhakara et al., 2011b) |
| 7. C57BL/6 tibia implanted with S. aureus coated pin and treated with quadrivalent vaccine and antibiotics | Infection persists and bacteria positive equilibrium is stable unless antibiotic treatment is incorporated which gives stability to the healthy/basal equilibrium | After previous vaccination, 14 d after implantation of infection 50% of mice remained infected (Shirtliff et al., 2012) and in rabbits 66% remained infected (Brady et al., 2011), but combined with antibiotics there was a 99.9% reduction in bacterial population for rabbits (Shirtliff et al., 2012) |
| 8. C57BL/6 tibia implanted with S. aureus coated pin and treated with pentavalent vaccine | Clearance of infection and return to basal/healthy equilibrium | After 21 d, there was 100% clearance in all mice (Shirtliff et al., 2012) |
Table A4.
PRCC values calculated for the model. Note that positive/negative values indicate a positive/negative feedback
| Parameters | Pro-inflammatory PRCC Value | Anti-inflammatory PRCC Value | Inflammation PRCC Value | Bacteria PRCC Value |
|---|---|---|---|---|
| α1 | 0.1318 | −0.0017 | 0.0109 | −0.0140 |
|
|
||||
| ρ1 | −0.0439 | 0.0505 | −0.0582 | −0.0717 |
|
|
||||
| β1 | 0.0300 | 0.0657 | 0.0894 | −0.0243 |
|
|
||||
| μ1 | −0.0682 | 0.0877 | −0.0341 | 0.1094 |
|
|
||||
| α2 | −0.3514 | 0.1963 | −0.2471 | −0.1969 |
|
|
||||
| β2 | 0.2675 | −0.1210 | 0.2054 | 0.1324 |
|
|
||||
| μ2 | 0.1890 | −0.2260 | 0.0454 | 0.0471 |
|
|
||||
| α3 | 0.4239 | 0.0649 | 0.3063 | 0.1606 |
|
|
||||
| ρ2 | 0.0698 | 0.0339 | 0.0851 | 0.0264 |
|
|
||||
| β3 | −0.1345 | 0.1110 | 0.1185 | 0.0080 |
|
|
||||
| μ3 | −0.1027 | −0.0409 | −0.2082 | −0.1059 |
|
|
||||
| g | 0.0857 | 0.0031 | 0.0334 | 0.0028 |
|
|
||||
| KB | 0.1644 | −0.1110 | 0.1031 | 0.1689 |
|
|
||||
| α4 | 0.2793 | 0.0335 | 0.0453 | 0.2204 |
|
|
||||
| β4 | −0.1632 | 0.0294 | −0.0269 | −0.1046 |
|
|
||||
| γ | 0.0576 | 0.0517 | 0.0357 | 0.0065 |
|
|
||||
| Pi | 0.0320 | 0.0857 | 0.0109 | 0.0291 |
|
|
||||
| Ai | −0.0770 | −0.0970 | −0.0420 | −0.1230 |
|
|
||||
| Ii | −0.0360 | −0.0770 | −0.0960 | −0.1000 |
|
|
||||
| Bi | 0.0682 | 0.0439 | 0.0818 | 0.1164 |
Contributor Information
Angela M. Jarrett, Department of Mathematics, Florida State University, 1017 Academic Way, Tallahassee, FL 32306, USA.
N.G. Cogan, Department of Mathematics, Florida State University, 1017 Academic Way, Tallahassee, FL 32306, USA
M.E. Shirtliff, Department of Microbial Pathogenesis, Dental School, University of Maryland, Baltimore, MD, USA
References
- Arciero JC, Ermentrout GB, Upperman JS, Vodovotz Y, Rubin JE. Using a mathematical model to analyze the role of probiotics and inflammation in necrotizing enterocolitis. Plos One. 2010;5:13. doi: 10.1371/journal.pone.0010066. [DOI] [PMC free article] [PubMed] [Google Scholar]
- Assenmacher M, Lohning M, Scheffold A, Manz RA, Schmitz J, Radbruch A. Sequential production of il-2, ifn-gamma and il-10 by individual staphylococcal enterotoxin b-activated t helper lymphocytes. Eur J Immunol. 1998;28:1534–1543. doi: 10.1002/(SICI)1521-4141(199805)28:05<1534::AID-IMMU1534>3.0.CO;2-R. [DOI] [PubMed] [Google Scholar]
- Baldari CT, Lanzavecchia A, Telford JL. Immune subversion by helicobacter pylori. Trends Immunol. 2005;26:199–207. doi: 10.1016/j.it.2005.01.007. [DOI] [PubMed] [Google Scholar]
- Blower SM, Dowlatabadi H. Sensitivity and uncertainty analysis of complex-models of disease transmission—an hiv model, as an example. Int Stat Rev. 1994;62:229–243. [Google Scholar]
- Brady R, Leid J, Costerton J, Shirtliff M. Osteomyelitis: clinical overview and mechanisms of infection persistence. Clin Microbiol Newsl. 2006;28:65–72. [Google Scholar]
- Brady RA, O’May GA, Leid JG, Prior ML, Costerton JW, Shirtliff ME. Resolution of staphylococcus aureus biofilm infection using vaccination and antibiotic treatment. Infect Immun. 2011;79:1797–1803. doi: 10.1128/IAI.00451-10. [DOI] [PMC free article] [PubMed] [Google Scholar]
- Brandwood A, Noble KR, Schindhelm K. Phagocytosis of carbon particles by macrophages invitro. Biomaterials. 1992;13:646–648. doi: 10.1016/0142-9612(92)90035-m. [DOI] [PubMed] [Google Scholar]
- Breuer K, Wittmann M, Kempe K, Kapp A, Mai U, Dittrich-Breiholz O, Kracht M, Mrabet-Dahbi S, Werfel T. Alpha-toxin is produced by skin colonizing staphylococcus aureus and induces a t helper type 1 response in atopic dermatitis. Clin Exp Allergy. 2005;35:1088–1095. doi: 10.1111/j.1365-2222.2005.02295.x. [DOI] [PubMed] [Google Scholar]
- Chen X, Oppenheim JJ, Howard OMZ. Balb/c mice have more cd4(+)cd25(+) t regulatory cells and show greater susceptibility to suppression of their cd4(+)cd25(−) responder t cells than c57bl/6 mice. J Leukoc Biol. 2005;78:114–121. doi: 10.1189/jlb.0604341. [DOI] [PubMed] [Google Scholar]
- Chow CC, Clermont G, Kumar R, Lagoa C, Tawadrous Z, Gallo D, Betten B, Bartels J, Constantine G, Fink MP, Billiar TR, Vodovotz Y. The acute inflammatory response in diverse shock states. Shock. 2005;24:74–84. doi: 10.1097/01.shk.0000168526.97716.f3. [DOI] [PubMed] [Google Scholar]
- Cogan NG. Effects of persister formation on bacterial response to dosing. J Theor Biol. 2006;238:694–703. doi: 10.1016/j.jtbi.2005.06.017. [DOI] [PubMed] [Google Scholar]
- Coxon A, Tang T, Mayadas TN. Cytokine-activated endothelial cells delay neutrophil apoptosis in vitro and in vivo: a role for granulocyte/macrophage colony-stimulating factor. J Exp Med. 1999;190:923–933. doi: 10.1084/jem.190.7.923. [DOI] [PMC free article] [PubMed] [Google Scholar]
- Day J, Rubin J, Vodovotz Y, Chow CC, Reynolds A, Clermont G. A reduced mathematical model of the acute inflammatory response II. Capturing scenarios of repeated endotoxin administration. J Theor Biol. 2006;242:237–256. doi: 10.1016/j.jtbi.2006.02.015. [DOI] [PubMed] [Google Scholar]
- Delves PJ, Roitt IM. Advances in immunology: the immune system—first of two parts. N Engl J Med. 2000a;343:37–49. doi: 10.1056/NEJM200007063430107. [DOI] [PubMed] [Google Scholar]
- Delves PJ, Roitt IM. Advances in immunology: the immune system—second of two parts. N Engl J Med. 2000b;343:108–117. doi: 10.1056/NEJM200007133430207. [DOI] [PubMed] [Google Scholar]
- Dinges MM, Orwin PM, Schlievert PM. Exotoxins of staphylococcus aureus. Clin Microbiol Rev. 2000;13:16–34. doi: 10.1128/cmr.13.1.16-34.2000. [DOI] [PMC free article] [PubMed] [Google Scholar]
- Edelson PJ, Zwiebel R, Cohn ZA. Pinocytic rate of activated macrophages. J Exp Med. 1975;142:1150–1164. doi: 10.1084/jem.142.5.1150. [DOI] [PMC free article] [PubMed] [Google Scholar]
- Gammack D, Ganguli S, Marino S, Segovia-Juarez J, Kirschner DE. Understanding the immune response in tuberculosis using different mathematical models and biological scales. Multiscale Model Simul. 2005;3:312–345. [Google Scholar]
- Gilbert P, Collier PJ, Brown MR. Influence of growth rate on susceptibility to antimicrobial agents: biofilms, cell cycle, dormancy, and stringent response. Antimicrob Agents Chemother. 1990;34:1865–1868. doi: 10.1128/aac.34.10.1865. [DOI] [PMC free article] [PubMed] [Google Scholar]
- Gould IM, David MZ, Esposito S, Garau J, Lina G, Mazzei T, Peters G. New insights into meticillin-resistant staphylococcus aureus (mrsa) pathogenesis, treatment and resistance. Int J Antimicrob Agents. 2012;39:96–104. doi: 10.1016/j.ijantimicag.2011.09.028. [DOI] [PubMed] [Google Scholar]
- Harro JM, Peters BM, O’May GA, Archer N, Kerns P, Prabhakara R, Shirtliff ME. Vaccine development in staphylococcus aureus: taking the biofilm phenotype into consideration. Fems Immunol Med Microbiol. 2010;59:306–323. doi: 10.1111/j.1574-695X.2010.00708.x. [DOI] [PMC free article] [PubMed] [Google Scholar]
- Herald MC. General model of inflammation. Bull Math Biol. 2010;72:765–779. doi: 10.1007/s11538-009-9468-9. [DOI] [PubMed] [Google Scholar]
- Huhn RD, Radwanski E, Gallo J, Affrime MB, Sabo R, Gonyo G, Monge A, Cutler DL. Pharmacodynamics of subcutaneous recombinant human interleukin-10 in healthy volunteers. Clin Pharmacol Ther. 1997;62:171–180. doi: 10.1016/S0009-9236(97)90065-5. [DOI] [PubMed] [Google Scholar]
- Kumar R, Clermont G, Vodovotz Y, Chow CC. The dynamics of acute inflammation. J Theor Biol. 2004;230:145–155. doi: 10.1016/j.jtbi.2004.04.044. [DOI] [PubMed] [Google Scholar]
- Marino S, Hogue IB, Ray CJ, Kirschner DE. A methodology for performing global uncertainty and sensitivity analysis in systems biology. J Theor Biol. 2008;254:178–196. doi: 10.1016/j.jtbi.2008.04.011. [DOI] [PMC free article] [PubMed] [Google Scholar]
- Marino S, Kirschner DE. The human immune response to mycobacterium tuberculosis in lung and lymph node. J Theor Biol. 2004;227:463–486. doi: 10.1016/j.jtbi.2003.11.023. [DOI] [PubMed] [Google Scholar]
- Marino S, Pawar S, Fuller CL, Reinhart TA, Flynn JL, Kirschner DE. Dendritic cell trafficking and antigen presentation in the human immune response to mycobacterium tuberculosis. J Immunol. 2004;173:494–506. doi: 10.4049/jimmunol.173.1.494. [DOI] [PubMed] [Google Scholar]
- Matsui H, Ito T, Ohnishi SI. Phagocytosis by macrophages 3. Effects of heat-labile opsonin and poly(l-lysine) J Cell Sci. 1983;59:133–143. doi: 10.1242/jcs.59.1.133. [DOI] [PubMed] [Google Scholar]
- McKay MD, Beckman RJ, Conover WJ. A comparison of three methods for selecting values of input variables in the analysis of output from a computer code. Technometrics. 1979;21:239–245. [Google Scholar]
- Moura R, Tjwa M. Platelets suppress t(reg) recruitment. Blood. 2010;116:4035–4037. doi: 10.1182/blood-2010-09-303396. [DOI] [PubMed] [Google Scholar]
- Prabhakara R, Harro JM, Leid JG, Harris M, Shirtliff ME. Murine immune response to a chronic staphylococcus aureus biofilm infection. Infect Immun. 2011a;79:1789–1796. doi: 10.1128/IAI.01386-10. [DOI] [PMC free article] [PubMed] [Google Scholar]
- Prabhakara R, Harro JM, Leid JG, Keegan AD, Prior ML, Shirtliff ME. Suppression of the inflammatory immune response prevents the development of chronic biofilm infection due to methicillin-resistant staphylococcus aureus. Infect Immun. 2011b;79:5010–5018. doi: 10.1128/IAI.05571-11. [DOI] [PMC free article] [PubMed] [Google Scholar]
- Proctor RA, Kahl B, von Eiff C, Vaudaux P, Lew DP, Peters G. Staphylococcal small colony variants have novel mechanisms for antibiotic resistance. Clin Infect Dis. 1998;27:S68–74. doi: 10.1086/514906. ID: unige:7527. [DOI] [PubMed] [Google Scholar]
- Reynolds A, Rubin J, Clermont G, Day J, Vodovotz Y, Ermentrout GB. A reduced mathematical model of the acute inflammatory response: I. Derivation of model and analysis of anti-inflammation. J Theor Biol. 2006;242:220–236. doi: 10.1016/j.jtbi.2006.02.016. [DOI] [PubMed] [Google Scholar]
- Shirtliff ME, Calhoun JH, Mader JT. Comparative evaluation of oral levofloxacin and parenteral nafcillin in the treatment of experimental methicillin-susceptible staphylococcus aureus osteomyelitis in rabbits. J Antimicrob Chemother. 2001;48:253–258. doi: 10.1093/jac/48.2.253. [DOI] [PubMed] [Google Scholar]
- Shirtliff ME, Mader JT, Camper AK. Molecular interactions in biofilms. Chem Biol. 2002;9:859–871. doi: 10.1016/s1074-5521(02)00198-9. [DOI] [PubMed] [Google Scholar]
- Shirtliff ME, O’May G, Leid J. Protective vaccine against staphylococcus aureus biofilms comprising cell wall-associated immunogens. US 08318180 United States Patent. 2012
- Sinha P, Ghosh AK, Das T, Sa G, Ray PK. Protein a of staphylococcus aureus evokes th1 type response in mice. Immunol Lett. 1999;67:157–165. doi: 10.1016/s0165-2478(98)00187-4. [DOI] [PubMed] [Google Scholar]
- Spector WS. Cell Division Frequency: Microorganisms. Saunders; Saunders, Philadelphia: 1956. pp. 96–97. [Google Scholar]
- Stewart PS. Diffusion in biofilms. J Bacteriol. 2003;185:1485–1491. doi: 10.1128/JB.185.5.1485-1491.2003. [DOI] [PMC free article] [PubMed] [Google Scholar]
- Stewart PS, Costerton JW. Antibiotic resistance of bacteria in biofilms. Lancet. 2001;358:135–138. doi: 10.1016/s0140-6736(01)05321-1. [DOI] [PubMed] [Google Scholar]
- Thien-Fah Maha C, O’Toole GA. Mechanisms of biofilm resistance to antimicrobial agents. Trends Microbiol. 2001;9:34–39. doi: 10.1016/s0966-842x(00)01913-2. [DOI] [PubMed] [Google Scholar]
- Vettermann C, Castor D, Mekker A, Gerrits B, Karas M, Jack HM. Proteome profiling suggests a pro-inflammatory role for plasma cells through release of high-mobility group box 1 protein. Proteomics. 2011;11:1228–1237. doi: 10.1002/pmic.201000491. [DOI] [PubMed] [Google Scholar]
- Wigginton JE, Kirschner D. A model to predict cell-mediated immune regulatory mechanisms during human infection with mycobacterium tuberculosis. J Immunol. 2001;166:1951–1967. doi: 10.4049/jimmunol.166.3.1951. [DOI] [PubMed] [Google Scholar]