Abstract

Near-infrared (NIR) persistent luminescence nanoparticles (PLNPs), possessing unique NIR PL properties, have recently emerged as important materials for a wide variety of applications in chemistry and biology, for which they must endure high-temperature solid-state annealing reactions and subsequent complicated physical post-treatments. Herein, we report on a first direct aqueous-phase chemical synthesis route to NIR PLNPs and present their enhanced in vivo renewable NIR PL. Our method leads to monodisperse PLNPs as small as ca. 8 nm. Such sub-10 nm nanocrystals are readily dispersed and functionalized, and can form stable colloidal solutions in aqueous solution and cell culture medium for biological applications. Under biotissue-penetrable red-light excitation, we found that such nanocrystals possess superior renewable PL photoluminescence in vitro and in vivo compared to their larger counterparts currently made by existing methods. We believe that this solid-state-reaction-free chemical approach overcomes the current key roadblock in regard to PLNP development, and thus will pave the way to broad use of these advanced miniature “luminous pearls” in photonics and biophotonics.
Persistent luminescence (PL), also called afterglow/long-lasting phosphorescence, has been known to mankind for more than 1000 years.1 In ancient Chinese tales of legend, the Seven Fairies use “luminous pearls” to store the sunlight during daytime and use it as a light source after sunset to weave the rose clouds of the dawn. Today, persistent bulk materials that possess PL properties are used in a wide variety of applications, such as luminous displays, fiber-optic thermometers, and forensic/military identification markers.1−4 More importantly, state-of-the-art studies have explored advanced biomedical applications for their near-infrared (NIR) counterparts, NIR persistent luminescence nanoparticles (PLNPs), that can emit PL in the optical bioimaging window (∼650–1000 nm) for hours, or even days, after cessation of excitation.5,6 The temporal separation of excitation and luminescence properties of these PLNPs makes them ideal as in vivo optical imaging contrast reagents. Specifically, in bioimaging applications, NIR PLNPs enable highly sensitive in vivo optical detection by avoidance of tissue autofluorescence. These optical nanoprobes have gained considerable attention as a new generation of advanced biophotonic materials.5,7−9 Usually, NIR PL requires ultraviolet (UV) light to input energy. However, owing to the rather limited tissue penetration depth of UV light, these PL materials had to be pre-charged in vitro.10−12 To address this problem, NIR-photostimulated persistent LiGa5O8:Cr3+ was reported.13,14 In that case, the LiGa5O8:Cr3+ particles still needed be excited by UV light before injection to pre-store the energy. Afterward, NIR light was able to stimulate the release of pre-charged energy in deep energy traps. However, this photostimulated emission kept decaying, continued to weaken after each cycle of photostimulation, and was finally extinguished. Recently, ZnGa2O4:Cr3+ (ZGC) was found to be activated by using biotissue-penetrable red light in a mouse model, which means that energy can be renewed and NIR PL imaging is no longer limited by the luminescence-decay lifetime of the PLNPs.13
Despite such developments in solving renewable PL energy in vivo, advances in development of PLNPs have been hampered by their synthetic methods. Prior to this work, fabrication of NIR ZGC PLNPs required solid-state-annealing at extremely high temperatures and complicated physical methods to convert as-synthesized large bulk crystals into nanosized particles.2,5−7,14 As a result, these particles were usually heterogeneous and relatively larger, and formed agglomerates fast in solution. In addition, a key requirement for bioimaging applications is that the nanocrystals be biocompatible, which means that they need to be comparable in size to the biomolecules they are labeling, so as not to interfere with cellular systems.15,16 However, to the best of our knowledge, no studies have been done on the direct aqueous-phase chemical synthesis of NIR PL materials, not to mention sub-10 nm NPs. Thus, a solid-state-reaction-free chemical method that can generate monodisperse sub-10 nm ZGC PLNPs is desirable.
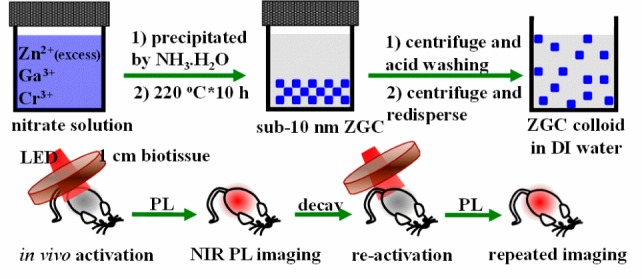
Hydrothermal synthesis refers to chemical reactions of substances in a sealed heated solution above ambient temperature and pressure.17 This technique is one of the widely used technologies to produce nanocrystals.18,19 Herein, we report that water-soluble ZnGa2O4Cr0.004 PLNPs, with sub-10 nm size and intense PL properties, can be directly synthesized in aqueous solution by a hydrothermal method. The specific solution-phase reaction procedure and imaging applications of ZGC PLNPs in our study are outlined in Scheme 1.
Scheme 1. Schematic Illustration of the Synthesis and Repeated in Vivo Simulated Deep-Tissue Imaging of ZGC PLNPs.
Initially, we attempted to prepare PLNPs by using a hydrothermal process at 220 °C for 10 h with a Zn:Ga:Cr molar ratio of 1:2:0.004. Under these conditions, we find that ZGC nanocrystals are obtained with an average size of ∼18 nm. We then systemically varied precursor composition (from 0.7:2:0.004, 1:2:0.004 to 2:2:0.004) to adjust the size of the PLNPs. The results show that the molar ratio of Zn/Ga is critical to the size of the as-synthesized PLNPs (Figure S1). Under a Zn/Ga molar ratio of 2:2, ZGC PLNPs are generated with a narrow size distribution and an average size of 8 ± 4 nm (denoted as ZGC-1; Figure 1A). The ultrasmall size was further confirmed by analysis of the full width at half-maximum values of the XRD diffraction peaks and by the Schërrer equation, with an average calculated particle size of 8.7 ± 2.4 nm for ZGC-1(Figure S2). As shown in Figure 1B, as-synthesized ZGC-1 has a clear lattice fingerprint of a (311) plane of cubic ZnGa2O4. The result of the selected area’s electron diffraction (SAED), as shown in Figure 1C, indicates that the ZGC NPs have a clear single-crystal cubic spinel structure. The formation of a pure cubic spinel phase ZnGa2O4 with a Fd3̅m space group was also confirmed by the analysis of its XRD pattern (JCPDS card no. 01-082-0466; Figure 1D and Figure S2). Although an excess amount of Zn(NO3)2 was used during the hydrothermal procedure, a nearly theoretical molar ratio of Zn/Ga/O was obtained from the energy dispersive X-ray spectrum (Figure S3). This is likely a result of the well-established knowledge that excess Zn2+ can be readily dissolved during synthesis by the formation of soluble ammonium complexes, and/or as a possible ZnO impurity was later removed by a washing procedure with hydrochloride solution. It is noted that the absence of Cr ions in Figure S3 is a result of its much lower doping concentration relative to Zn and Ga ions, which is similar to the prior literatures.2,5,20,21
Figure 1.
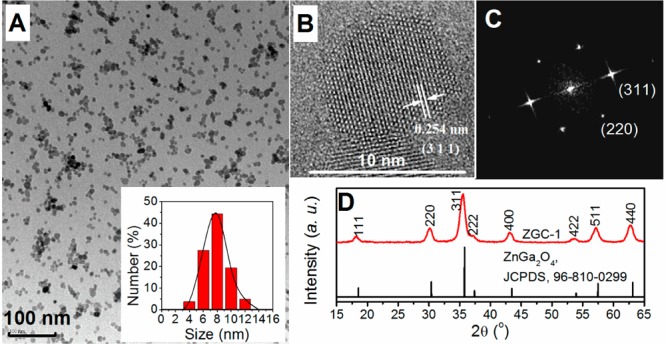
Properties of ZGC-1. (A) TEM image and size distribution, (B) HR-TEM image of a single crystal, (C) single-crystal SAED pattern, and (D) X-ray diffraction pattern.
Good colloidal stability is usually a premise for biomedical applications. The disperse stability of ZGC-1 was performed in DI water and cell medium and analyzed relative to ZGC-2 samples that were synthesized by high-temperature annealing methods.13 We discovered that ZGC-1 readily re-disperses in DI water to form a transparent colloidal solution. Dynamic light scattering analysis was used to analyze the size of ZGC-1 in aqueous solution. We found a narrow mean hydrodynamic size distribution of 9.3 ± 2.6 nm for the as-synthesized ZGC-1 colloid. No significant change was observed even after storing for one month (Figure 2). In contrast to ZGC-1, apparent precipitation can be seen within 30 min after dispersing ZGC-2 in DI water (Figure S5). The zeta potential of ZGC-1 was measured as −26.6 mV, which may result in colloidal stability in aqueous solution because of the electrostatic repulsion of colloidal NPs. ZGC-1 is also stable when dispersed in cell culture medium without any precipitate (Figures S6 and S7). Such stable and monodispersed attributes are premises for further surface functionalization of NPs. To advance the surface modification for potential advanced applications, we found that ZGC-1 can also be further modified with functional groups, such as polymer (i.e., polyethylenimine) or protein (i.e., bovine serum albumin) (Figures S8 and S9).
Figure 2.
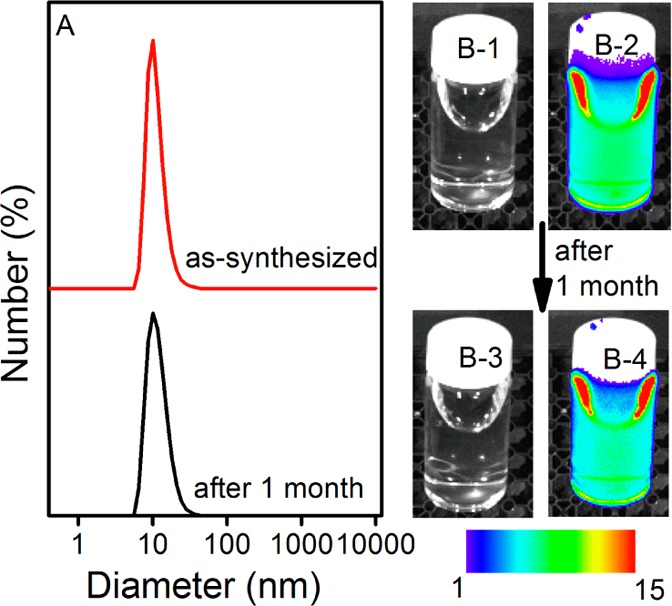
Disperse stability of ZGC-1 in DI water. (A) Dynamic light scattering patterns of ZGC-1 in DI water before and after storage for 1 month. (B-1, B-3) bright field and (B-2, B-4) corresponding luminescence pictures of ZGC-1 in DI-water. Persistent luminescence intensity is expressed in false color units (1 unit = 2 × 10⁷ photons·s–1·cm–2·sr) for all images.
Next, we systematically studied the PL properties of ZGC-1 under diverse excitation wavelengths ranging 500–650 nm by using a xenon lamp in a fluorimeter as the light source without any corrections made (Figure S10). The results indicate that the PL decay curves of the ZGC-1 can be excited by wavelengths as far as 650 nm. Importantly, during five repeated excitation and decay cycles at 650 nm, we found that the PL intensity of ZGC-1 was nearly double relative to ZGC-2 30 s after excitation ceased (Figure 3).
Figure 3.
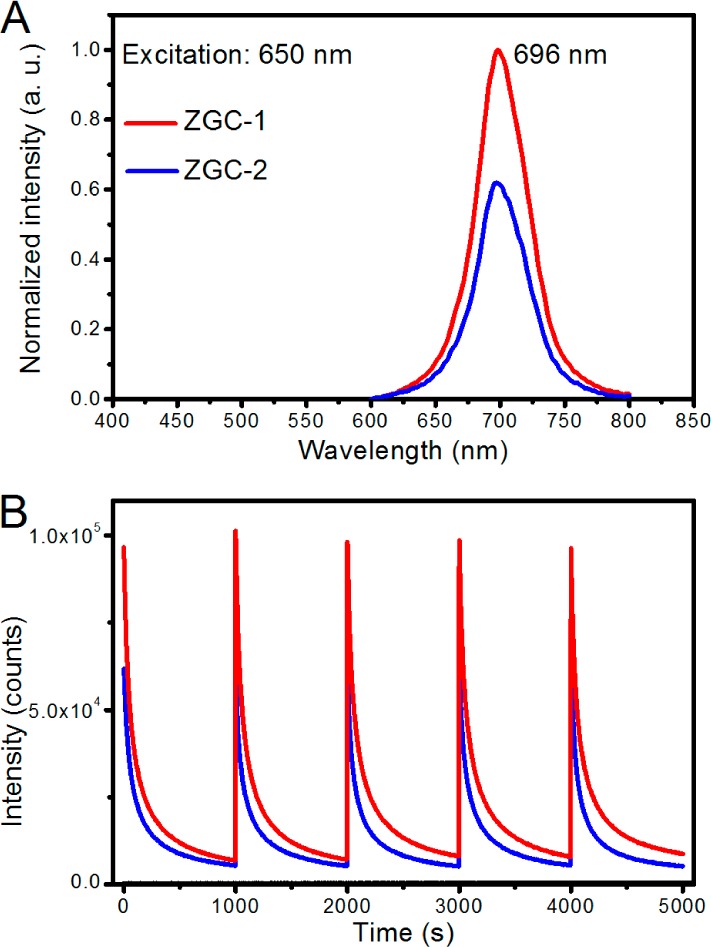
Superior PL properties of ZGC-1. (A) PL spectra and (B) decay curves of ZGC-1 and ZGC-2 excited at 650 nm for 200 s by using a xenon lamp as the light source. PL spectra and decay curves were recorded 30 s after excitation ceased. Sample mass = 100 mg.
A comparison imaging experiment between ZGC-1 and ZGC-2 was performed both in vitro and in vivo by using a commercial white LED (5000 lm, CREE-T6) as a light source. By applying the ROI tools of the imaging device, we analyzed the charging ability of ZGC-1 versus ZGC-2. Both the in vitro and in vivo imaging results indicate an increase of PL intensity of ZGC-1 by a factor of 2.7 and a high signal-to-background ratio of 275, as shown in Figure S11. Simulated deep-tissue imaging was further performed with live mouse models covered by a pork slab ∼1 cm thick (Figure S12). The PL of ZGC-2 could hardly be observed under our simulated deep-tissue environment, whereas ZGC-1 still provides clear, quality images (Figure 4A,B). Such PL signal gradually decreases in 30 min after excitation without influencing the next imaging cycle and it then can be reactivated at a desired time to provide PL images (Figure 4C–H).
Figure 4.
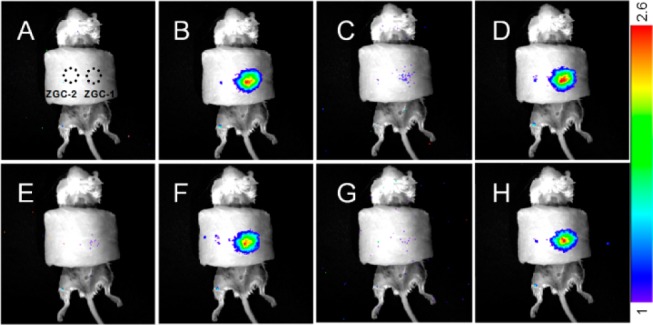
Comparative deep tissue imaging of ZGC-1 and ZGC-2. (A,B) Deep tissue in vivo imaging before and after in situ excitation. (C–H) Repeated imaging before and after second, third, and fourth in situ excitations, time interval = 30 min. Excitation with a white LED (5000 lm) light source for 30 s. Persistent luminescence intensity is expressed in false color units (1 unit = 4350 photons·s–1·cm–2·sr) for all images.
Further, a post-hydrothermal treatment was performed to study whether the hydrothermal process leads to the brighter PL of ZGC. To do so, annealed ZGC-2 was dispersed in aqueous ammonium solution (pH ∼9–9.5) and then a hydrothermal process was performed at 220 °C for 10 h to afford ZGC-3 without adding ZGC precursors (Figure S13). Surprisingly, the resulting PLNPs ZGC-3, whose size is similar to that of ZGC-2, possess significantly increased PL intensity (30 s after the stop of the excitation) by a factor of ∼6 relative to ZGC-2 (Figure 5). This finding clearly suggests that the hydrothermal process indeed serves as an efficient method to improve PL intensity of traditional PLNPs made by solid-state reactions.
Figure 5.
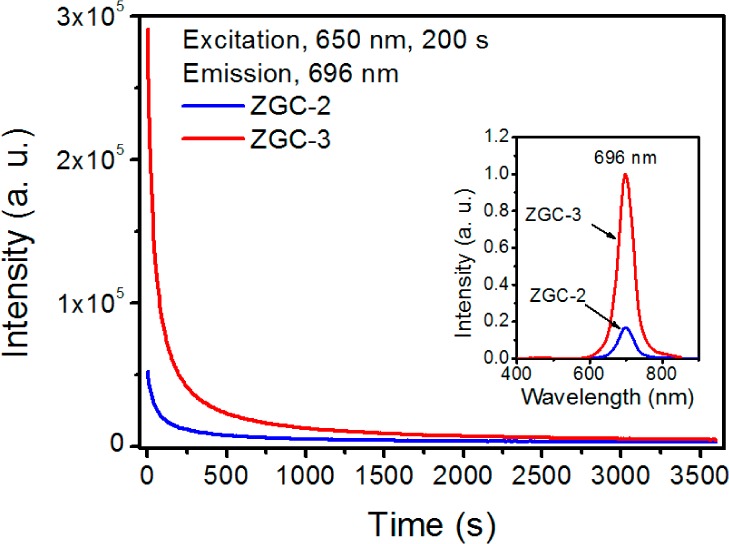
PL decay curves of ZGC-2 and ZGC-3. Inset is the PL spectra excited by using the internal xenon lamp of a fluorimeter. The decay curves and PL spectra were recorded 30 s after the stop of the excitation. Sample mass = 100 mg.
We propose a possible mechanism in accordance with our results, as shown in Figure S14. The excitation of PL by visible light relies on absorption of Cr3+ and subsequent trapping of the excitation energy in local energy traps (Figure S14A). On the other hand, surface defects compete with the traps by absorbing the excitation energy and dissipating it through non-radiative transitions.22,23 Due to the absence of proper solvents and chelating reagents which are abundant in solution phase reactions (e.g., hydrothermal reactions), the mass-transfer process, in solid-state annealing reactions is quite slow and leads to more surface defects than solution phase reaction. Moreover, this situation is even worse in the case of milled NPs owing to mechanically broken facets that occur during milling, which leads to weaker optical properties (Figure S14B). Similar results have been reported in other grinded phosphors.24 During the hydrothermal process, the abundance of solvent molecules and chelating reagents facilitate the transformation from amorphous species to well-organized crystal lattice and generates more regular morphologies and complete crystal facets. This advantage has been widely used in the synthesis of various metal-oxide crystals with regular morphologies, such as ZnO, TiO2, and Fe2O3.25−27 In addition, the aqueous process avoids potential mechanical damage to the crystal surface. Thus, ZGC-1 may have fewer surface defects than ZGC-2 and possess relatively better PL properties even their sizes are smaller.28,29
In sum, monodisperse sub-10 nm NIR PLNPs are generated directly through aqueous hydrothermal reaction. Not only do the nanocrystals have an ultrasmall sub-10 nm size, they also possess intense PL properties under red-light excitation and can be easily dispersed in DI water or cell medium to form stable, transparent colloidal solutions. Further, their surfaces are readily modified with functional molecules. The PL emission of the nanocrystals can be repeatedly charged under 1-cm-deep tissue simulation and outperforms that of their existing annealed counterparts. In addition, our method can also be applied to enhance the PL ability of traditional annealed ZGC up to ∼6 times by using a simple post-hydrothermal treatment. Owing to such direct chemical solution-based synthetic conditions, ultrasmall particle size, narrow size distribution, and robust PL intensity, our ZGC-1 nanocrystals have great potential to improve the performance of NIR persistent phosphors. Compared to other existing in vivo optical imaging probes, PLNPs possess an outstanding signal-to-noise-ratio with no need for the excitation resource (light) during imaging, and they can be directly adapted for use in commercially available imaging systems (Table S1). This approach represents a significant step in the development of PLNPs and will lead to the broad use of these advanced materials in various research fields.
Acknowledgments
This research was supported by the National Institutes of Health R01MH103133, and the Human Frontier Science Program. HR-TEM was done at Pacific Northwest National Laboratory via Battelle Memorial Institute for the U.S. Department of Energy under Contract DE-AC05-76RL01830
Supporting Information Available
Experimental details; TEM, XRD, and PL decay curves (ZGC-1) at various concentrations of Cr3+; modification with PEI and BSA; and proposed mechanism. This material is available free of charge via the Internet at http://pubs.acs.org.
The authors declare no competing financial interest.
Funding Statement
National Institutes of Health, United States
Supplementary Material
References
- Van den Eeckhout K.; Smet P. F.; Poelman D. Materials 2010, 3, 2536. [Google Scholar]
- Pan Z. W.; Lu Y. Y.; Liu F. Nat. Mater. 2012, 11, 58. [DOI] [PubMed] [Google Scholar]
- Van den Eeckhout K.; Poelman D.; Smet P. Materials 2013, 6, 2789. [DOI] [PMC free article] [PubMed] [Google Scholar]
- Zhuang Y. X.; Katayama Y.; Ueda J.; Tanabe S. Opt. Mater. 2014, 36, 1907. [Google Scholar]
- Abdukayum A.; Chen J. T.; Zhao Q.; Yan X. P. J. Am. Chem. Soc. 2013, 135, 14125. [DOI] [PubMed] [Google Scholar]
- Liu F.; Yan W. Z.; Chuang Y. J.; Zhen Z. P.; Xie J.; Pan Z. W. Sci. Rep.-UK 2013, 3, 1554. [DOI] [PMC free article] [PubMed] [Google Scholar]
- De Chermont Q. L. M.; Chaneac C.; Seguin J.; Pelle F.; Maitrejean S.; Jolivet J. P.; Gourier D.; Bessodes M.; Scherman D. Hum. Gene Ther. 2007, 18, 1058. [Google Scholar]
- Maldiney T.; Lecointre A.; Viana B.; Bessiere A.; Bessodes M.; Gourier D.; Richard C.; Scherman D. J. Am. Chem. Soc. 2011, 133, 11810. [DOI] [PubMed] [Google Scholar]
- Chuang Y.-J.; Zhen Z.; Zhang F.; Liu F.; Mishra J. P.; Tang W.; Chen H.; Huang X.; Wang L.; Chen X.; Xie J.; Pan Z. Theranostics 2014, 4, 1112. [DOI] [PMC free article] [PubMed] [Google Scholar]
- Allix M.; Chenu S.; Veron E.; Poumeyrol T.; Kouadri-Boudjelthia E. A.; Alahrache S.; Porcher F.; Massiot D.; Fayon F. Chem. Mater. 2013, 25, 1600. [Google Scholar]
- Zhuang Y. X.; Ueda J.; Tanabe S. J. Mater. Chem. C 2013, 1, 7849. [Google Scholar]
- Li Y.; Zhou S. F.; Li Y. Y.; Sharafudeen K.; Ma Z. J.; Dong G. P.; Peng M. Y.; Qiu J. R. J. Mater. Chem. C 2014, 2, 2657. [Google Scholar]
- Maldiney T.; Bessiere A.; Seguin J.; Teston E.; Sharma S. K.; Viana B.; Bos A. J. J.; Dorenbos P.; Bessodes M.; Gourier D.; Scherman D.; Richard C. Nat. Mater. 2014, 13, 418. [DOI] [PubMed] [Google Scholar]
- Li Z. J.; Shi J. P.; Zhang H. W.; Sun M. Opt. Express 2014, 22, 10509. [DOI] [PubMed] [Google Scholar]
- Whitesides G. M. Nat. Biotechnol. 2003, 21, 1161. [DOI] [PubMed] [Google Scholar]
- Ostrowski A. D.; Chan E. M.; Gargas D. J.; Katz E. M.; Han G.; Schuck P. J.; Milliron D. J.; Cohen B. E. ACS Nano 2012, 6, 2686. [DOI] [PubMed] [Google Scholar]
- Feng S. H.; Xu R. R. Acc. Chem. Res. 2001, 34, 239. [DOI] [PubMed] [Google Scholar]
- Byrappa K.; Adschiri T. Prog. Cryst. Growth Charact. Mater. 2007, 53, 117. [Google Scholar]
- Shi W. D.; Song S. Y.; Zhang H. J. Chem. Soc. Rev. 2013, 42, 5714. [DOI] [PubMed] [Google Scholar]
- Zhuang Y. X.; Ueda J.; Tanabe S. Appl. Phys. Express 2013, 6, 052602. [Google Scholar]
- Zhuang Y. X.; Ueda J.; Tanabe S.; Dorenbos P. J. Mater. Chem. C 2014, 2, 5502. [Google Scholar]
- Wang F.; Wang J. A.; Liu X. G. Angew. Chem., Int. Ed. 2010, 49, 7456. [DOI] [PubMed] [Google Scholar]
- Shalish I.; Temkin H.; Narayanamurti V. Phys. Rev. B 2004, 69, 245401. [Google Scholar]
- Lee C. H.; Jung K. Y.; Choi J. G.; Kang Y. C. Mater. Sci. Eng. B-Solid 2005, 116, 59. [Google Scholar]
- Liu B.; Zeng H. C. J. Am. Chem. Soc. 2003, 125, 4430. [DOI] [PubMed] [Google Scholar]
- Testino A.; Bellobono I. R.; Buscaglia V.; Canevali C.; D’Arienzo M.; Polizzi S.; Scotti R.; Morazzoni F. J. Am. Chem. Soc. 2007, 129, 3564. [DOI] [PubMed] [Google Scholar]
- Hu X. L.; Yu J. C.; Gong J. M.; Li Q.; Li G. S. Adv. Mater. 2007, 19, 2324. [Google Scholar]
- Xu Y.-F.; Ma D.-K.; Guan M.-L.; Chen X.-A.; Pan Q.-Q.; Huang S.-M. J. Alloys Compd. 2010, 502, 38. [Google Scholar]
- Zheng M.; Chen X.; Lei B.; Xiao Y.; Liu R.; Zhang H.; Dong H.; Liu Y.; Liu X. ECS Solid State Lett. 2013, 2, R19. [Google Scholar]
Associated Data
This section collects any data citations, data availability statements, or supplementary materials included in this article.


