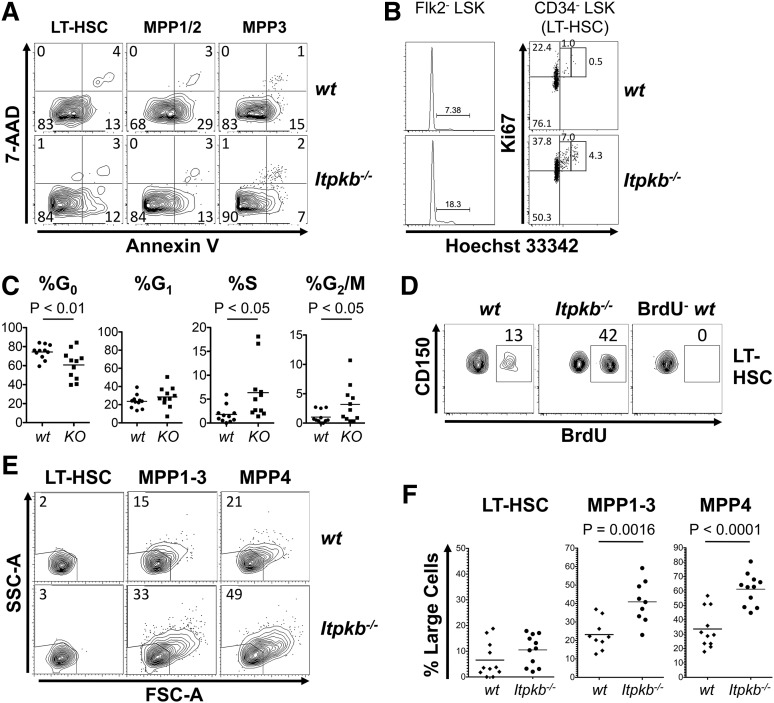
Figure 2.
Loss of HSC quiescence in Itpkb−/− mice. (A) Annexin V/7-AAD stain of the indicated phenotypic LT-HSC or MPP subsets in WT or Itpkb−/− BM. Numbers denote percent of cells per quadrant. Viable cells are double-negative. Representative of 2 independent experiments (nwt = 3; nKO =4). (B-C) Cell-cycle status of LSK Flk-2− LT-HSC/MPP1-3 and LSK CD34− LT-HSC in WT or Itpkb−/− mice, analyzed by Hoechst/Ki67 stain. (B) Representative data from 8 independent experiments. G0, Ki67−Hoechst 33342−. G1, Ki67+Hoechst 33342−. S, Ki67+Hoechst 33342int. G2/M, Ki67+Hoechst 33342hi. Numbers denote percent of cells per gate. (C) Percent of LT-HSC per cell-cycle phase for 11 mice/genotype (horizontal bars, means). KO, Itpkb−/−; WT, wild type. Statistical significance was determined by paired Student t test. (D) In vivo BrdU incorporation in LSK CD34− LT-HSC in WT or Itpkb−/− mice during a 2-hour pulse. Numbers denote percent of BrdU+ cells. BrdU−, uninjected WT control. Representative of 2 independent experiments. (E-F) Forward (FSC-A)/side-scatter (SSC-A) analysis of LSK CD34−CD150+ LT-HSC, LSK CD34+Flk-2− MPP1-3, and LSK CD34+Flk-2+ MPP4 in WT or Itpkb−/− BM. (E) Representative data from 5 independent experiments. Numbers denote percent of cells per gate. (F) Pooled data with means (horizontal lines) and P values for the indicated comparisons (unpaired t test; n = 11).

