Figure 3.
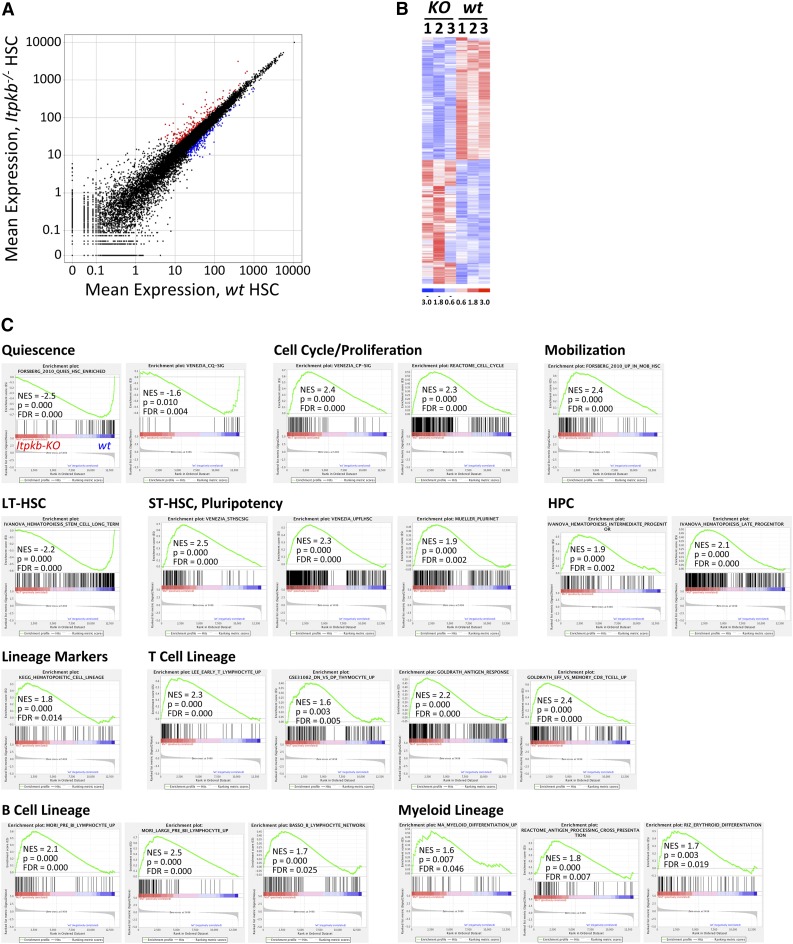
Downregulation of quiescence and stemness-associated, upregulation of proliferation, mobilization, and differentiation-associated mRNAs in Itpkb−/− LT-HSC. The mRNA from 3 separate pools of Itpkb−/− or WT BM LSK CD34−CD150+CD48−Flk2− LT-HSC was analyzed by whole-transcriptome sequencing. (A) Scatter plot of mean expression for 23 998 transcripts (supplemental Table 3) in Itpkb−/− vs WT LT-HSC. Colors denote 441 significance-filtered mRNAs upregulated >1.4-fold in Itpkb−/− (red) or WT (blue) LT-HSC (supplemental Table 2). (B) Clustered heat map of log-transformed, normalized expression values in each sample for the 441 mRNAs. Red, upregulated, blue, downregulated over sample median (= 0). (C) GSEA results for the 23 998 transcripts. The results for significantly Itpkb−/− (NES >0) or WT LT-HSC (NES <0) enriched gene sets associated with the biological processes listed above each group are shown here and in supplemental Figure 1. Gene set descriptions are shown in supplemental Table 5. In the plots, all 23 998 transcripts are statistically rank-ordered left-to-right by decreasing relative expression level in Itpkb−/− vs WT LT-HSC. Gray histograms show phenotype correlation values for the ranked genes as signal-to-noise ratios. These are positive for mRNAs enriched in Itpkb−/− LT-HSC and negative for mRNAs enriched in WT LT-HSC. Vertical lines above the histograms denote positions of individual mRNAs within the considered gene set in the ranked list of all mRNAs. Red and blue horizontal bars mark mRNAs whose expression levels correlate positively (red, left) or negatively (blue, right) with the Itpkb−/− phenotype. Green curves show running enrichment scores for the gene set as the analysis walks down the ranked gene list. Peak asymmetry correlates with enrichment (left shift) or underrepresentation (right shift) of the respective gene set in Itpkb−/− LT-HSC. NES account for differences in gene set size and in correlations between gene sets and the expression dataset. They allow result comparison across gene sets.48 FDR, false discovery rate; NES, normalized enrichment score. P, nominal P value.48

