

Abstract
Speech production is one of the most complex human behaviors. Although brain activation during speaking has been well investigated, our understanding of interactions between the brain regions and neural networks remains scarce. We combined seed-based interregional correlation analysis with graph theoretical analysis of functional MRI data during the resting state and sentence production in healthy subjects to investigate the interface and topology of functional networks originating from the key brain regions controlling speech, i.e., the laryngeal/orofacial motor cortex, inferior frontal and superior temporal gyri, supplementary motor area, cingulate cortex, putamen, and thalamus. During both resting and speaking, the interactions between these networks were bilaterally distributed and centered on the sensorimotor brain regions. However, speech production preferentially recruited the inferior parietal lobule (IPL) and cerebellum into the large-scale network, suggesting the importance of these regions in facilitation of the transition from the resting state to speaking. Furthermore, the cerebellum (lobule VI) was the most prominent region showing functional influences on speech-network integration and segregation. Although networks were bilaterally distributed, interregional connectivity during speaking was stronger in the left vs. right hemisphere, which may have underlined a more homogeneous overlap between the examined networks in the left hemisphere. Among these, the laryngeal motor cortex (LMC) established a core network that fully overlapped with all other speech-related networks, determining the extent of network interactions. Our data demonstrate complex interactions of large-scale brain networks controlling speech production and point to the critical role of the LMC, IPL, and cerebellum in the formation of speech production network.
Keywords: speech production, resting state, large-scale networks, graph theoretical analysis, hemispheric lateralization
numerous functional brain imaging studies suggest that the production of a spoken word requires not only activation of the motor cortices but also the integration and coordination between multiple brain regions (and their respective networks) associated with various speech-related processes, such as auditory perception, semantic processing, memory encoding, and preparation for motor execution, among others (Heim 2005; Hickok and Poeppel 2007; Price 2010, 2012; Simonyan and Horwitz 2011). However, until recently, the major trend of neuroimaging studies exploring neural correlates of human speech and language control has been to use complex experimental designs to isolate and characterize functional activation patterns and/or networks related to a particular component of this complex behavior. Some of these studies explored the organization of brain networks controlling speech motor preparation and output (Eickhoff et al. 2009; Guenther et al. 2006; Horwitz and Braun 2004; Papathanassiou et al. 2000; Riecker et al. 2005; Simonyan et al. 2009; Soros et al. 2006), auditory perception (D'Ausilio et al. 2011; Rogalsky et al. 2011; Schon et al. 2010; Turkeltaub and Coslett 2010), semantic and syntactic processing (David et al. 2011; Friedrich and Friederici 2009; Prat et al. 2007; Schafer and Constable 2009; Seghier and Price 2012; Strelnikov et al. 2006). Importantly, recent studies commenced the investigation of the extent of interactions between distinct functional components within the speech-controlling networks. Examinations of speech production and comprehension networks revealed that they show an extensive overlap (Papathanassiou et al. 2000) and are coupled in the superior and middle temporal gyrus (STG/MTG), temporal pole, angular gyrus, temporal-parietal junction, inferior frontal gyrus (IFG), premotor and medial prefrontal cortex, insula, precuneus, thalamus, and caudate nucleus (Silbert et al. 2014). In addition, speech monitoring was found to be maintained by functional coupling between different speech production and comprehension networks, involving the Heschl's sulcus, parietal cortex, and supplementary motor area (SMA) (van de Ven et al. 2009). Further studies of language-related networks have mapped anticorrelated but overlapping left posterior STG and ventral anterior parietal lobe networks controlling speech production (Simmonds et al. 2014b) as well as a specific left-lateralized fronto-temporal-parietal network (FTPN) within the overlapping FTPNs of cognitive and linguistic control, which was activated during speech production but not during counting, nonverbal decision-making, or resting (Geranmayeh et al. 2014). However, despite these recent advances, our understanding of how multiple large-scale networks are being integrated during normal speaking still remains unclear.
The goals of the present study were twofold: 1) to determine the interactions between different functional brain networks originating from the key brain regions involved in the control of speech production, and 2) to examine the reorganization of these networks from the resting state to sentence production. For this, we combined seed-based interregional correlation analysis with graph theoretical analysis of functional MRI (fMRI) data during the resting state and production of grammatically correct English sentences in 20 healthy subjects. Sentence production was chosen specifically to represent human speech as a complex behavior used in everyday communication as closely as possible, which is typically not limited to articulation only but depends on a number of linguistic and cognitive functions. Hence, the brain networks examined in this study reflected, not only speech motor output, but also a range of associated speech-related processes, which are part of our normal, real-life speech production.
Methodologically, seed-based functional connectivity analysis (Biswal et al. 1995) allowed us to examine the resting state and task-related networks originating from a priori-defined brain regions based on the group activation peaks during speech production. Seed-based analysis was chosen over independent component analysis (ICA) because the latter is a fully data-driven approach not requiring an a priori choice of a seed region and yielding network components not restricted to specified brain regions (e.g., seeds) or behaviors (e.g., the left fronto-parietal component in resting-state data may encompasses both memory and language networks) (Hoptman et al. 2010; Smith et al. 2009).
We hypothesized that individual functional networks from different brain regions controlling speech production would form a shared common network, which would have a pattern topographically similar to the underlying shared resting-state network (RSN) (Biswal et al. 1995; Smith et al. 2009). We further hypothesized that, because of the complexity of human speech control, the shared network controlling speech production (SPN) would exclusively recruit fronto-parietal brain regions, associated with sensorimotor integration as well as executive and preparatory functions during complex behaviors such as speech production (Binder et al. 1997; Geranmayeh et al. 2012, 2014; Indefrey and Levelt 2004; Price 2012; Simon et al. 2002), when compared with the underlying intrinsic resting-state connectivity network.
MATERIALS AND METHODS
Subjects.
Twenty healthy volunteers (age 53.05 ± 10.43 yr, mean ± SD; 13 females, 7 males) participated in the study. All volunteers were right-handed and monolingual native English speakers. None had any history of neurological, psychiatric, voice, or respiratory problems. All subjects provided written, informed consent before participating in the study, which was approved by the Institutional Review Boards of the Icahn School of Medicine at Mount Sinai and the National Institute of Neurological Disorders and Stroke, National Institutes of Health.
Data acquisition.
Functional data were acquired on a 3.0 T GE scanner (Milwaukee, WI). Resting-state fMRI data were obtained using gradient echoplanar imaging (EPI) before the acquisition of task-production fMRI. Whole-brain functional brain images were obtained with TR = 2,000 ms, TE = 30 ms, flip angle = 90°, 33 contiguous slices, slice thickness = 4 mm, matrix size = 64 × 64 mm, and field of view (FOV) = 240 × 240 mm2, 150 volumes, total scan time 5 min. During scanning, subjects were instructed to keep their eyes closed while staying awake and avoid thinking about anything in particular. Physiological recordings were carried out using the respiratory belt to measure respiration rate and the pulse oxymeter to monitor the heart rhythm.
Speech-production fMRI followed the resting-state data acquisition. To minimize scanner noise, task-related acoustic head/orofacial motion effects, we used sparse-sampling event-related fMRI design, during which either auditory samples of English sentences (e.g., “Jack ate eight apples,” “Tom is in the army”) or periods of silence without any auditory input as a baseline condition were presented in a pseudorandomized order as reported earlier (Simonyan and Ludlow 2010; Simonyan et al. 2009, 2013). Subjects were asked to listen to the auditory task delivered through the MR-compatible headphones (Silent Scan Audio System; Avotec, Stuart, FL) within a 3.6-s period and, when cued by an arrow, produce the task (i.e., repeat the sentence once or rest) within a 5-s period, followed by a 2-s whole-brain volume acquisition. Thirty-six gradient EPI volumes per functional run were acquired with TR = 10.6 s (8.6-s delay for task/baseline plus 2-s acquisition), TE = 30 ms, flip angle = 90°, 33 contiguous slices, slice thickness = 4 mm, matrix size = 64 × 64 mm, FOV = 240 × 240 mm2. During each functional run, 10 sentences and 16 baseline conditions were performed; a total of 5 functional runs was acquired in each subject.
A high-resolution T1-weighted image was acquired for anatomical reference using magnetization-prepared gradient echo sequence pulse sequence with TI = 450 ms, TE = 3 ms, flip angle = 10°, FOV = 240 × 240 mm2, matrix size = 256 × 256 mm, 124 axial slices, slice thickness = 1.2 mm.
Data preprocessing.
Data were analyzed using AFNI (Cox 1996) and FreeSurfer (Fischl et al. 1999) software packages. All graph theoretic computations were performed in Matlab 8.1 (MathWorks 2013) using the Brain Connectivity Toolbox (Rubinov and Sporns 2010).
Resting-state fMRI.
After removal of the first four volumes to ensure steady-state equilibrium of the MRI signal, the resulting time series with the length of 146 volumes in each subject were slice-time corrected, and the EPI volumes were registered to the volume collected closest in time to the acquisition of an anatomical image. Anatomy-related noise signal in the lateral ventricles and white matter (WM) was regressed out based on the anatomy-based correlation correction (ANATAICOR) model (Jo et al. 2010). For this, individual high-resolution anatomical images were tissue segmented into the gray matter (GM), WM, and lateral ventricle (LV) masks and resampled to the EPI resolution. The WM and LV masks were then eroded to reduce partial volume effects of GM on these masks, and local noise-time series of eroded WM were estimated to regress out the anatomy-related noise signal. Physiological noise was regressed out using the retrospective image correction (RETROICOR) model (Glover et al. 2000). The resultant images were spatially smoothed within the GM mask with a 6-mm full-width at half-maximum (FWHM) kernel and spatially normalized to the standard AFNI space of Talairach-Tournoux.
Task-production fMRI.
After removal of the first two volumes, initial image preprocessing of time series with the length of 120 volumes in each subject consisted of EPI registration, smoothing with a 6-mm FWHM kernel, voxelwise signal intensity normalization, and multiple linear regression with a single regressor for speech task convolved with a hemodynamic response function and motion parameter estimates as regressors of no interest. For group analysis, all subject datasets were spatially normalized to the standard space followed by two-way mixed-effect design ANOVA with subject as the random factor and task as the fixed factor at P ≤ 0.05 adjusted for family-wise error (FWE) using Monte-Carlo simulations (Forman et al. 1995).
Functional connectivity analysis.
Network analysis of both resting-state and speech-production fMRI was carried out using seed-based interregional correlation analysis (Biswal et al. 1995). Because we were specifically interested in the organization of speech networks, 14 regions of interest (ROIs; 7 in each hemisphere) were selected a priori based on the group activation peaks observed during sentence production, which were in agreement with previous studies on speech production (for review, see Price 2012). These ROIs included the laryngeal/orofacial primary motor cortex (LMC; area 4p), IFG (area 44), SMA (area 6), STG (area 41), cingulate cortex (CC, area 32), putamen, and ventral thalamus. Four-millimeter spherical seed regions were placed at the peaks of group activation of 14 ROIs during sentence production (Table 1, Fig. 1). The same seeds were applied to the resting-state fMRI data. In each subject, time series were extracted from each seed ROI during resting and speaking, respectively, and submitted to seed-based interregional connectivity analysis using Pearson's correlation coefficients between each seed region and the whole brain to map the full extent of each seed-based network. All obtained voxelwise correlation coefficients were transformed into Fisher's z-scores. For each seed region, group statistical parametric maps were generated using between-subject t-tests and thresholded at FWE-corrected P ≤ 0.05 to limit our further analysis of the shared network to significant voxels in each contributing network only. All thresholded group seed maps were converted into the corresponding binary masks with only significant voxels above the statistical threshold receiving a value of 1. The resultant binary masks were averaged to create a common condition-specific network shared among all seed networks for that condition (i.e., rest or speech). In the output map, any voxel with a value ≥2 was considered to contribute to the shared network, i.e., two or more seed networks shared that voxel. In addition, the distribution of the voxels with a value equal to 1 was considered for examination of distinct seed-specific connectivities. This procedure was performed for each RSN and SPN separately and was similar to an approach previously reported (Xu et al. 2013).
Table 1.
The location of group activation peaks during sentence production
| Region of Interest | Side | Coordinates x y z |
|---|---|---|
| Primary motor cortex (larynx region) | Left | −47 −13 32 |
| Right | 46 −10 33 | |
| Inferior frontal gyrus | Left | −54 7 24 |
| Right | 55 3 14 | |
| Supplementary motor area | Left | −1 9 64 |
| Right | 3 −9 62 | |
| Superior temporal gyrus | Left | −43 −20 8 |
| Right | 52 −13 4 | |
| Cingulate cortex | Left | −7 7 42 |
| Right | 2 9 37 | |
| Putamen | Left | −25 −8 2 |
| Right | 26 −5 3 | |
| Thalamus | Left | −11 −20 1 |
| Right | 15 −17 1 |
Spherical seed regions (4 mm) were placed at the peaks of group activation during sentence production for interregional correlation analysis of the resting-state and speech- production functional MRI.
Fig. 1.
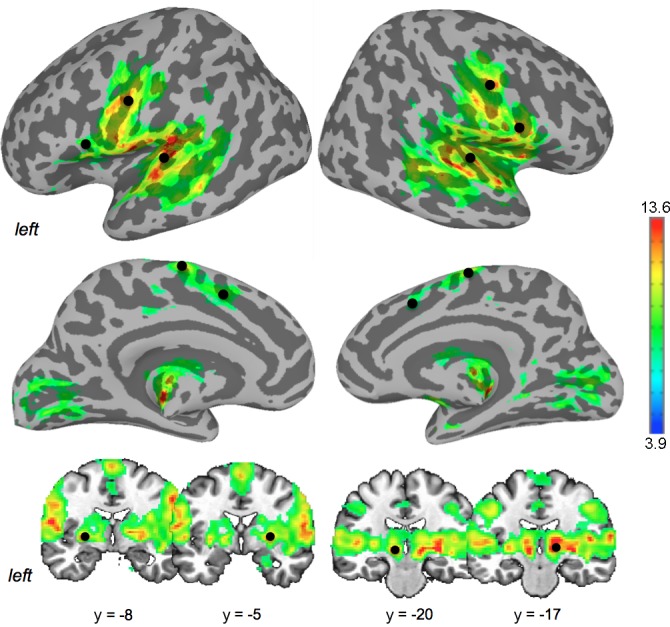
Brain activation during speech production and the seed regions. A group statistical parametric map of brain activation during speech production is shown on inflated cortical surfaces and series of coronal slices in the AFNI standard Talairach-Tournoux space. Black spheres indicate the location of 14 seed regions of interest. The corresponding location coordinates are given in Table 1. Color bar indicates t-values.
Graph theoretical analysis.
To assess topological differences in SPN and underlying RSN, weighted undirected networks were constructed using zero-lag Pearson's correlation coefficients of regionally averaged BOLD time series in each subject. For this, we used a nonoverlapping 212-region parcellation of the whole brain, consisting of 142 cortical, 36 subcortical, and 34 cerebellar regions, which were derived from the cytoarchitectonic maximum probability and macrolabel atlas (Eickhoff et al. 2005), as reported earlier (Furtinger et al. 2014). The same 14 a priori ROIs with an addition of the cerebellum based on our finding from the preceding functional connectivity analysis were used as network nodes. The supramarginal gyrus (SMG), which was found to show significant differences between the shared SPN and RSN, was not included as a node of interest because of limited activity during speech production both in the group activity map and across individual subjects (Fig. 1). All examined ROIs showed homogeneous within-region connectivity without spurious connections.
To assess the functional importance of a node within the network during speaking and resting, we computed the measures of nodal degree, strength, and betweenness centrality. The degree of a node quantifies the number of edges connected to a node, whereas nodal strength represents the sum of edge weights connected to a node and can thus be interpreted as a weighted alternative of the degree. Betweenness centrality quantifies the number of shortest paths in the graph that pass through a node, thereby estimating the impact of a node on the communication performance of the network (Freeman 1978; Rubinov and Sporns 2010). We further investigated the topological organization of SPN vs. RSN by examining network integration and segregation using the measures of weighted local efficiency, i.e., the average inverse shortest path length in a neighborhood of a node (Latora and Marchiori 2001), and weighted local clustering coefficient, which was computed as the geometric mean of edge weights in triangles around a node to assess the extent of local community formation (Onnela et al. 2005). The obtained measures of betweenness centrality, efficiency, and clustering coefficient were compared with 100 simulated networks of random topology, which had degree and strength distribution identical to RSN and SPN, respectively. Statistical significance of differences in RSN and SPN metrics was determined at the lowest network density of 76% using a two-sample permutation test at FWE-corrected P ≤ 0.05 (Nichols and Holmes 2002).
Network hemispheric lateralization.
Because left-hemispheric dominance of brain activity is a well-known feature of the central control of speech production, we quantified the extent of functional network lateralization during the resting state and speaking by using a laterality index (LI) (Seghier and Price 2012; Simonyan et al. 2009). We used the shared RSN and SPN maps to extract the total number of significantly connected voxels, which contributed to the overlapping networks originating from the left and right hemispheric seeds, respectively. The LIs of SPN and RSN were defined as follows: (number of overlapping voxels of left seed in left hemisphere − number of overlapping voxels of right seed in right hemisphere)/(number of overlapping voxels of left seed in left hemisphere + number of overlapping voxels of right seed in right hemisphere). Similarly, for a graph theoretical setting, the LI of each network was calculated as follows: (the sum of nodal graph metric values in the left hemisphere − the sum of nodal graph metric values in the right hemisphere)/the total sum of nodal graph metric values in the whole brain. A positive LI was interpreted as left hemispheric lateralization, and a negative LI indicated right hemispheric lateralization of network activity.
RESULTS
Organization and interaction between speech-controlling brain networks.
Both SPN and RSN established extended networks involving bilateral cortical and subcortical brain regions (Figs. 2 and 3). During speech production, bilateral shared networks included the primary sensorimotor cortex, premotor cortex/SMA, IFG, ventrolateral/dorsolateral prefrontal cortex, insula, operculum, STG, MTG, middle/posterior CC, occipital cortex, inferior parietal lobule (IPL), encompassing the angular gyrus and SMG, the basal ganglia, thalamus, and cerebellum (Fig. 2A). The shared RSN had similar organization but did not involve the IPL and cerebellum (Fig. 3A). While the resting-state overlapping networks were symmetrically and widely distributed in the right and left hemispheres, speech production was associated with a more “focused” overlap (>80%) around the cortical motor-processing brain regions, such as the LMC, IFG, SMA, and their input/output subcortical regions, the putamen and thalamus. Notably, a full 100% overlap between all networks was found in the bilateral LMC, left SMA, and right STG regions. Moreover, the LMC network was the only one to establish the most homogeneous connectivity, which fully overlapped with all other networks during both speech production and resting state. These data demonstrate the full integration of LMC within large-scale networks controlling speech production.
Fig. 2.

Organization of brain networks controlling speech production. A: bilateral shared network during speech production showing connectivity from the left hemisphere seed regions (I) and from the right hemisphere seed regions (II). B: distinct connectivity from individual seed networks, not overlapping with any other network during speech production showing connectivity from the left hemisphere seed regions (I) and from the right hemisphere seed regions (II). Brain connectivity is presented on inflated brain surfaces to depict cortical connectivity and on axial and sagittal brain slices to depict subcortical and cerebellar connectivity in the AFNI standard Talairach-Tournoux space. Color bar in A shows a percent overlap between individual seed networks. Color bar in B shows the color-coded connectivity from 7 seed regions. M1, primary motor cortex (area 4p); IFG, inferior frontal gyrus; SMA, supplementary motor area; STG, superior temporal gyrus; CC, cingulate cortex; Put, putamen; TH, thalamus.
Fig. 3.

Organization of resting-state brain networks associated with speech production. A: bilateral shared network during the resting state showing connectivity from the left hemisphere seed regions (I) and from the right hemisphere seed regions (II). B: distinct connectivity from individual seed networks, not overlapping with any other network during the resting state showing connectivity from the left hemisphere seed regions (I) and from the right hemisphere seed regions (II). Brain connectivity is presented on inflated brain surfaces to depict cortical connectivity and on axial and sagittal brain slices to depict subcortical and cerebellar connectivity in the AFNI standard Talairach-Tournoux space. Color bar in A shows a percent overlap between individual seed networks. Color bar in B shows the color-coded connectivity from 7 seed regions.
Conversely, all other seed networks showed additional distinct connectivity, which did not overlap with any other network. During speech production, such distinct connections were established with the prefrontal cortex (SMA, STG, and thalamus networks), insula (SMA and IFG networks), inferior temporal gyrus (SMA and thalamus networks), temporal pole (SMA, STG, IFG, CC, and thalamus networks), CC (CC network), and midbrain (thalamus and STG networks) (Figs. 2B and 4A). The RSNs exhibited wider-spread distinct connectivity, including the prefrontal cortex (CC and thalamus networks), inferior parietal lobule (IFG, STG, CC, putamen, and thalamus networks), insula (STG and thalamus networks), CC (CC, STG, and SMA networks), occipital cortex (thalamus and putamen networks), basal ganglia (SMA and thalamus networks), thalamus (putamen network), and cerebellum (STG, SMA, IFG, CC, thalamus, and putamen networks) (Figs. 3B and 4B).
Fig. 4.

Distinct connectivity of individual seed networks during speech production (A) and the resting state (B). Block diagrams show distinct connections, not overlapping with any other network connections of individual seed networks during speech production and the resting state in the left and right hemispheres. SPN, speech-production network; RSN, resting-state network; ITG, inferior temporal gyrus; SMG, supramarginal gyrus; AG, angular gyrus.
Graph theoretical analysis of network topology.
Within the defined speech-related regions, we observed significant changes in graph topology from the resting state to speaking, which were characterized by increased average connectivity strength and normalized betweenness centrality (measures of nodal influence within a network), as well as the clustering coefficient (a measure of network segregation) and the local efficiency (a measure of network integration) (all FWE-corrected P ≤ 0.04) (Fig. 5, Table 2). Specifically, the cerebellum (lobule VI) showed changes in all measures when comparing SPN to RSN, including significant increases in bilateral nodal strength, normalized clustering coefficient, and local efficiency but decreased betweenness centrality during speaking (all P ≤ 0.02). The nodal strength of SPN was also significantly increased in the bilateral SMA, left primary motor cortex, CC, right IFG, STG, putamen, and ventral thalamus (all P ≤ 0.04), whereas normalized local efficiency was greater in the right STG and ventral thalamus (all P ≤ 0.003) (Fig. 5, B and E, Table 2). In contrast, the RSN showed increased normalized betweenness centrality in the bilateral cerebellum and right ventral thalamus and increased local efficiency in the left STG (Fig. 5, B and D, Table 2). The average nodal degrees between SPN and RSN were similar (P ≥ 0.7), in part, attributed to the equilibrated connection densities of all networks.
Fig. 5.

Graph-theoretical characteristics of speech-controlling brain regions. A: brain views show the relative positions of the examined regions (graph nodes). The color of the spheres represents nodal strength [normalized to the range (0,1) and scaled with respect to the 14 depicted regions]. The bar charts depict the nodal values of normalized local efficiency (B), normalized clustering coefficient (C), normalized betweenness centrality (D), and nodal strength averaged across subjects in RSN (blue) and SPN (red) (E). Asterisks indicate statistically significant differences between RSN and SPN at a family-wise error (FWE)-corrected P ≤ 0.05. Cbl, cerebellum.
Table 2.
Nodal characteristics of speech-related brain regions
| Graph Metrics | Difference | RSN | SPN | P Value |
|---|---|---|---|---|
| Local clustering coefficient, ci | ||||
| L/R cerebellum (lobule VI) | SPN>RSN | 0.85 ± 0.29/0.87 ± 0.30 | 1.18 ± 0.28/1.24 ± 0.27 | 0.006 |
| Local efficiency, Eloc | ||||
| R superior temporal gyrus | SPN>RSN | 1.01 ± 0.01 | 1.06 ± 0.01 | 0.0003 |
| R thalamus (motor/premotor) | SPN>RSN | 1.01 ± 0.01/1.07 ± 0.02 | 1.08 ± 0.01/1.10 ± 0.01 | 0.005 |
| L/R cerebellum (lobule VI) | SPN>RSN | 0.98 ± 0.04/0.98 ± 0.04 | 1.05 ± 0.02/1.07 ± 0.02 | 0.001 |
| L superior temporal gyrus | RSN>SPN | 1.04 ± 0.01 | 0.99 ± 0.01 | 0.009 |
| Betweenness centrality, bi | ||||
| R thalamus (premotor) | RSN>SPN | 1.56 ± 0.83 | 0.42 ± 0.23 | 0.003 |
| L/R cerebellum (lobule VI) | RSN>SPN | 17.63 ± 11.32/9.76 ± 6.17 | 0.61 ± 0.34/0.44 ± 0.24 | 0.0021 |
| Nodal strength, si | ||||
| L primary motor cortex | SPN>RSN | 62.21 ± 3.22 | 87.78 ± 4.96 | 0.002 |
| L/R supplementary motor area | SPN>RSN | 68.94 ± 14.12/60.81 ± 14.43 | 95.17 ± 14.71/86.12 ± 14.57 | 0.007 |
| L cingulate cortex | SPN>RSN | 50.79 ± 14.88 | 81.74 ± 17.29 | 0.014 |
| L/R cerebellum (lobule VI) | SPN>RSN | 27.96 ± 2.17/33.89 ± 7.56 | 63.54 ± 9.37/66.07 ± 6.72 | 0.002 |
| R inferior frontal gyrus | SPN>RSN | 58.54 ± 19.14 | 81.25 ± 20.81 | 0.034 |
| R superior temporal gyrus | SPN>RSN | 39.52 ± 9.60 | 72.81 ± 8.53 | 0.005 |
| R putamen | SPN>RSN | 40.05 ± 16.47 | 74.56 ± 19.88 | 0.04 |
| R thalamus | SPN>RSN | 46.70 ± 6.44 | 84.12 ± 3.40 | 0.015 |
Values are means ± SD. Statistically significant nodal values in resting-state network (RSN) and speech-production network (SPN) across 20 subjects per condition (rest or speech) at a family-wise error-corrected P ≤ 0.05.
Network hemispheric lateralization.
Both shared SPN and shared RSN had largely bilateral hemispheric distribution with negligible right hemispheric lateralization at the SPN LI = −0.009 and the RSN LI = −0.007 (Fig. 6A). In the examination of the graph measures, cross-hemispheric correlations accounted for about 50% of overall links in both SPN and RSN. The percentage of intrahemispheric edges was evenly distributed within the left and right sides (∼25% each) for both RSN and SPN. Whereas the graph metrics were largely comparable between the left and right hemispheres during both resting and speaking, we observed a significant shift in betweenness centrality (a measure of nodal influence) from the right hemisphere during the resting state (LIb = −0.22) to the left hemisphere during speaking (LIb = 0.21) (Fig. 6B).
Fig. 6.

Functional network lateralization. Laterality indices of shared RSN and shared SPN (A) and graph theoretical measures (B). Negative values indicate right hemispheric lateralization; positive values indicate left hemispheric lateralization. Asterisk denotes significant difference.
DISCUSSION
For over a century and a half, the understanding of the central control of speech production has been an active field of research with the most recent knowledge derived from brain-imaging studies. However, a number of questions about how and where the large-scale brain networks interact with one another remained open. Our results demonstrate the extent of interactions between different speech-controlling brain networks in healthy subjects and provide further clues about the specific roles of brain regions involved in normal speaking.
In line with earlier studies (reviewed in Price 2012), regions showing a dense overlap between the individual SPN subnetworks were found centered on the bilateral sensorimotor cortex controlling speech production (i.e., LMC, premotor cortex, IFG, and SMA) and the right STG controlling auditory processing. The underlying shared RSN had similar organization, which was in line with our a priori hypothesis and the results of previous studies showing that RSNs reflect the organization of task-related functional networks (Biswal et al. 1995; Sidtis et al. 2004; Smith et al. 2009). In addition, both SPN and RSN had similarly bilateral distribution over both hemispheres (discussed in detail below). However, despite the topographical similarities between the shared SPN and shared RSN, we identified several differences in network topology, which may be critical for our ability to execute speech production. Overall, the SPN, compared with RSN, showed increased regional influences (quantified by nodal strength), network integration (estimated by local efficiency), and, at the same time, network segregation (estimated by clustering coefficient). Segregated local communities of nodes in SPN showed a significant increase of correlation strength but a similar number of connections as in the RSN. More specific regional characteristics included the SPN lateralization effects and recruitment of the parietal and cerebellar regions into the shared SPN but not RSN.
Speech-network lateralization.
The hemispheric dominance during speech and language production has been a well-known, albeit continuously debated, phenomenon (Findlay et al. 2012; Hickok and Poeppel 2007; Lindell 2006; Peelle 2012; Ramsey et al. 2001; Rauschecker and Scott 2009; Riecker et al. 2000, 2002; Sidtis 2012; Wildgruber et al. 1996), which may follow a neurodevelopmental process of progressive maturation of intrahemispheric functional connectivity and language exposure (Dehaene-Lambertz et al. 2002; Dubois et al. 2006; Perani et al. 2011). We and others have shown that the sensorimotor, prefrontal, and striatal functional networks controlling speech production are left lateralized (Bourguignon 2014; Gehrig et al. 2012; Kell et al. 2011; Manes et al. 2014; Morillon et al. 2010; Simonyan et al. 2009, 2013). On the other hand, simultaneous electrocorticography recordings from the prefrontal, temporal, and parietal cortices during overt speech production have recently revealed a bilateral transformation of speech sensory input into speech motor output (Cogan et al. 2014). Similarly, other studies using different neuroimaging modalities have reported bilateral brain activity and networks coupling production and comprehension of narrative speech (Papathanassiou et al. 2000; Silbert et al. 2014), underlying feedback error detection (Behroozmand et al. 2015), and predicting speech rate and vowel stability (Sidtis 2014; Sidtis et al. 2003, 2006).
Our current findings on interactions and topology of a large-scale network controlling speech production may offer a compromise for these opposing views on hemispheric dominance for speech production. On the one hand, we found a significant left hemispheric lateralization of betweenness centrality in SPN vs. RSN, suggesting that the nodes in the left hemisphere were stronger correlated between each other than with the right hemispheric nodes. Similarly, the shared SPN originating from the left hemispheric nodes showed a more homogeneous overlap between the examined networks compared with the shared SPN originating from the right hemispheric nodes as well as compared with bilateral shared RSNs. Specifically, the left perisylvian network from the left hemisphere seeds showed lesser variability in network overlap during speech than rest, whereas the right perisylvian network from the right hemisphere seeds showed approximately similar variability during both rest and speech (Figs. 2A and 3A). These findings point to a better integration of the SPN nodes in the left hemisphere for more efficient information transfer and suggest that the shared RSN may represent an underlying functional framework, which adapts to task production (in this case, speaking) by enhancing the strength of connectivity between overlapping networks and by changing the degree of its hemispheric lateralization.
On the other hand, we found bilaterally distributed large-scale network interactions during speech production and the underlying resting state. This finding was consistent with the fact that we did not observe any significant lateralization effects in graph nodal degree within the SPN or underlying RSN, as a decrease in nodal degree would have led to a decline in contralateral (right hemispheric) functional couplings expected in the case of left hemispheric lateralization. From a methodological point of view, these findings may be explained by the inherent nature of correlation networks reflecting direct as well as indirect couplings of all examined brain regions. It is also conceivable that a “global” approach to network analysis employed in this study may have caused the left lateralized speech networks from individual seed regions to appear less pronounced within the shared SPN, thus diminishing the overall left hemispheric lateralization of large-scale networks. This assumption is in line with the other studies, which, similar to ours, investigated the whole-brain networks and reported the presence of bilateral speech-controlling networks (Cogan et al. 2014; Papathanassiou et al. 2000; Sidtis 2014; Silbert et al. 2014), whereas studies assessing the lateralization of a particular network within the speech-production system showed largely left lateralized organization (Bourguignon 2014; Gehrig et al. 2012; Kell et al. 2011; Manes et al. 2014; Morillon et al. 2010; Simonyan et al. 2009, 2013).
Taken together, we propose that large-scale neural networks and their interactions controlling speech production appear to be bilaterally distributed; however, the left hemisphere has dominant functional influence for a stronger integration of the left hemispheric network, which drives the left hemispheric lateralization of SPN subnetworks.
Unique characteristics of shared SPN compared with underlying shared RSN.
As hypothesized, a prominent difference between the shared SPN and shared RSN was the recruitment of additional brain regions into the common network. Whereas the shared RSN showed largely distinct, nonoverlapping connectivity of the various individual subnetworks in the IPL and cerebellum, these brain regions became fully integrated into the shared network during speech production. To a lesser extent, integration of subnetworks was also observed in the IFG and middle frontal gyri for SPN vs. RSN.
The IPL, and particularly the SMG, is known to be involved in several aspects of speech- and language-related control, including speech motor learning, sensorimotor adaptation, phonological processing and decisions, monitoring the onset of speech, and recognizing and responding to auditory errors (Hartwigsen et al. 2010; Hickok and Poeppel 2007; Kort et al. 2014; Shum et al. 2011). The IPL is anatomically connected with the LMC, premotor cortex, IFG, and the auditory cortex (Catani et al. 2005; Croxson and Simonyan 2013; Frey et al. 2008; Petrides and Pandya 1984; Simonyan and Jurgens 2002), possibly forming feed-forward connections between the brain regions controlling speech production and auditory processing (Rauschecker and Scott 2009). Functionally, the IPL is viewed as part of the dorsal stream of speech processing, which interfaces with the ventral stream in the STG and is associated more with linguistic than acoustic or phonetic processing (Rauschecker and Scott 2009). Alternatively, the IPL is proposed to be positioned at the junction of ventral and dorsal streams of speech processing (Catani et al. 2005; Hickok and Poeppel 2007) and to participate in the sensorimotor interface by receiving an input from the phonological network and sending an output to the articulatory network (Hickok and Poeppel 2007). Our data demonstrate that, independent of its membership in the dorsal or ventral streams, the IPL is being exclusively recruited into the large-scale functional network controlling speech production but not the resting state. Furthermore, we show that the IPL recruitment is bilateral, as opposed to the proposed left lateralized contribution to the dual-stream model of speech control (Hickok and Poeppel 2007), but similar to the results of recent studies reporting a bilateral involvement of this region in different aspects of speech processing, such as phonological processing (Deschamps et al. 2014; Hartwigsen et al. 2010), speech-sound discrimination (Venezia et al. 2012), silent speech reading (Chu et al. 2013), and sensorimotor transformations during overt speech production (Cogan et al. 2014). As we have reported earlier, the functional connectivity of the IPL with the LMC may be gradually increasing with the increased complexity of sound production (Simonyan et al. 2009). Our present data suggest that the functional importance of the bilateral IPL (and the SMG in particular) within the shared SPN may be related to its role in a higher-level sensorimotor integration, such as mapping the phonetic cues into lexical and articulatory representations for speech production.
The cerebellum was the other region showing significant differences between shared SPN and shared RSN. This structure has been long recognized for its involvement in speech and language control, largely contributing to both motor and linguistic aspects, such as phonological and semantic verbal fluency, grammar processing, verbal working memory, and error-driven adjustment of motor commands (Baddeley 2003; Ben-Yehudah et al. 2007; Eickhoff et al. 2009; Manto et al. 2012; Marien et al. 2014; Thurling et al. 2011). Within the speech-production system, the cerebellum is primarily considered to control the ongoing temporal sequencing of syllables during overt speaking and the generation of the prearticulatory verbal code during covert or silent speech production (Ackermann 2008; Ackermann et al. 2004, 2007; Bohland and Guenther 2006; Guenther et al. 2006; Riecker et al. 2000, 2005; Wildgruber et al. 2001). We found that, whereas shared RSN and shared SPN appear to have largely similar organization, the cerebellum was the only region to show heterogeneous connectivity with all individual networks (except for the LMC network) during resting but not speaking. We also found significant bilateral cerebellar differences on all graph measures between RSN and SPN, including nodal strength, local efficiency, clustering coefficient, and betweenness centrality. These data indicate that, compared with the resting state, cerebellar influences are important for segregation and integration of different components of the speech network, specifically by pronounced increases in the cerebellar connectivity, stronger functional embedding within the network, and the decreased average length of the shortest paths passing through the neighborhood of the cerebellar nodes. Furthermore, decreased betweenness centrality during speaking vs. resting might be indicative of long-range functional correlations during speech production not present at rest. Based on our current findings and the presence of additional cerebellar access to the LMC via its connections with the SMG (Clower et al. 2001; Simonyan and Jurgens 2002), we suggest that the recruitment of the cerebellum (together with the IPL/SMG) into the shared SPN but not RSN may facilitate the transition from the resting state to speaking by forming an integrated functional network.
Whereas the IPL and cerebellum were the most heterogeneous regions compared with shared SPN and shared RSN, the LMC network emerged as the most homogeneous network among all other examined networks. In addition, the LMC region showed a full overlap between all speech-controlling networks in both SPN and RSN. As a final common cortical pathway for speech control, the LMC is known to be essential for the control of voluntary and highly learned laryngeal behaviors, such as speech and song (Simonyan 2014). Based on complete integration of the LMC network with other subnetworks and complete convergence of all networks in the LMC region, it is conceivable that the LMC plays a critical role in determining the extent of the shared network controlling speech production.
Limitations and future directions.
There are a few limitations of this study to consider. Our goal was to examine the network interactions during production of grammatically correct English sentences most closely resembling our normal, real-life speaking. Thus, as stated earlier, our results characterized a global speech-production network encompassing various linguistic and cognitive processes in addition to speech motor output. However, the network interactions during the different phases of speech control still remain poorly understood. Future series of studies should continue implementing more specific conditions directed toward various aspects of speech production and comprehension (Geranmayeh et al. 2014; Simmonds et al. 2014b; van de Ven et al. 2009) to elucidate the extent of interactions occurring during different phases of this complex behavior (Simmonds et al. 2014a; Tremblay and Small 2011).
The use of seed-based functional connectivity analysis was feasible for identification of interactions among different speech-related functional brain networks and the reorganization of these networks from the resting state to sentence production, which were the goals of this study. It should be noted that, although analytically different (i.e., a priori seed-based vs. data-driven ICA approaches), the seed-based functional networks were shown to strongly resemble ICA components, representing the sum of ICA-derived within- and between-network connectivities with the network connectivity strength for individual subjects being correlated between the methods (Erhardt et al. 2011; Joel et al. 2011; van de Ven et al. 2004). However, a limitation of the employed seed-based interregional correlation analysis over the ICA and other effective connectivity measures was that this approach did not infer information about the influences of one region on the other, as it did not model statistical dependences between the regions within the network (Friston 2011; Joel et al. 2011). This is, however, an important aspect of brain connectivity for speech control and needs to be examined in great detail in future studies.
Conclusions.
In summary, this study identified the interactions between different brain networks related to speech production in healthy subjects. Our main findings include the following: 1) highly integrated and, at the same time, segregated SPN, which is built on the “skeleton” of RSN; 2) bilateral organization of large-scale SPN and RSN but dominant functional influence of the left hemisphere on SPN organization; 3) recruitment of the IPL (the SMG region) and cerebellum into the SPN but not RSN; and 4) formation of a homogeneous, fully-overlapping LMC network as a final common motor cortical pathway determining the extent of the shared network controlling speech production.
GRANTS
This work was supported by the grants from the National Institute on Deafness and Other Communication Disorders, National Institutes of Health (R01DC011805 and R00DC009629) to K. Simonyan.
DISCLOSURES
No conflicts of interest, financial or otherwise, are declared by the authors.
AUTHOR CONTRIBUTIONS
Author contributions: K.S. conception and design of research; K.S. performed experiments; K.S. and S.F. analyzed data; K.S. and S.F. interpreted results of experiments; K.S. and S.F. prepared figures; K.S. and S.F. drafted manuscript; K.S. and S.F. edited and revised manuscript; K.S. and S.F. approved final version of manuscript.
ACKNOWLEDGMENTS
We thank Barry Horwitz for thoughtful discussions related to this study and Manjula Khubchnandani for assistance with the initial data processing.
REFERENCES
- Ackermann H. Cerebellar contributions to speech production and speech perception: psycholinguistic and neurobiological perspectives. Trends Neurosci 31: 265–272, 2008. [DOI] [PubMed] [Google Scholar]
- Ackermann H, Mathiak K, Ivry RB. Temporal organization of “internal speech” as a basis for cerebellar modulation of cognitive functions. Behav Cogn Neurosci Rev 3: 14–22, 2004. [DOI] [PubMed] [Google Scholar]
- Ackermann H, Mathiak K, Riecker A. The contribution of the cerebellum to speech production and speech perception: clinical and functional imaging data. Cerebellum 6: 202–213, 2007. [DOI] [PubMed] [Google Scholar]
- Baddeley A. Working memory: looking back and looking forward. Nat Rev Neurosci 4: 829–839, 2003. [DOI] [PubMed] [Google Scholar]
- Behroozmand R, Shebek R, Hansen DR, Oya H, Robin DA, Howard MA 3rd, Greenlee JD. Sensory-motor networks involved in speech production and motor control: An fMRI study. Neuroimage 109: 418–428, 2015. [DOI] [PMC free article] [PubMed] [Google Scholar]
- Ben-Yehudah G, Guediche S, Fiez JA. Cerebellar contributions to verbal working memory: beyond cognitive theory. Cerebellum 6: 193–201, 2007. [DOI] [PubMed] [Google Scholar]
- Binder JR, Frost JA, Hammeke TA, Cox RW, Rao SM, Prieto T. Human brain language areas identified by functional magnetic resonance imaging. J Neurosci 17: 353–362, 1997. [DOI] [PMC free article] [PubMed] [Google Scholar]
- Biswal B, Yetkin FZ, Haughton VM, Hyde JS. Functional connectivity in the motor cortex of resting human brain using echo-planar MRI. Magn Reson Med 34: 537–541, 1995. [DOI] [PubMed] [Google Scholar]
- Bohland JW, Guenther FH. An fMRI investigation of syllable sequence production. Neuroimage 32: 821–841, 2006. [DOI] [PubMed] [Google Scholar]
- Bourguignon NJ. A rostro-caudal axis for language in the frontal lobe: the role of executive control in speech production. Neurosci Biobehav Rev 47: 431–444, 2014. [DOI] [PubMed] [Google Scholar]
- Catani M, Jones DK, ffytche DH. Perisylvian language networks of the human brain. Ann Neurol 57: 8–16, 2005. [DOI] [PubMed] [Google Scholar]
- Chu YH, Lin FH, Chou YJ, Tsai KW, Kuo WJ, Jaaskelainen IP. Effective cerebral connectivity during silent speech reading revealed by functional magnetic resonance imaging. PLoS One 8: e80265, 2013. [DOI] [PMC free article] [PubMed] [Google Scholar]
- Clower DM, West RA, Lynch JC, Strick PL. The inferior parietal lobule is the target of output from the superior colliculus, hippocampus, and cerebellum. J Neurosci 21: 6283–6291, 2001. [DOI] [PMC free article] [PubMed] [Google Scholar]
- Cogan GB, Thesen T, Carlson C, Doyle W, Devinsky O, Pesaran B. Sensory-motor transformations for speech occur bilaterally. Nature 507: 94–98, 2014. [DOI] [PMC free article] [PubMed] [Google Scholar]
- Cox RW. AFNI: Software for analysis and visualization of functional magnetic resonance neuroimages. Comput Biomed Res 29: 162–173, 1996. [DOI] [PubMed] [Google Scholar]
- Croxson PL, Simonyan K. A Comparison of the Connections of Laryngeal Motor Cortex in Humans and Macaque Monkey Using Diffusion Tractography. San Diego, CA: Society for Neuroscience, 2013. [Google Scholar]
- D'Ausilio A, Bufalari I, Salmas P, Fadiga L. The role of the motor system in discriminating normal and degraded speech sounds. Cortex 48: 882–887, 2012. [DOI] [PubMed] [Google Scholar]
- David O, Maess B, Eckstein K, Friederici AD. Dynamic causal modeling of subcortical connectivity of language. J Neurosci 31: 2712–2717, 2011. [DOI] [PMC free article] [PubMed] [Google Scholar]
- Dehaene-Lambertz G, Dehaene S, Hertz-Pannier L. Functional neuroimaging of speech perception in infants. Science 298: 2013–2015, 2002. [DOI] [PubMed] [Google Scholar]
- Deschamps I, Baum SR, Gracco VL. On the role of the supramarginal gyrus in phonological processing and verbal working memory: evidence from rTMS studies. Neuropsychologia 53: 39–46, 2014. [DOI] [PubMed] [Google Scholar]
- Dubois J, Hertz-Pannier L, Dehaene-Lambertz G, Cointepas Y, Le Bihan D. Assessment of the early organization and maturation of infants' cerebral white matter fiber bundles: a feasibility study using quantitative diffusion tensor imaging and tractography. Neuroimage 30: 1121–1132, 2006. [DOI] [PubMed] [Google Scholar]
- Eickhoff S, Stephan KE, Mohlberg H, Grefkes C, Fink GR, Amunts K, Zilles K. A new SPM toolbox for combining probabilistic cytoarchitectonic maps and functional imaging data. Neuroimage 25: 1325–1335, 2005. [DOI] [PubMed] [Google Scholar]
- Eickhoff SB, Heim S, Zilles K, Amunts K. A systems perspective on the effective connectivity of overt speech production. Philos Trans A Math Phys Eng Sci 367: 2399–2421, 2009. [DOI] [PMC free article] [PubMed] [Google Scholar]
- Erhardt EB, Allen EA, Damaraju E, Calhoun VD. On network derivation, classification, and visualization: a response to Habeck and Moeller. Brain Connect 1: 1–19, 2011. [PMC free article] [PubMed] [Google Scholar]
- Findlay AM, Ambrose JB, Cahn-Weiner DA, Houde JF, Honma S, Hinkley LB, Berger MS, Nagarajan SS, Kirsch HE. Dynamics of hemispheric dominance for language assessed by magnetoencephalographic imaging. Ann Neurol 71: 668–686, 2012. [DOI] [PMC free article] [PubMed] [Google Scholar]
- Fischl B, Sereno MI, Dale AM. Cortical surface-based analysis. II: Inflation, flattening, and a surface-based coordinate system. Neuroimage 9: 195–207, 1999. [DOI] [PubMed] [Google Scholar]
- Forman SD, Cohen JD, Fitzgerald M, Eddy WF, Mintun MA, Noll DC. Improved assessment of significant activation in functional magnetic resonance imaging (fMRI): use of a cluster-size threshold. Magn Reson Med 33: 636–647, 1995. [DOI] [PubMed] [Google Scholar]
- Freeman LC. Centrality in social networks: conceptual clarification. Social Netw 1: 215–239, 1978. [Google Scholar]
- Frey S, Campbell JS, Pike GB, Petrides M. Dissociating the human language pathways with high angular resolution diffusion fiber tractography. J Neurosci 28: 11435–11444, 2008. [DOI] [PMC free article] [PubMed] [Google Scholar]
- Friedrich R, Friederici AD. Mathematical logic in the human brain: syntax. PLoS One 4: e5599, 2009. [DOI] [PMC free article] [PubMed] [Google Scholar]
- Friston KJ. Functional and effective connectivity: a review. Brain Connect 1: 13–36, 2011. [DOI] [PubMed] [Google Scholar]
- Furtinger S, Zinn JC, Simonyan K. A neural population model incorporating dopaminergic neurotransmission during complex voluntary behaviors. PLoS Comput Biol 10: e1003924, 2014. [DOI] [PMC free article] [PubMed] [Google Scholar]
- Gehrig J, Wibral M, Arnold C, Kell CA. Setting up the speech production network: how oscillations contribute to lateralized information routing. Front Psychol 3: 169, 2012. [DOI] [PMC free article] [PubMed] [Google Scholar]
- Geranmayeh F, Brownsett SL, Leech R, Beckmann CF, Woodhead Z, Wise RJ. The contribution of the inferior parietal cortex to spoken language production. Brain Lang 121: 47–57, 2012. [DOI] [PubMed] [Google Scholar]
- Geranmayeh F, Wise RJ, Mehta A, Leech R. Overlapping networks engaged during spoken language production and its cognitive control. J Neurosci 34: 8728–8740, 2014. [DOI] [PMC free article] [PubMed] [Google Scholar]
- Glover GH, Li TQ, Ress D. Image-based method for retrospective correction of physiological motion effects in fMRI: RETROICOR. Magn Reson Med 44: 162–167, 2000. [DOI] [PubMed] [Google Scholar]
- Guenther FH, Ghosh SS, Tourville JA. Neural modeling and imaging of the cortical interactions underlying syllable production. Brain Lang 96: 280–301, 2006. [DOI] [PMC free article] [PubMed] [Google Scholar]
- Hartwigsen G, Baumgaertner A, Price CJ, Koehnke M, Ulmer S, Siebner HR. Phonological decisions require both the left and right supramarginal gyri. Proc Natl Acad Sci USA 107: 16494–16499, 2010. [DOI] [PMC free article] [PubMed] [Google Scholar]
- Heim S. The structure and dynamics of normal language processing: insights from neuroimaging. Acta Neurobiol Exp (Warsz) 65: 95–116, 2005. [DOI] [PubMed] [Google Scholar]
- Hickok G, Poeppel D. The cortical organization of speech processing. Nat Rev Neurosci 8: 393–402, 2007. [DOI] [PubMed] [Google Scholar]
- Hoptman MJ, D'Angelo D, Catalano D, Mauro CJ, Shehzad ZE, Kelly AM, Castellanos FX, Javitt DC, Milham MP. Amygdalofrontal functional disconnectivity and aggression in schizophrenia. Schizophr Bull 36: 1020–1028, 2010. [DOI] [PMC free article] [PubMed] [Google Scholar]
- Horwitz B, Braun AR. Brain network interactions in auditory, visual and linguistic processing. Brain Lang 89: 377–384, 2004. [DOI] [PubMed] [Google Scholar]
- Indefrey P, Levelt WJ. The spatial and temporal signatures of word production components. Cognition 92: 101–144, 2004. [DOI] [PubMed] [Google Scholar]
- Jo HJ, Saad ZS, Simmons WK, Milbury LA, Cox RW. Mapping sources of correlation in resting state FMRI, with artifact detection and removal. Neuroimage 52: 571–582, 2010. [DOI] [PMC free article] [PubMed] [Google Scholar]
- Joel SE, Caffo BS, van Zijl PC, Pekar JJ. On the relationship between seed-based and ICA-based measures of functional connectivity. Magn Reson Med 66: 644–657, 2011. [DOI] [PMC free article] [PubMed] [Google Scholar]
- Kell CA, Morillon B, Kouneiher F, Giraud AL. Lateralization of speech production starts in sensory cortices—a possible sensory origin of cerebral left dominance for speech. Cereb Cortex 21: 932–937, 2011. [DOI] [PubMed] [Google Scholar]
- Kort NS, Nagarajan SS, Houde JF. A bilateral cortical network responds to pitch perturbations in speech feedback. Neuroimage 86: 525–535, 2014. [DOI] [PMC free article] [PubMed] [Google Scholar]
- Latora V, Marchiori M. Efficient behavior of small-world networks. Phys Rev Lett 87: 198701, 2001. [DOI] [PubMed] [Google Scholar]
- Lindell AK. In your right mind: right hemisphere contributions to language processing and production. Neuropsychol Rev 16: 131–148, 2006. [DOI] [PubMed] [Google Scholar]
- Manes JL, Parkinson AL, Larson CR, Greenlee JD, Eickhoff SB, Corcos DM, Robin DA. Connectivity of the subthalamic nucleus and globus pallidus pars interna to regions within the speech network: a meta-analytic connectivity study. Hum Brain Mapp 35: 3499–3516, 2014. [DOI] [PMC free article] [PubMed] [Google Scholar]
- Manto M, Bower JM, Conforto AB, Delgado-Garcia JM, da Guarda SN, Gerwig M, Habas C, Hagura N, Ivry RB, Marien P, Molinari M, Naito E, Nowak DA, Oulad Ben Taib N, Pelisson D, Tesche CD, Tilikete C, Timmann D. Consensus paper: roles of the cerebellum in motor control—the diversity of ideas on cerebellar involvement in movement. Cerebellum 11: 457–487, 2012. [DOI] [PMC free article] [PubMed] [Google Scholar]
- Marien P, Ackermann H, Adamaszek M, Barwood CH, Beaton A, Desmond J, De Witte E, Fawcett AJ, Hertrich I, Kuper M, Leggio M, Marvel C, Molinari M, Murdoch BE, Nicolson RI, Schmahmann JD, Stoodley CJ, Thurling M, Timmann D, Wouters E, Ziegler W. Consensus paper: Language and the cerebellum: an ongoing enigma. Cerebellum 13: 386–410, 2014. [DOI] [PMC free article] [PubMed] [Google Scholar]
- Mathworks. MATLAB.1.0.604 (R2013a). Natick, MA: The MathWorks, 2013. [Google Scholar]
- Morillon B, Lehongre K, Frackowiak RS, Ducorps A, Kleinschmidt A, Poeppel D, Giraud AL. Neurophysiological origin of human brain asymmetry for speech and language. Proc Natl Acad Sci USA 107: 18688–18693, 2010. [DOI] [PMC free article] [PubMed] [Google Scholar]
- Nichols TE, Holmes AP. Nonparametric permutation tests for functional neuroimaging: a primer with examples. Hum Brain Mapp 15: 1–25, 2002. [DOI] [PMC free article] [PubMed] [Google Scholar]
- Onnela JP, Saramaki J, Kertesz J, Kaski K. Intensity and coherence of motifs in weighted complex networks. Phys Rev E Stat Nonlin Soft Matter Phys 71: 065103, 2005. [DOI] [PubMed] [Google Scholar]
- Papathanassiou D, Etard O, Mellet E, Zago L, Mazoyer B, and Tzourio-Mazoyer N. A common language network for comprehension and production: a contribution to the definition of language epicenters with PET. Neuroimage 11: 347–357, 2000. [DOI] [PubMed] [Google Scholar]
- Peelle JE. The hemispheric lateralization of speech processing depends on what “speech” is: a hierarchical perspective. Front Hum Neurosci 6: 309, 2012. [DOI] [PMC free article] [PubMed] [Google Scholar]
- Perani D, Saccuman MC, Scifo P, Anwander A, Spada D, Baldoli C, Poloniato A, Lohmann G, Friederici AD. Neural language networks at birth. Proc Natl Acad Sci USA 108: 16056–16061, 2011. [DOI] [PMC free article] [PubMed] [Google Scholar]
- Petrides M, Pandya DN. Projections to the frontal cortex from the posterior parietal region in the rhesus monkey. J Comp Neurol 228: 105–116, 1984. [DOI] [PubMed] [Google Scholar]
- Prat CS, Keller TA, Just MA. Individual differences in sentence comprehension: a functional magnetic resonance imaging investigation of syntactic and lexical processing demands. J Cogn Neurosci 19: 1950–1963, 2007. [DOI] [PMC free article] [PubMed] [Google Scholar]
- Price CJ. The anatomy of language: a review of 100 fMRI studies published in 2009. Ann NY Acad Sci 1191: 62–88, 2010. [DOI] [PubMed] [Google Scholar]
- Price CJ. A review and synthesis of the first 20 years of PET and fMRI studies of heard speech, spoken language and reading. Neuroimage 62: 816–847, 2012. [DOI] [PMC free article] [PubMed] [Google Scholar]
- Ramsey NF, Sommer IE, Rutten GJ, Kahn RS. Combined analysis of language tasks in fMRI improves assessment of hemispheric dominance for language functions in individual subjects. Neuroimage 13: 719–733, 2001. [DOI] [PubMed] [Google Scholar]
- Rauschecker JP, Scott SK. Maps and streams in the auditory cortex: nonhuman primates illuminate human speech processing. Nat Neurosci 12: 718–724, 2009. [DOI] [PMC free article] [PubMed] [Google Scholar]
- Riecker A, Ackermann H, Wildgruber D, Dogil G, Grodd W. Opposite hemispheric lateralization effects during speaking and singing at motor cortex, insula and cerebellum. Neuroreport 11: 1997–2000, 2000. [DOI] [PubMed] [Google Scholar]
- Riecker A, Wildgruber D, Dogil G, Grodd W, Ackermann H. Hemispheric lateralization effects of rhythm implementation during syllable repetitions: an fMRI study. Neuroimage 16: 169–176, 2002. [DOI] [PubMed] [Google Scholar]
- Riecker A, Mathiak K, Wildgruber D, Erb M, Hertrich I, Grodd W, Ackermann H. fMRI reveals two distinct cerebral networks subserving speech motor control. Neurology 64: 700–706, 2005. [DOI] [PubMed] [Google Scholar]
- Rogalsky C, Rong F, Saberi K, Hickok G. Functional anatomy of language and music perception: temporal and structural factors investigated using functional magnetic resonance imaging. J Neurosci 31: 3843–3852, 2011. [DOI] [PMC free article] [PubMed] [Google Scholar]
- Rubinov M, Sporns O. Complex network measures of brain connectivity: uses and interpretations. Neuroimage 52: 1059–1069, 2010. [DOI] [PubMed] [Google Scholar]
- Schafer RJ, Constable T. Modulation of functional connectivity with the syntactic and semantic demands of a noun phrase formation task: a possible role for the default network. Neuroimage 46: 882–890, 2009. [DOI] [PubMed] [Google Scholar]
- Schon D, Gordon R, Campagne A, Magne C, Astesano C, Anton JL, Besson M. Similar cerebral networks in language, music and song perception. Neuroimage 51: 450–461, 2010. [DOI] [PubMed] [Google Scholar]
- Seghier ML, Price CJ. Functional heterogeneity within the default network during semantic processing and speech production. Front Psychol 3: 281, 2012. [DOI] [PMC free article] [PubMed] [Google Scholar]
- Shum M, Shiller DM, Baum SR, Gracco VL. Sensorimotor integration for speech motor learning involves the inferior parietal cortex. Eur J Neurosci 34: 1817–1822, 2011. [DOI] [PMC free article] [PubMed] [Google Scholar]
- Sidtis JJ. Performance-based connectivity analysis: a path to convergence with clinical studies. Neuroimage 59: 2316–2321, 2012. [DOI] [PMC free article] [PubMed] [Google Scholar]
- Sidtis JJ. Functional connectivity associated with acoustic stability during vowel production: implications for vocal-motor control. Brain Connect 5: 115–125, 2015. [DOI] [PMC free article] [PubMed] [Google Scholar]
- Sidtis JJ, Strother SC, Rottenberg DA. Predicting performance from functional imaging data: methods matter. Neuroimage 20: 615–624, 2003. [DOI] [PubMed] [Google Scholar]
- Sidtis JJ, Strother SC, Rottenberg DA. The effect of set on the resting state in functional imaging: a role for the striatum? Neuroimage 22: 1407–1413, 2004. [DOI] [PubMed] [Google Scholar]
- Sidtis JJ, Gomez C, Groshong A, Strother SC, Rottenberg DA. Mapping cerebral blood flow during speech production in hereditary ataxia. Neuroimage 31: 246–254, 2006. [DOI] [PubMed] [Google Scholar]
- Silbert LJ, Honey CJ, Simony E, Poeppel D, Hasson U. Coupled neural systems underlie the production and comprehension of naturalistic narrative speech. Proc Natl Acad Sci USA 111: E4687–E4696, 2014. [DOI] [PMC free article] [PubMed] [Google Scholar]
- Simmonds AJ, Leech R, Collins C, Redjep O, Wise RJ. Sensory-motor integration during speech production localizes to both left and right plana temporale. J Neurosci 34: 12963–12972, 2014a. [DOI] [PMC free article] [PubMed] [Google Scholar]
- Simmonds AJ, Wise RJ, Collins C, Redjep O, Sharp DJ, Iverson P, Leech R. Parallel systems in the control of speech. Hum Brain Mapp 35: 1930–1943, 2014b. [DOI] [PMC free article] [PubMed] [Google Scholar]
- Simon O, Mangin JF, Cohen L, Le Bihan D, Dehaene S. Topographical layout of hand, eye, calculation, and language-related areas in the human parietal lobe. Neuron 33: 475–487, 2002. [DOI] [PubMed] [Google Scholar]
- Simonyan K. The laryngeal motor cortex: its organization and connectivity. Curr Opin Neurobiol 28C: 15–21, 2014. [DOI] [PMC free article] [PubMed] [Google Scholar]
- Simonyan K, Horwitz B. Laryngeal motor cortex and control of speech in humans. Neuroscientist 17: 197–208, 2011. [DOI] [PMC free article] [PubMed] [Google Scholar]
- Simonyan K, Jurgens U. Cortico-cortical projections of the motorcortical larynx area in the rhesus monkey. Brain Res 949: 23–31, 2002. [DOI] [PubMed] [Google Scholar]
- Simonyan K, Ludlow CL. Abnormal activation of the primary somatosensory cortex in spasmodic dysphonia: an fMRI study. Cereb Cortex 20: 2749–2759, 2010. [DOI] [PMC free article] [PubMed] [Google Scholar]
- Simonyan K, Ostuni J, Ludlow CL, Horwitz B. Functional but not structural networks of the human laryngeal motor cortex show left hemispheric lateralization during syllable but not breathing production. J Neurosci 29: 14912–14923, 2009. [DOI] [PMC free article] [PubMed] [Google Scholar]
- Simonyan K, Herscovitch P, Horwitz B. Speech-induced striatal dopamine release is left lateralized and coupled to functional striatal circuits in healthy humans: a combined PET, fMRI and DTI study. Neuroimage 70: 21–32, 2013. [DOI] [PMC free article] [PubMed] [Google Scholar]
- Smith SM, Fox PT, Miller KL, Glahn DC, Fox PM, Mackay CE, Filippini N, Watkins KE, Toro R, Laird AR, Beckmann CF. Correspondence of the brain's functional architecture during activation and rest. Proc Natl Acad Sci USA 106: 13040–13045, 2009. [DOI] [PMC free article] [PubMed] [Google Scholar]
- Soros P, Sokoloff LG, Bose A, McIntosh AR, Graham SJ, Stuss DT. Clustered functional MRI of overt speech production. Neuroimage 32: 376–387, 2006. [DOI] [PubMed] [Google Scholar]
- Strelnikov KN, Vorobyev VA, Chernigovskaya TV, Medvedev SV. Prosodic clues to syntactic processing—a PET and ERP study. Neuroimage 29: 1127–1134, 2006. [DOI] [PubMed] [Google Scholar]
- Thurling M, Kuper M, Stefanescu R, Maderwald S, Gizewski ER, Ladd ME, Timmann D. Activation of the dentate nucleus in a verb generation task: A 7T MRI study. Neuroimage 57: 1184–1191, 2011. [DOI] [PubMed] [Google Scholar]
- Tremblay P, Small SL. Motor response selection in overt sentence production: a functional MRI study. Front Psychol 2: 253, 2011. [DOI] [PMC free article] [PubMed] [Google Scholar]
- Turkeltaub PE, Coslett HB. Localization of sublexical speech perception components. Brain Lang 114: 1–15, 2010. [DOI] [PMC free article] [PubMed] [Google Scholar]
- van de Ven VG, Formisano E, Prvulovic D, Roeder CH, Linden DE. Functional connectivity as revealed by spatial independent component analysis of fMRI measurements during rest. Hum Brain Mapp 22: 165–178, 2004. [DOI] [PMC free article] [PubMed] [Google Scholar]
- van de Ven V, Esposito F, Christoffels IK. Neural network of speech monitoring overlaps with overt speech production and comprehension networks: a sequential spatial and temporal ICA study. Neuroimage 47: 1982–1991, 2009. [DOI] [PubMed] [Google Scholar]
- Venezia JH, Saberi K, Chubb C, Hickok G. Response bias modulates the speech motor system during syllable discrimination. Front Psychol 3: 157, 2012. [DOI] [PMC free article] [PubMed] [Google Scholar]
- Wildgruber D, Ackermann H, Klose U, Kardatzki B, Grodd W. Functional lateralization of speech production at primary motor cortex: a fMRI study. Neuroreport 7: 2791–2795, 1996. [DOI] [PubMed] [Google Scholar]
- Wildgruber D, Ackermann H, Grodd W. Differential contributions of motor cortex, basal ganglia, and cerebellum to speech motor control: effects of syllable repetition rate evaluated by fMRI. Neuroimage 13: 101–109, 2001. [DOI] [PubMed] [Google Scholar]
- Xu J, Zhang S, Calhoun VD, Monterosso J, Li CS, Worhunsky PD, Stevens M, Pearlson GD, Potenza MN. Task-related concurrent but opposite modulations of overlapping functional networks as revealed by spatial ICA. Neuroimage 79: 62–71, 2013. [DOI] [PMC free article] [PubMed] [Google Scholar]