Abstract
The dynamic-clamp technique is highly useful for mimicking synaptic or voltage-gated conductances. However, its use remains rare in part because there are few systems, and they can be expensive and difficult for less-experienced programmers to implement. Furthermore, some conductances (such as sodium channels) can be quite rapid or may have complex voltage sensitivity, so high speeds are necessary. To address these issues, we have developed a new interface that uses a common personal computer platform with National Instruments data acquisition and WaveMetrics IGOR to provide a simple user interface. This dynamic clamp implements leak and linear synaptic conductances as well as a voltage-dependent synaptic conductance and kinetic channel conductances based on Hodgkin-Huxley or Markov models. The speed of the system can be assayed using a testing mode, and currently speeds of >100 kHz (10 μs per cycle) are achievable with short latency and little jitter.
Keywords: WaveMetrics IGOR, Markov model
the dynamic-clamp technique (also called conductance clamp) was introduced by Sharp et al. (1993) and Robinson and Kawai (1993). It has been an excellent experimental tool for understanding how channel conductances might affect neuronal behavior or how cells may respond to complex patterns of synaptic conductances (Prinz et al. 2004). However, despite its incorporation into some commercially available hardware platforms, it has not won as wide use as it deserves. One issue is that it has required users to be relatively sophisticated in their understanding of data acquisition systems or computer operating systems. Furthermore, some hardware platforms are rather limited in their capabilities, such as performing only linear (ohmic) conductances, with no voltage or kinetic characteristics, or having slow cycle times. In addition, these systems can be quite expensive. A number of these systems are reviewed by Kemenes et al. (2011).
To address these issues, we have developed a dynamic-clamp interface that uses common hardware (personal computer and National Instruments) and software (WaveMetrics IGOR) interfaces. It allows a number of dynamic-clamp features (described in detail below) and can cycle as fast as 100 kHz. This interface is freely downloadable from http://www.biology.buffalo.edu/Faculty/Xu_Friedman/mafPC/sign_in.html along with additional documentation. We hope that it will add another technique to the electrophysiologist's arsenal.
METHODS AND RESULTS
Overview of System Design
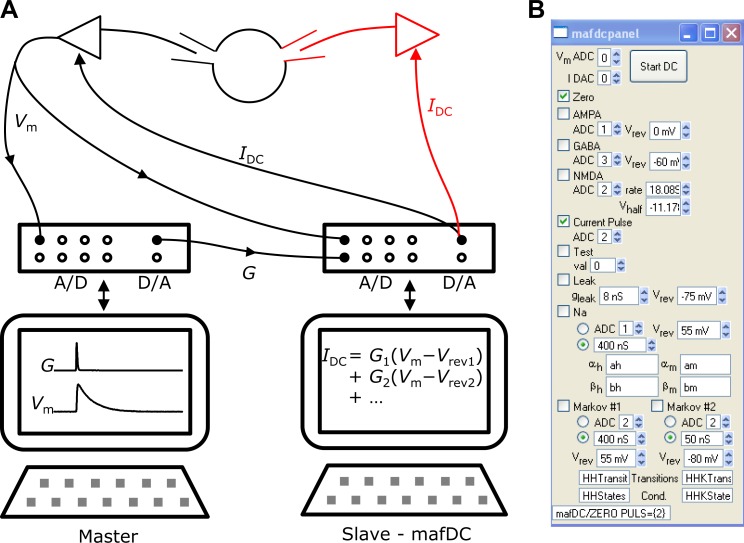
The dynamic clamp is implemented as a master-slave setup (Fig. 1A). The master is responsible for collecting and storing cellular responses and specifies conductance amplitude and time course [G(t)] to be carried out by the dynamic clamp. This requires the familiar equipment normally required for voltage- or current-clamp recordings, i.e., computer, data acquisition system, and amplifier. The slave is responsible for monitoring the requested conductances at any given moment and calculating the appropriate currents. The slave setup measures the membrane potential [Vm(t)] and compares against the reversal potential (Vrev) of each specified conductance to calculate the current output: IDC = G(t) (Vm − Vrev). The dynamic clamp also allows kinetic channel models, such as Hodgkin-Huxley-type models, where the conductance is effectively modeled in the slave setup. Once the user sets the dynamic clamp in motion on the slave setup, the master setup becomes the focus for data acquisition. This architecture allows the experimenter to test rapidly many different conductance parameters, which can be quite powerful.
Fig. 1.
A: dynamic-clamp setup. The user interacts primarily with the master setup to patch the cell and stimulate with current or conductances (G). The master setup also records the cellular responses for later analysis. The dynamic clamp runs continuously on the slave setup, receiving the membrane potential (Vm) from the amplifier, calculating the currents that flow through the various conductances, and then sending the currents to the command input on the amplifier. The black illustration is a single-electrode dynamic-clamp setup where the membrane potential measurement and current injection are done through the same electrode. The red illustration is for the dual-electrode setup where the cell is patched with 2 electrodes, 1 to read membrane potential and 1 to pass current. A/D, analog-to-digital channels; D/A, digital-to-analog channels; Vrev, reversal potential; IDC, dynamic-clamp current. B: mafDC user interface for invoking dynamic clamp on the slave setup in WaveMetrics IGOR. The panel assists the user to select features of the dynamic clamp (checkboxes) and to enter parameters for controlling them. The text field at the bottom of the panel contains a preview of the command to be executed. The dynamic clamp is invoked by hitting the “Start DC” button. See methods and results for explication of components and parameters.
This dynamic clamp is implemented using National Instruments boards. We have used M Series (6221 and 6229) and X Series (6361) boards using older Peripheral Component Interconnect (PCI) and faster PCI Express (PCIe) architecture. The board is controlled using an external operation (XOP) for WaveMetrics IGOR called “mafDC.” IGOR helps simplify the user interaction with the mafDC XOP to specify all of the gain settings for interacting with the amplifier and the parameters and voltage dependence for the various conductances (Fig. 1B). We have used a Dell OptiPlex 745 computer running Windows XP on the slave setup. Faster computers are available all of the time, which could provide additional speed improvements, particularly for computationally intensive components of the dynamic clamp. National Instruments drivers for Apple Macintosh computers are unfortunately inadequate to control a dynamic clamp.
General System Operation
The master setup functions like a familiar electrophysiology rig and is the primary setup that the experimenter interacts with. The experimenter typically executes multiple sweeps of data collection, specifying the conductances upfront, similar to a sweep of current injection (Fig. 1). When a data collection sweep is executed, the conductances are sent to the slave setup, and the resulting activity is recorded by the data acquisition system on the master and analyzed in the normal fashion.
The slave setup works quite differently. To achieve the fastest speeds, no data are saved on the slave. Rather, it constantly monitors the voltage of the cell and the various conductances. Usually the dynamic clamp is set going on the slave setup once at the beginning of the experiment and not interacted with again. Some conductances are controlled by the master setup through an analog-to-digital (A/D) channel on the slave setup (e.g., synaptic conductances), whereas others are tracked autonomously by the slave setup (e.g., channel conductances). Each conductance, G(t), has its own Vrev. The amplifier informs the dynamic clamp of Vm through one A/D channel, and the dynamic clamp calculates the current passed through that conductance: I = G(t) (Vm − Vrev). The total current (IDC) is sent to the command input on the amplifier (Fig. 1).
It is useful to think of the dynamic clamp on the slave setup as a cycle. On each cycle, all of the relevant A/D channels are read by the dynamic clamp, the kinetic conductances (if any) are updated, and the current is calculated and sent out of the D/A of the slave setup to the amplifier. A fast cycle time is ideal to make sure the channel states are up to date, and the current is appropriate to the momentary driving force. The calculations associated with dynamic clamp usually take very little time (see Test modes). The primary constraint is the speed of data acquisition, especially the number of A/D channels the slave setup must read. The mafDC XOP has a testing mode for measuring cycle time to make sure it meets the requirements of the experimenter.
The liquid junction potential is an issue for many recording configurations (Maertz 2008). If the amplifier pipette offset is adjusted to report the true membrane potential (online correction), then no special steps are needed for accurate dynamic clamp. If the pipette offset is not adjusted at the time of recording (offline correction), the value of the reversal potential for each conductance should be offset by the measured or estimated liquid junction potential before starting the experiment.
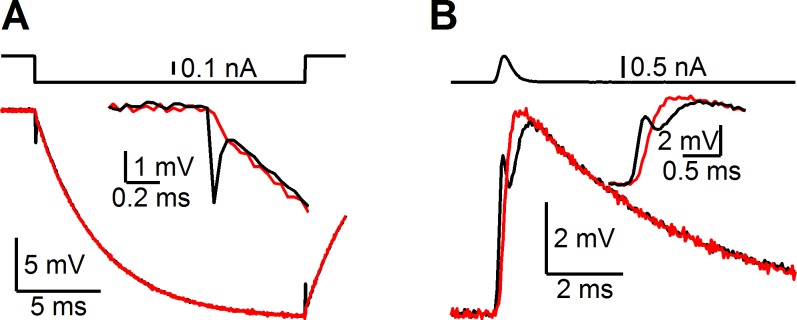
We recommend using two-electrode dynamic clamp if it is practical, one channel to read voltage and the other to pass current. This configuration prevents voltage transients arising from pipette capacitance, such as when large currents are applied to a model cell of nominal capacitance 30 pF and input resistance 100 MΩ (Fig. 2). Such transients are not passed to the cell but can interfere with measurements of membrane potential and analysis of spike timing. It is also possible to use single-electrode dynamic clamp, in which case bridge balance must also be used. Compensation of pipette capacitance is important for accurate clamp using both single- and dual-electrode configurations.
Fig. 2.
Voltage transients in 1- vs. 2-electrode recordings. Recordings are made using 2 electrodes on a single model cell. Current (top traces) is passed through 1 electrode with optimized bridge balance and capacitance compensation. The current-passing electrode reports large, fast voltage transients (bottom black traces). The actual voltage of the model cell shows no such transients (bottom red traces). For square pulse stimuli (A), the transients are well-isolated to the beginning and end of the pulse, but for variable currents (B), such as would be expected in dynamic-clamp experiments, the transients significantly distort membrane potential measurements. Thus dual-electrode dynamic clamp is recommended if at all possible.
Features
The mafDC implementation includes a number of components. Any or all of them can be implemented simultaneously. The features are illustrated below, applying the dynamic clamp to a model cell of nominal capacitance 30 pF and input resistance 500 MΩ (2 nS) using an Axon Instruments MultiClamp 700B in two-electrode mode.
Current pulse.
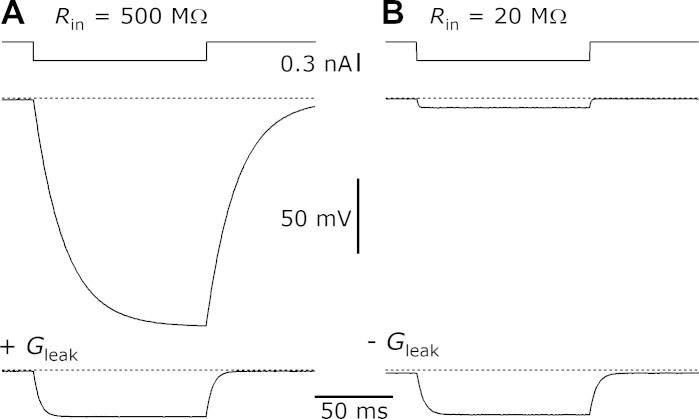
The most basic component of this dynamic-clamp interface is a simple pass-through of current or voltage pulses to make whole cell patching easier. The practical reason for this component is that most amplifiers have only a single command or current input. Commonly, an experimenter passes a small current or voltage pulse to the command input to evaluate seal resistance or cell health. However, the currents passed by the dynamic clamp must also run through the command input during an experiment, and it may be undesirable or impossible to exchange the BNC cables. To simplify this for experiments, the desired current is passed from a D/A on the master setup to an A/D channel on the slave setup, which adds currents arising from the dynamic clamp, if any. An example is shown in Fig. 3, left, where a small current (Fig. 3A, top) is injected into a model cell, causing a change in voltage (Fig. 3A, middle). The dynamic-clamp XOP was initiated on the slave setup using the IGOR command: mafDC PULS={2}, where the parameter tells the mafDC XOP which A/D channel carries the current or voltage pulse (i.e., channel 2).
Fig. 3.
Current pass-through and leak conductance features of the dynamic clamp. Top traces: timing of 300-pA current pulses. Middle traces: changes in voltage measured in a 500-MΩ, 30-pF model cell (A) and a 20-MΩ, 30-pF model cell (B) using the dual-electrode recording setup. Bottom traces: responses of the model cells when an 8-nS leak conductance (Vrev = −75 mV; A) or a −40-nS leak conductance (Vrev = +15 mV; B) was added. Adding the leak conductance in A caused the time constant (τ) to accelerate and the amount of hyperpolarization to decrease. Subtracting the leak conductance in B caused the τ to decelerate and the hyperpolarization to increase. Rin, input resistance.
Leak conductance.
The leak conductance is a constant conductance with some reversal potential (E). It is suitable for making a real cell leakier as well as to establish a resting potential for a model cell (MC). An example is shown in Fig. 3A for a leak conductance of 8 nS with Vrev = −75 mV. This caused a change in the resting potential to −60 mV, which is consistent with the predicted value of VMC = (GMC EMC + Gleak Eleak)/(GMC + Gleak) = (2 nS·0 mV + 8 nS·−75 mV)/(2 + 8 nS) = −60 mV. In addition, there was an acceleration of the time constant (τ) of the model cell from 19.6 to 3.9 ms in response to a current pulse. The fivefold acceleration in τ is consistent with the fivefold decrease in input resistance on addition of the leak conductance. The dynamic-clamp XOP was initiated on the slave setup using the IGOR command: mafDC LEAK={8, −75}, PULS={2}, where the pulse parameter was as described above, and the leak parameters dictated the conductance (8 nS) and Vrev (−75 mV).
It is also possible to use the dynamic clamp for negative conductances such as to make a leaky cell more tight. For example, the model cell in Fig. 3B had nominal capacitance 30 pF and input resistance 20 MΩ (50 nS), so current injection caused a small change in voltage (Fig. 3B, middle). We applied a leak conductance of −40 nS with Vrev = +15 mV to generate a cell with 10-nS conductance and VMC = (50 nS·0 mV + −40 nS·+15 mV)/(50 − 40 nS) = −60 mV. The τ of the model cell slowed from 0.7 to 3.6 ms, consistent with the fivefold increase in input resistance. The dynamic-clamp XOP was initiated on the slave setup using the IGOR command: mafDC LEAK={−40, +15}, PULS={2}, where the pulse parameter was as described above, and parameters dictated the conductance (−40 nS) and Vrev (+15 mV).
Linear synaptic conductances.
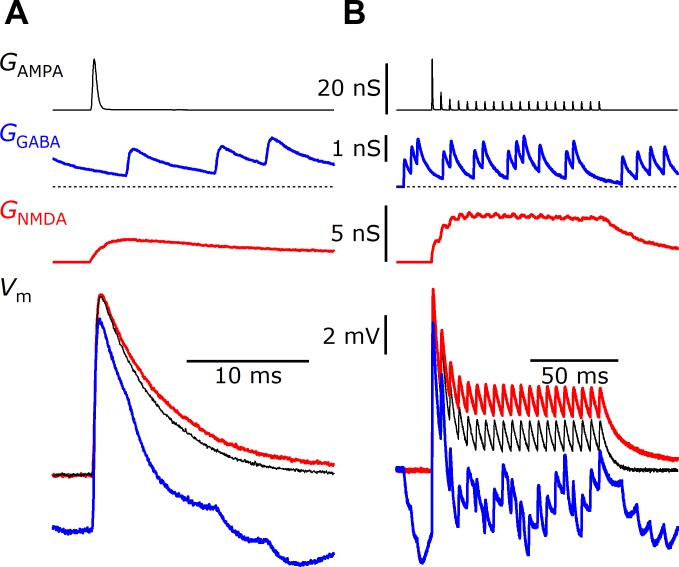
To mimic a synaptic conductance, the master computer sends out the time-varying synaptic conductance through a D/A channel to an A/D channel on the slave setup (Fig. 1, “G”). This is useful for representing AMPA or GABA receptor-mediated conductances. An example is shown in Fig. 4. The AMPA conductance itself is specified by the master setup, in this case based on voltage-clamp measurements of AMPA-mediated excitatory postsynaptic currents (EPSCs; Fig. 4, top black traces; Yang and Xu-Friedman 2009). The AMPA conductance was passed from a D/A on the master setup to the slave setup and applied by the dynamic clamp (Fig. 4, bottom black traces). The conductance specified by the master setup can be simple pulses (Fig. 4A) or complex trains of activity (Fig. 4B). The dynamic-clamp XOP was initiated on the slave setup using the IGOR command: mafDC AMPA={1,0}, LEAK={8, −75}, where the leak parameters were as described above, and the AMPA parameters identified the A/D channel for the slave setup to read the instantaneous AMPA conductance in nanosiemens (channel 1) and the AMPA reversal potential (0 mV).
Fig. 4.
Linear and nonlinear synaptic conductances implemented by dynamic clamp. A 20-nS AMPA (black traces), a 1-nS GABA (blue traces), and a 2-nS NMDA (red traces) conductance were based on synaptic conductances recorded in voltage-clamp experiments and delivered to the model cell using 2-electrode dynamic clamp. The dynamic clamp also specified a leak conductance as in Fig. 3. The cellular responses to AMPA alone (black), AMPA plus GABA (blue), or AMPA plus NMDA (red) are shown in the bottom traces in response to single stimuli (A) or a 200-Hz train of stimuli (B).
The XOP can also mimic inhibitory conductances using the GABA feature. This is useful for studying the interaction of excitatory and inhibitory linear conductances. The GABA conductance is specified just like the AMPA conductance, being sent out a D/A on the master setup to the slave setup. In the example of Fig. 4, the GABA was mimicked as spontaneously active, which visibly hyperpolarized the model cell during single AMPA conductances (Fig. 4A, blue trace) and interacted in a more complex way with the train of AMPA conductances (Fig. 4B, blue trace). The degree of excitation and inhibition depends on the reversal potential specified by the user. For the GABA trials, the dynamic-clamp XOP was initiated on the slave setup using the IGOR command: mafDC AMPA={1,0}, GABA={2,−100}, LEAK={8, −75}, where the leak and AMPA parameters were as described above, and the GABA parameters identified the A/D channel for the slave setup to read the instantaneous GABA conductance in nanosiemens (channel 2) and the GABA reversal potential (−100 mV).
Besides mimicking linear synaptic conductances, these components of the dynamic clamp could also be used experimentally to add or subtract a nonsynaptic but time-varying conductance, for example, a modulator-induced potassium conductance.
Nonlinear synaptic conductances.
These are similar to the linear conductances described above but with a voltage dependence, which would be appropriate for rectifying AMPA conductances or NMDA receptor-mediated conductances. The voltage dependence for the conductance is ideally measured in separate voltage-clamp experiments and can be specified to the dynamic clamp at runtime. An example is shown in Fig. 4, with the 2-nS NMDA conductances (red traces) added on to the 20-nS AMPA conductances (black traces) and the leak conductance. The NMDA conductances are designed on the master setup and passed to the slave setup through separate D/A and A/D channels from the AMPA conductances. The effects of applying both AMPA and NMDA conductances are shown in the bottom red traces. The dynamic clamp determines the degree of unblock of the NMDA conductance according to a Boltzmann relationship: I(t) = (Vrev − Vm) GNMDA(t)/{1 + exp[(Vhalf − Vm)/Vrate]}. The dynamic-clamp XOP was initiated on the slave setup using the IGOR command: mafDC AMPA={1,0},NMDA={2,18,−11},LEAK={8,−75}, where the leak and AMPA were specified as above, and the NMDA parameters specified the A/D channel for the slave setup to read the instantaneous NMDA conductance in nanosiemens (channel 2), the half-activation voltage Vhalf = −11 mV, and the activation rate Vrate = 18 mV. These values were based on recordings of NMDA receptor-mediated EPSCs in bushy cells of the anteroventral cochlear nucleus (AVCN; Pliss et al. 2009). The most appropriate activation parameters may depend on the preparation.
Hodgkin-Huxley-like sodium conductance.
The sodium conductance follows the form described by Hodgkin and Huxley (1952). The XOP tracks the state of three activation (m) gates and one inactivation (h) gate. These gates have voltage-dependent opening and closing rates, conventionally named αm, αh, βm, and βh. These voltage-dependent functions are specified by the user within IGOR as “waves.” These are then passed to the XOP as parameters, and the XOP takes care of updating the state of the gates and calculating the overall conductance. The user may specify the maximal sodium conductance either as a constant value or as a variable conductance determined by an A/D channel. The fixed option is the simplest way to create a constant sodium conductance. The unfixed option allows an experimenter to add different amounts of sodium conductance by changing the D/A output from the master setup (e.g., from 1,000 to 0 nS). The XOP updates the channel model using simple, explicit Euler integration according to the duration of the previous cycle.
An example is shown in Fig. 5. With no sodium conductance, a 20-nS AMPA conductance caused depolarization of the model cell (Fig. 5A, black trace). Then, the dynamic clamp was run with a sodium conductance with αm, αh, βm, and βh based on the model in Rothman and Manis (2003), which led to a spike (Fig. 5A, red trace). The dynamic-clamp XOP was initiated on the slave setup using the IGOR command: mafDC/Nafx=1 AMPA={1,0},LEAK={8,−75},NaV={1000,55,ah,bh,am,bm}, where the leak and AMPA were specified as above, and the NaV parameters specify the maximal sodium conductance [represented “ḡNa” in Hodgkin and Huxley (1952)], Vrev for sodium, and IGOR waves containing the voltage-dependent rate constants for αh, βh, αm, and βm, respectively. The command also included the option /Nafx=1 to indicate that the maximal sodium conductance was a fixed value (1,000 nS). When that flag is turned off (“/Nafx=0”), the XOP reads the maximal sodium conductance from an A/D channel on the slave setup, which allows experimenters to change the size of the sodium current flexibly during an experiment without starting and stopping the dynamic clamp.
Fig. 5.
Sodium conductance implemented by dynamic clamp using Hodgkin-Huxley and Markov models. A: Hodgkin-Huxley sodium conductance. A 20-nS AMPA conductance was applied with (red trace) and without (black trace) a sodium conductance of 1,000 nS. The model cell also had a leak conductance as in Fig. 3. B: responses of the model cell to current pulses of different amplitudes with the Hodgkin-Huxley sodium conductance (red traces) or using an 8-state Markov model derived from the Hodgkin-Huxley equations (blue traces). These dynamic-clamp responses match closely with a pure computer model (black traces).
To verify accuracy, current pulses of various amplitudes were applied to the model cell using the dynamic clamp with a 1,000-nS sodium conductance (Fig. 5B, red traces). These waveforms were compared against a pure computer model that mimicked the experimental conditions as closely as possible. The model was run using Euler integration with a step size of 1 μs (Fig. 5B, black traces). There was generally good agreement between the two. It was particularly clear in this set of comparisons that small changes in resting potential or pipette capacitance compensation could influence the timing or presence of the action potential.
Markov conductance.
The mafDC XOP also allows a highly general approach for implementing a voltage-dependent channel using a Markov model. A Markov model of a channel consists of a series of interconnected channel states as well as the transitions between the different states. These transitions may be voltage-dependent (as in the Hodgkin-Huxley conductance) or voltage-independent. These transitions are specified as parameters by the user. The user also specifies which of the states are conducting and whether they are subconductance states. During each cycle, the dynamic clamp updates the proportion of channels in each state according to the membrane potential and the transition waves specified by the user.
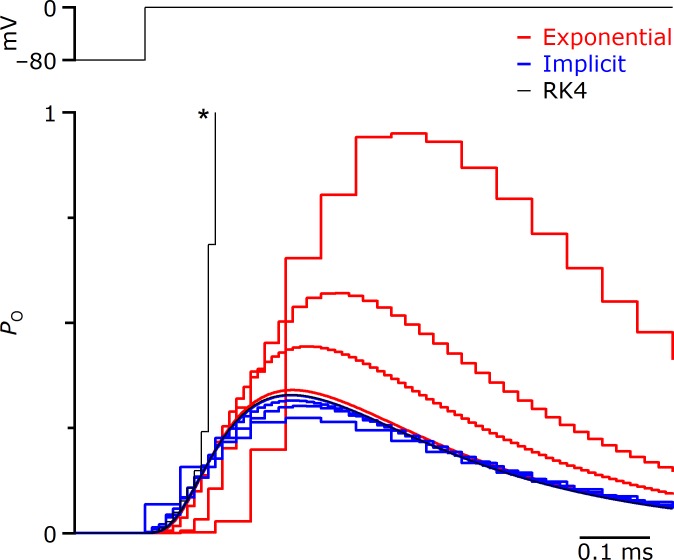
One issue in the development of the Markov conductance was how to update the channel states from one cycle to the next. In pure computer modeling, one often must set step sizes as small as 1 μs for model accuracy and stability. However, the dynamic clamp must run in real time, and the size of the time step (i.e., the cycle time) depends primarily on how many A/D channels are being read (see Test modes), which is constrained by the experimental conditions. The cycle time could be as large as 20–50 μs, which could lead to inaccuracy or instability depending on the method used to update the Markov model.
To evaluate different integration methods, we used pure computer modeling of a representative Markov channel. We used the 12-state sodium channel model of Kuo and Bean (1994) and applied a step change in voltage from −80 to 0 mV. The results of different models are shown in Fig. 6 with the open probability (PO) displayed unsmoothed to facilitate distinguishing between models of different time steps. When we used a 4th-order Runge-Kutta integration method with a step size of 1 μs, it yielded a smooth increase in PO during the 1st 0.1 ms followed by inactivation (Fig. 6, smooth black trace). However, when the step size was increased to 10 μs, the model showed considerable instability (Fig. 6, asterisk). Similar behavior was observed with simple Euler integration and a 4th-order Adams-Bashforth (data not shown). Another explicit integration method, exponential Euler, showed improved stability but was highly inaccurate at step sizes relevant for the dynamic clamp (Fig. 6, red traces). Thus none of the explicit approaches appeared usable.
Fig. 6.
Effects of different integration methods on accuracy for Markov models of ionic conductances. All traces are from a pure computer model, testing different time steps for model integration. The different time steps are distinguished by the durations of the horizontal steps (1, 10, 20, and 50 μs). The Markov model was the 12-state sodium channel model of Kuo and Bean (1994). Top trace: voltage step for the model. Bottom traces: 4th-order Runge-Kutta (RK4; black), exponential Euler (red), and implicit Euler (blue). The implicit Euler had better stability than Runge-Kutta for time steps >10 μs (asterisk) and better accuracy than exponential Euler for time steps as large as 50 μs. PO, open probability.
We therefore considered implicit Euler integration. This method was very stable and reasonably accurate even for large step sizes (Fig. 6, blue traces). Based on this, we implemented implicit Euler integration in the mafDC XOP. One concern is that this method requires solving a system of linear equations during each cycle, which could slow cycle time significantly due to the extra computational overhead and might compromise accuracy. To test this, we used the Hodgkin-Huxley model as transformed into a Markov model (see Johnston and Wu 1995). This Markov model version consists of eight states for which transition rates are given by the same αm, αh, βm, and βh functions. When the dynamic clamp was running the Markov model, the model cell generated spikes that looked very similar to those generated by the pure computer model (Fig. 5B, blue and black traces). This suggests that the computational overhead of the Markov model does not greatly interfere with its accuracy. The dynamic-clamp XOP was initiated on the slave setup using the IGOR command: mafDC/M1fx=1 LEAK={8,−72},PULS={2}, Mrk1={1000,55,HHTransitions,HHStates}, where the pulse and leak parameters were specified as above, and the Mrk1 parameters specified the peak channel conductance (1,000 nS), the reversal potential (55 mV), the transition rates between states (as a matrix of waves specifying the voltage dependence), and a wave specifying the conductance of each state. The /M1fx flag indicates that the peak conductance was constant in this example. A second Markov channel can be added using the “Mrk2” keyword and “/M2fx” flag.
Test modes.
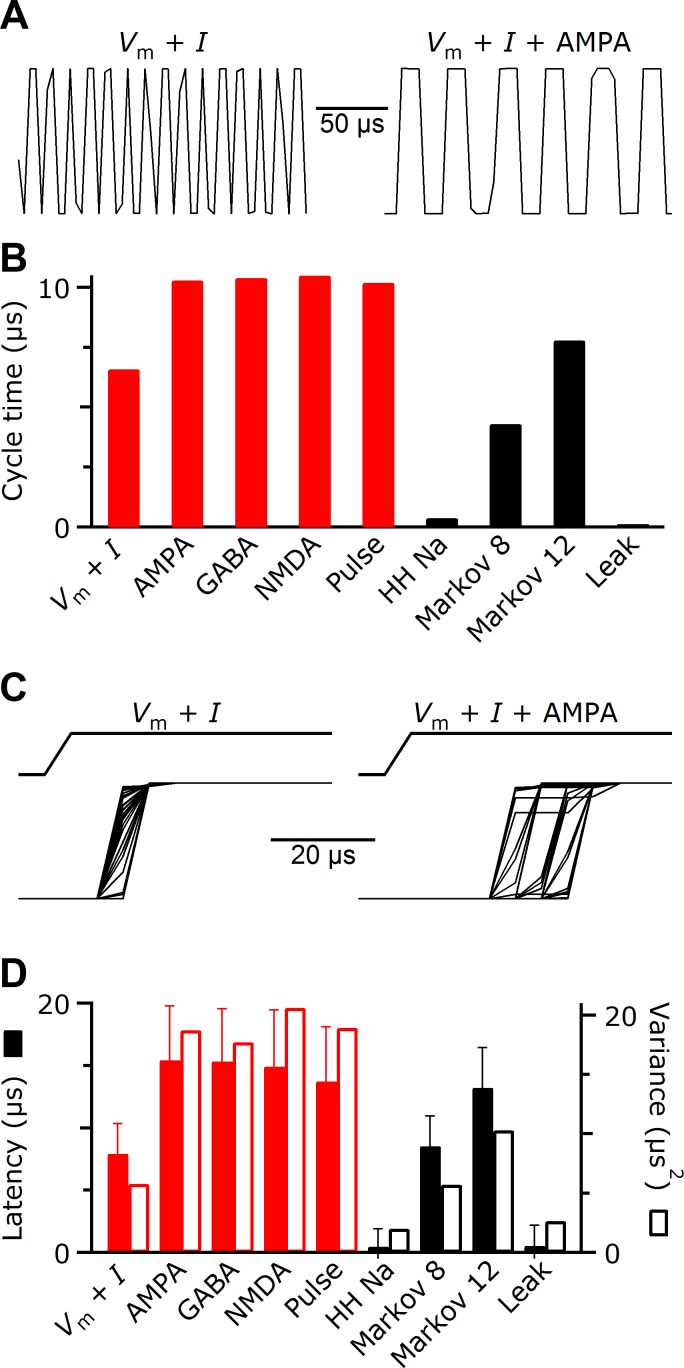
The speed of the dynamic clamp is an important issue (Bettencourt et al. 2008). To evaluate the speed of the dynamic clamp, we included a test mode. In test mode, the dynamic clamp performs all of the requested A/D reads and calculates the current to be passed, but instead of passing the current, it toggles the output between two arbitrary values. In other words, each time the output current switches from negative to positive or positive to negative, it signals that one cycle of the dynamic clamp completed. An oscilloscope on the master setup can be used to measure the cycle time under real experimental conditions.
Examples are shown in Fig. 7A. In the first example, the dynamic-clamp XOP was initiated on the slave setup using the IGOR command: mafDC /TEST=700, where the test flag indicated the dynamic clamp was to be run in test mode, oscillating between the arbitrary values of 700 and −700. Because no conductances were specified, the dynamic clamp only read membrane potential and wrote the current, so the cycle time would represent the fastest the dynamic clamp could go. The cycle time for our slave setup (Dell OptiPlex 745, 2.13-GHz Intel Core 2 6400 CPU, Windows XP Service Pack 3, PCI-6361e) was 6.6 μs, equivalent to a sampling rate of ∼150 kHz (Fig. 7A, left). This was twice as fast as a setup using a PCI-6221, and generally cycle time is likely to depend on both the choice of board and computer. Adding a single conductance (GAMPA) required the reading of a second A/D channel and slowed the cycle time to 16.9 μs (equivalent to 59 kHz), indicating that the read time for the AMPA conductance took ∼10 μs. We measured the impact of each dynamic-clamp component on cycle time for our system setup. The durations are shown in Fig. 7B. The most important consideration is the number of A/D channels to be read. The membrane potential, current pulse, and synaptic conductances each take 6–10 μs. Therefore, the most important consideration for a fast cycle time is reducing the number of conductances to be read. The actual calculations associated with the dynamic clamp were extremely fast. The leak and Hodgkin-Huxley sodium conductances took very little time, reaching cycle rates of 150 and 143 kHz. The Markov conductance took surprisingly little time, considering the computational overhead. The 8-state Markov model of the sodium conductance took ∼4 μs (total cycle time 10.6 μs, or 94 kHz), and the 12-state ∼7 μs (total cycle time 13.6 μs, or 74 kHz). These computations are likely to go much faster on a more up-to-date computer.
Fig. 7.
Using the test functions to measure speed, latency, and jitter of the dynamic clamp. For these measurements, the dynamic clamp was run on a Dell OptiPlex 745 running Windows XP with a National Instruments Peripheral Component Interconnect Express (PCIe) 6361 data acquisition system. Test results are expected to be highly system-specific. A: output of the dynamic clamp in cycle time test mode. The output oscillates between 2 arbitrary values on each cycle of the dynamic clamp, so peak width indicates the duration of each cycle. The cycle time is extremely fast with no conductances specified and only reading membrane potential (left trace) and is slowed somewhat when an AMPA conductance is added (right trace). B: the effect on cycle time of different dynamic-clamp components. Red bars indicate components that require interaction with the A/D system, and black bars indicate purely computational components. As more components are required by the user, these components add to each other for the overall cycle duration. The greatest cost to cycle time comes from reading additional A/D channels. C: example output of the dynamic clamp in echo test mode. A voltage pulse (top traces) is sent to the dynamic clamp, which echoes the voltage out of the D/A (bottom traces, 50 trials overlaid). The latency and variability of the echo are minimal with no conductance implemented (left traces). Latency and variability of the dynamic clamp increase with an AMPA component in the dynamic clamp (right traces). D: the effect on latency (solid bars), jitter (standard deviation of latency, error bars), and variance (open bars) of different dynamic-clamp components. As more components are required, the latencies and variances of multiple components sum.
Another issue is the latency before the dynamic clamp reacts to a change in membrane potential or specified conductance amplitude and the standard deviation of this latency (“jitter”). To measure these quantities, there is an “echo” test mode in which the dynamic clamp performs all of the requested A/D reads and calculates the current to be passed, but instead of passing the current, the D/A output simply echoes the A/D channel carrying the membrane potential. Echo test mode is invoked by using a 0 for the test value: mafDC /TEST=0. To use echo mode, the master setup sends any signal, such as a square pulse, to the membrane potential input on the slave setup, and the echo from the dynamic clamp is recorded (Fig. 7C). (The A/D conversion on the master setup itself contributes no detectable latency or jitter.) We measured the mean and variance of the latency between pulse and echo with different dynamic-clamp features. The added latency was ∼15 μs for each component that required reading another A/D channel and for purely computational components was less (Fig. 7D). The variance of the echo timing also increased with additional components. For multiple components, latency and variance combine additively. As the square root of variance, jitters of different components do not simply add but remained <10 μs in most situations (error bars in Fig. 7D). Thus, similar to the cycle time, the latency and variance of the echo depended on the number of A/D channels being read.
The effects of latency and jitter will depend on the experimental context. Test mode in this dynamic clamp allows experimenters to measure latency, variance, and jitter to determine whether it will be an issue for their specific experimental conditions.
Dynamic Clamp in Real Neurons
We confirmed the operation of the dynamic clamp using real neurons, bushy cells in the AVCN. These were prepared as described previously and recorded in slices using two-electrode dynamic clamp (Yang and Xu-Friedman 2009). These procedures were approved by the Institutional Animal Care and Use Committee at the University at Buffalo. Sagittal slices (150 μm) of the AVCN were cut from postnatal day 15 (P15) CBA/CaJ mice. Recordings were made at 34°C in external solution containing the following (in mM): 125 NaCl, 26 NaHCO3, 2.5 KCl, 1.25 NaH2PO4, 20 glucose, 1.5 CaCl2, 1 MgCl2, 4 Na-l-lactate, 2 Na-pyruvate, 0.4 Na-l-ascorbate, bubbled with 95% O2-5% CO2. Recordings were carried out using an Axon Instruments MultiClamp 700B with two 3- to 4-MΩ pipettes containing (in mM): 130 KMeSO3, 10 NaCl, 2 MgCl2, 0.16 CaCl2, 0.5 EGTA, 10 HEPES, 4 Na2ATP, 0.4 NaGTP, and 14 Tris-CrPhos (pH 7.2, 302 mosmol/kgH2O).
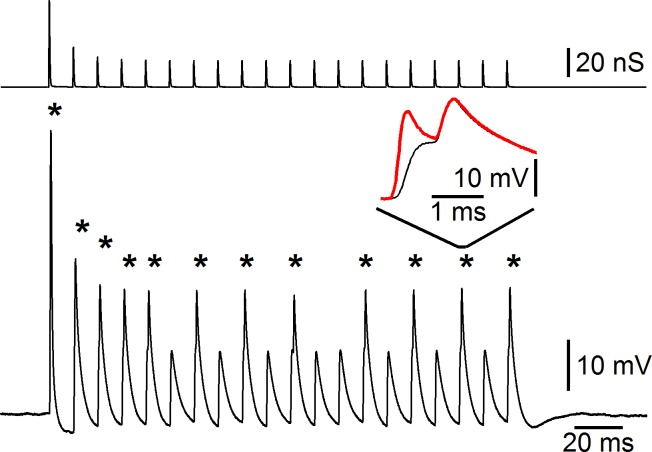
The AMPA conductance (Fig. 8, top trace) was delivered by the master setup to the slave setup and applied by the dynamic clamp. It was based on voltage-clamp measurements of AMPA-mediated EPSCs (Yang and Xu-Friedman 2009). The bushy cell responded with excitatory postsynaptic potentials (EPSPs) and spikes (Fig. 8, asterisks, bottom trace). This configuration largely avoids series resistance and reduces pipette capacitance errors compared with the single-electrode patch. The AMPA conductance was passed from a D/A on the master setup to the slave setup and applied by the dynamic clamp (Fig. 4, bottom black traces).
Fig. 8.
Dynamic clamp of a real neuron. Recordings are made using dual-electrode dynamic clamp of a bushy cell in the anteroventral cochlear nucleus. Top trace: AMPA-like conductance applied to the bushy cell, showing strong depression. Bottom trace: response of the bushy cell. The cell shows spikes after most excitatory postsynaptic potentials (EPSPs; asterisks). Spikes in bushy cells are normally small and undershoot 0 mV (Oertel 1983). Inset: comparison between the membrane potential recorded through the current-passing electrode (red trace) and the voltage-reading electrode (black) for the 18th pulse in the train of stimuli. The membrane potential that is recorded by the current-passing electrode, which is similar to single-electrode dynamic clamp, is subject to significant capacitance transients that could be confused with action potentials in this preparation.
DISCUSSION
The dynamic-clamp system described here is relatively easy to implement, using commonly available hardware that is not overly expensive. The user interface through WaveMetrics IGOR is not difficult to learn, and indeed the IGOR environment has already been adopted by quite a few laboratories for collecting and analyzing electrophysiology data. The functionality of the synaptic and channel conductances is very useful for a range of experiments. The Markov conductance is particularly powerful, and the implicit Euler integration provides exceptional stability and accuracy. Furthermore, the test feature makes the system quality easy to assess. We find that this system is extremely fast, even on older hardware, and interruption from the computer operating system is not a significant issue. Thus this dynamic-clamp tool likely will be useful both to new and existing users of dynamic clamp.
Limitations and Future Directions
The mafDC XOP is generally capable of imitating many types of synaptic and intrinsic conductances. However, there are certain major classes of channels that are not currently implemented. One important set of channels are those that are gated by both voltage and ligand, such as calcium-activated potassium channels, sodium-activated potassium channels, and cyclic nucleotide-activated channels. Even if their gating were simplified to purely ligand-dependent, it would be difficult to implement. For example, calcium-activated potassium channels are remarkable for the burst behavior they produce in neurons. Calcium levels rise during periods of activity, which activates KCa channels, which then repolarize the membrane and cause calcium levels to decline. The dynamic-clamp interface would need to read both membrane potential and calcium concentration to drive such behavior, which it is not able to do at present. Given the importance of these channels to neuronal function, it would be desirable to implement this in future versions. Furthermore, this dynamic clamp cannot directly control calcium concentration, although there are approaches for that (Idoux and Mertz 2011).
A second major issue is that the speed of the interface decreases with additional conductance amplitudes that need to be read (Fig. 7). This could be a problem if there are multiple types of synaptic receptors being mimicked (e.g., AMPA, GABA, and NMDA). This may possibly be resolved by taking a different approach to the dynamic-clamp architecture. Currently, the dynamic clamp is centralized on a single slave setup, so all of the A/D reads must be done serially. A different approach would be to do the conductance calculations in parallel on separate interfaces, each responsible for a single conductance. This would require two reads per cycle at a maximum for each interface. This is analogous to how the nervous system actually functions, where each channel acts independently from the others. This does not seem practical for the system described in Fig. 1. However, there are devices, such as the Arduino Due, that can integrate A/D and computation in a highly compact and inexpensive form. We are currently experimenting with this platform to provide a more rapid parallel interface.
Another issue for dynamic clamp are interruptions generated by the operating system. Operating systems such as Windows may occasionally occupy processor time, thereby lengthening cycle time. In our experience, this is not a major issue. We can visualize such interruptions using the test feature in the dynamic clamp, and they are rare and brief except when doing tasks that are obviously time-consuming such as accessing the hard drive. One solution to these operating system interruptions is to use a so-called real-time operating system such as some versions of Linux (Ortega et al. 2014). These may require increased user sophistication.
GRANTS
This work was supported by Grant 1208131 from the National Science Foundation.
DISCLOSURES
No conflicts of interest, financial or otherwise, are declared by the author(s).
AUTHOR CONTRIBUTIONS
B.R., A.N., and M.A.X.-F. conception and design of research; Y.Y., T.A., and M.A.X.-F. performed experiments; Y.Y. analyzed data; Y.Y. and M.A.X.-F. interpreted results of experiments; Y.Y. prepared figures; Y.Y. and M.A.X.-F. drafted manuscript; Y.Y., A.N., and M.A.X.-F. edited and revised manuscript; Y.Y., T.A., B.R., A.N., and M.A.X.-F. approved final version of manuscript.
ACKNOWLEDGMENTS
We thank L. S. Milescu for sharing insights into improving cycle time on the dynamic clamp in QuB (Milescu et al. 2008), R. Manning for advice on implementing the implicit Euler integration method, and T. Ngodup, H. Yang, and X. Zhuang for helpful comments on the manuscript.
REFERENCES
- Bettencourt JC, Lillis KP, Stupin LR, White JA. Effects of imperfect dynamic clamp: computational and experimental results. J Neurosci Methods 169: 282–289, 2008. [DOI] [PMC free article] [PubMed] [Google Scholar]
- Hodgkin AL, Huxley AF. A quantitative description of membrane current and its application to conduction and excitation in nerve. J Physiol 117: 500–544, 1952. [DOI] [PMC free article] [PubMed] [Google Scholar]
- Idoux E, Mertz J. Control of local intracellular calcium concentration with dynamic-clamp controlled 2-photon uncaging. PLoS One 6: e28685, 2011. [DOI] [PMC free article] [PubMed] [Google Scholar]
- Johnston D, Wu SM. Foundations of Cellular Neurophysiology. Cambridge, MA: MIT Press, 1995, p. 676. [Google Scholar]
- Kemenes I, Marra V, Crossley M, Samu D, Staras K, Kemenes G, Nowotny T. Dynamic clamp with StdpC software. Nat Protoc 6: 405–417, 2011. [DOI] [PMC free article] [PubMed] [Google Scholar]
- Kuo CC, Bean BP. Na+ channels must deactivate to recover from inactivation. Neuron 12: 819–829, 1994. [DOI] [PubMed] [Google Scholar]
- Maertz WH. The Axon Guide: A Guide to Electrophysiology & Biophysics Laboratory Techniques (3rd ed.) Sunnyvale, CA: MDS Analytical Technologies, 2008, p. 262. [Google Scholar]
- Milescu LS, Yamanishi T, Ptak K, Mogri MZ, Smith JC. Real-time kinetic modeling of voltage-gated ion channels using dynamic clamp. Biophys J 95: 66–87, 2008. [DOI] [PMC free article] [PubMed] [Google Scholar]
- Oertel D. Synaptic responses and electrical properties of cells in brain slices of the mouse anteroventral cochlear nucleus. J Neurosci 3: 2043–2053, 1983. [DOI] [PMC free article] [PubMed] [Google Scholar]
- Ortega FA, Butera RJ, Christini DJ, White JA, Dorval AD 2nd. Dynamic clamp in cardiac and neuronal systems using RTXI. Methods Mol Biol 1183: 327–354, 2014. [DOI] [PMC free article] [PubMed] [Google Scholar]
- Pliss L, Yang H, Xu-Friedman MA. Context-dependent effects of NMDA receptors on precise timing information at the endbulb of Held in the cochlear nucleus. J Neurophysiol 102: 2627–2637, 2009. [DOI] [PMC free article] [PubMed] [Google Scholar]
- Prinz AA, Abbott LF, Marder E. The dynamic clamp comes of age. Trends Neurosci 27: 218–224, 2004. [DOI] [PubMed] [Google Scholar]
- Robinson HP, Kawai N. Injection of digitally synthesized synaptic conductance transients to measure the integrative properties of neurons. J Neurosci Methods 49: 157–165, 1993. [DOI] [PubMed] [Google Scholar]
- Rothman JS, Manis PB. The roles potassium currents play in regulating the electrical activity of ventral cochlear nucleus neurons. J Neurophysiol 89: 3097–3113, 2003. [DOI] [PubMed] [Google Scholar]
- Sharp AA, O'Neil MB, Abbott LF, Marder E. Dynamic clamp: computer-generated conductances in real neurons. J Neurophysiol 69: 992–995, 1993. [DOI] [PubMed] [Google Scholar]
- Yang H, Xu-Friedman MA. Impact of synaptic depression on spike timing at the endbulb of Held. J Neurophysiol 102: 1699–1710, 2009. [DOI] [PMC free article] [PubMed] [Google Scholar]


