

Abstract
Clustering of obesity, coronary artery disease, and cardiovascular disease risk factors is observed in epidemiological studies and clinical settings. Twin and family studies have provided some supporting evidence for the clustering hypothesis. Loci nearest a lead single nucleotide polymorphism (SNP) showing genome-wide significant associations with coronary artery disease, body mass index, C-reactive protein, blood pressure, lipids, and type 2 diabetes mellitus were selected for pathway and network analyses. Eighty-seven autosomal regions (181 SNPs), mapping to 56 genes, were found to be pleiotropic. Most pleiotropic regions contained genes associated with coronary artery disease and plasma lipids, whereas some exhibited coaggregation between obesity and cardiovascular disease risk factors. We observed enrichment for liver X receptor (LXR)/retinoid X receptor (RXR) and farnesoid X receptor/RXR nuclear receptor signaling among pleiotropic genes and for signatures of coronary artery disease and hepatic steatosis. In the search for functionally interacting networks, we found that 43 pleiotropic genes were interacting in a network with an additional 24 linker genes. ENCODE (Encyclopedia of DNA Elements) data were queried for distribution of pleiotropic SNPs among regulatory elements and coding sequence variations. Of the 181 SNPs, 136 were annotated to ≥1 regulatory feature. An enrichment analysis found over-representation of enhancers and DNAse hypersensitive regions when compared against all SNPs of the 1000 Genomes pilot project. In summary, there are genomic regions exerting pleiotropic effects on cardiovascular disease risk factors, although only a few included obesity. Further studies are needed to resolve the clustering in terms of DNA variants, genes, pathways, and actionable targets.
Keywords: cluster analysis, gene networks, genetic pleiotropism
The 2010 Global Burden of Disease Study reported on 235 causes of deaths in 187 countries of the world.1 In 2010, there were 52.8 million deaths, and ischemic heart disease and stroke accounted for 12.9 million of these deaths, that is, 1 in 4 deaths worldwide. In the United States, there were a total of 2.5 million deaths in the same year according to the Centers for Disease Control and Prevention, with 727 165 of them (or 29%) caused by heart disease and stroke. Heart disease was the leading cause accounting for 24% of all deaths.
Common risk factors for cardiovascular disease (CVD) have been identified and found to be highly prevalent in the United States and the rest of the developed world. In the United States, in adults aged ≥20 years, the prevalence of age-adjusted hypertension reached 30.0% and was 27.8% for high cholesterol (>240 mg/dL or high-cholesterol medication), 68.8% for overweight and obesity, and 11.4% for diagnosed and undiagnosed diabetes mellitus.2 On the basis of the National Health and Nutrition Examination Survey of 1999 to 2000, the prevalence of high-sensitivity C-reactive protein (hs-CRP) above 3 mg/L but below 10 mg/L was 23.1% among adults with a normal lipid profile.2 In addition, 19.3% of adults aged ≥18 years were smokers, and 49.1% met neither the aerobic activity nor muscle-strengthening physical activity guidelines from the federal 2008 Physical Activity Guidelines Advisory Committee Report.3
Even though each of these risk factors individually imparts an increased risk of CVD, the presence of multiple risk factors translates into an even higher risk level. This is well illustrated by the widespread popularity of the metabolic syndrome concept, a constellation of risk factors that confers an elevated risk of cardiometabolic anomalies and CVD. Decades of research on common CVD risk factors have established that they often differ between men and women, are influenced by age and ethnicity, and are modulated by behavioral choices, including poor diet and a sedentary lifestyle, environmental conditions, and one's genetic profile. Even though it is well recognized that all these risk factors taken individually are characterized by a significant genetic component, there are uncertainties about the true magnitude of risk factor clustering, as well as on the role of genetic factors in risk factor clustering in individuals.
This review emphasizes the potential role of genetic determinants on CVD risk factor clustering with special reference to coaggregation of obesity with coronary artery disease (CAD) and CVD risk factors. The contribution of such determinants to the biology of cardiometabolic diseases will be discussed.
Evidence for Genetic Covariation Among CVD Risk Factors
Heritability of Individual CVD Risk Factors
Using several twin and family study designs, studies have revealed that there is a significant genetic component to human variability in CVD risk factors when considered individually. In Table 1, we have summarized the broad-sense heritability estimates emerging from studies that have focused on individual CVD risk factors. These risk factors are all characterized by familial resemblance and significant heritability estimates.4,5 All these CVD risk factors have been the target of genome-wide association studies (GWAS) aimed at identifying common single nucleotide polymorphisms (SNPs) and at quantifying how much of the phenotypic variance is actually captured by them.
Table 1. Commonly Reported Heritability Levels for CVD Risk Factors.
| Phenotype | Estimated Heritability, % |
|---|---|
| Body composition | |
| BMI | 25–60 |
| Body fat | 25–40 |
| Abdominal obesity | 40–55 |
| Insulin/glucose | |
| Fasting glucose | 10–75 |
| Fasting insulin | 20–55 |
| Insulin resistance or T2DM | 46–90 |
| Lipids | |
| Triglycerides | 25–60 |
| LDL-C | 25–60 |
| HDL-C | 30–80 |
| Total cholesterol | 50–60 |
| BP | |
| Systolic BP | 20–70 |
| Diastolic BP | 10–50 |
| Hypertension | 50 |
| Others | |
| hs-CRP | 25–55 |
| Hemostasis-related traits | 20–60 |
| Microalbuminuria | 30 |
The range of heritability estimates is derived from the study6–23. BP indicates blood pressure; BMI, body mass index; CVD, cardiovascular disease; HDL-C, high-density lipoprotein cholesterol; hs-CRP, high-sensitivity C-reactive protein; LDL-C, low-density lipoprotein cholesterol; and T2DM, type 2 diabetes mellitus.
Heritability levels ranging from 25% to 70% for body mass index (BMI) or total body fatness have been reported, although higher and lower heritability values are not uncommon.24 For abdominal obesity, when total adiposity is taken into account, heritability estimates on the order of 50% have been reported.24,25 For adiposity-related traits and for other CVD traits, heritability values derived from twin studies tend to be higher26 than those calculated from nuclear family data.27 Levels of abdominal visceral fat are also characterized by significant familial aggregation and heritability levels ranging from 48% to 56% have been found in 2 family studies with adjustment for total adiposity.28,29
Heritability estimates range from 20% to 55%30–32 for fasting insulin; from 10% to 63%6,33–35 for fasting glucose; and from 46% to 90% for insulin resistance or type 2 diabetes mellitus (T2DM). Significant genetic effects are evident for fasting plasma or serum lipoprotein traits, with commonly reported heritability values ranging from 25% to 60% for triglycerides, 50% to 60% for total cholesterol (TC), 30% to 80% for high-density lipoprotein cholesterol (HDL-C), and 26% to 60% for low-density lipoprotein cholesterol (LDL-C).36,37 Genetic components are also significant for resting systolic blood pressure (20%–70%), diastolic blood pressure (10%–50%), and hypertension (clustering ≈50%).7,25,37 In the Stanislas Family Study of 320 nuclear families, variance component analysis did not reveal the presence of a significant genetic effect to variation in hs-CRP.8 In the Jackson Heart Study, the heritability of hs-CRP in blacks reached 45% after adjustment for age, sex, and BMI.9 Comparable heritability levels have been reported in Japanese Americans (30%), twins many of which with hypertension (56%) and siblings from the Diabetes Heart Study (37% after adjustment for age, sex, ethnicity, and BMI).10–12
In spite of remaining uncertainties, the general picture emerging is one in which genetic variations have pervasive influences on common individual risk factors for CVD. Heritability levels are statistically significant and, although not reviewed here, complex genotype–nutrient, genotype– overfeeding, genotype–exercise, and genotype–medication interactions on these individual risk factors are commonly observed.
Statistical Evidence for CVD Risk Factor Clustering
The clustering of risk factors in adults has been observed for many years in epidemiological studies and in the clinical setting. Whether the commonly observed clustering results from the pleiotropic effects of specific genes and genomic variants has proven to be a complex question to address. However, several observational twin and family studies have provided quantitative but theoretical proof-of-concept evidence for the hypothesis that there are latent or unidentified genes and DNA sequence variants exerting pleiotropic influences on multiple CVD risk factors.
In one early study of the phenomenon, data on 2508 adult male twins suggested the presence of a common underlying factor mediating the clustering of hypertension, diabetes mellitus, and obesity.38 This latent common factor was influenced by both the genetic and environmental effects (59% genetic and 41% environmental). Furthermore, the concordance rate for the clustering of all the 3 conditions in the same individuals was 5-fold higher in monozygotic compared with dizygotic twin pairs. Similar results for the prevalence of dyslipidemic hypertension in male twins were reported by Selby et al.39 On the basis of the San Antonio Family Heart Study cohort, it was concluded that the hypothesis of a common set of genes influencing insulin levels together with other insulin resistance syndrome-related traits was supported by the data, with 1 exception: absence of pleiotropy between insulin and resting blood pressure.40 The Swedish Adoption/Twin Study of Aging revealed that 5 principal components computed from the measurements of BMI, insulin levels, triglycerides, HDL-C, and resting systolic blood pressure were all significantly influenced by a single latent genetic factor.41
The association of a parental history of diabetes mellitus and hypertension with other common CVD risk factors was evaluated in the Atherosclerosis Risk in Communities Study of middle-aged adults.42 Marked associations between a parental history of risk factors and the clustering of the same metabolic disorders in the offspring generation were observed. The strongest evidence for parent–offspring resemblance was observed with a parental history of both diabetes mellitus and hypertension.42 Hyperinsulinemia and insulin resistance increase the prevalence of dyslipoproteinemia.43–45 In a study of 682 female twins aged 30 to 91 years, Selby et al45 showed that the prevalence of the small, dense LDL particle phenotype rose from ≈6% in women with no other common CVD risk factors to 100% in women who had 4 risk factors. In the San Antonio Heart Study, 549 nondiabetic individuals with a parental history of diabetes mellitus were compared with 1167 nondiabetic individuals without such a history.46 Those with a parental history of T2DM had a more atherogenic pattern of risk factors, including higher triglycerides and lower HDL-C. However, the differences in blood lipids and lipoproteins between the 2 groups became nonsignificant when the data were adjusted for BMI, waist-to-hip circumference ratio, and fasting insulin levels.
There is a strong evidence in support of the notion that insulin resistance, hyperinsulinemia, or parental/familial history of diabetes mellitus or impaired glucose tolerance is associated with a higher probability in adult offspring of exhibiting an atherogenic risk profile or experiencing myocardial infarction.30,32,43,47 This notion was supported by 2 longitudinal studies, such as the 8-year follow-up of the Nurses' Health Study31 and the 12-year follow-up of the Multiple Risk Factor Intervention Trial Study.47a For instance, in the Nurses' Health Study, the risk for nonfatal or fatal myocardial infarction or stroke was 4 to 7 times greater over an 8-year period in 1483 diabetics versus 114 694 nondiabetics, with 20% of the diabetic cases having a parental history of myocardial infarction, whereas the corresponding value was 14% in the nondiabetic women.31
Cross-trait familial studies between indicators of body fat or fat distribution and other common CVD risk factors have suggested the presence of some genetic pleiotropism. For instance, findings based on the Quebec Family Study suggested a moderate common familial basis, genetic or common environment in the covariation between total adiposity and blood pressure,48 as well as between total adiposity and fasting plasma insulin.49 However, in the same cohort, the covariation between plasma lipids and total adiposity was associated more strongly with a shared environmental than a genetic hypothesis.50 Moreover, genes or familial nongenetic factors with pleiotropic effects were reported to influence, at least to a certain degree, both the abdominal visceral fat and plasma fasting insulin levels in the HERITAGE Family Study.51 However, there was no evidence of pleiotropy between measures of resting blood pressure and body composition in another study.52
Another line of evidence for the presence of genetic covariation affecting multiple CVD risk factors comes from family, sibling, and twin studies reporting familial aggregation of metabolic syndrome or some of its manifestations. The fact that the metabolic syndrome is generally not defined by a single underlying factor with a multiplicity of metabolic effects has been used as an argument against a genetic signature with pleiotropic effects. Thus, it has been reported that the metabolic syndrome was best defined by 2,7,53,54 3,55–58 or 459–61 principal components or factors. A trend of these studies is that insulin-related variables correlate with determinations of glucose and obesity, and lipid traits are frequently included in 1 factor, whereas measures related to blood pressure fall in a separate factor. In contrast, others have provided support for the notion that the constellation of manifestations can be described by a single underlying factor.62,63 From a body of data, the heritability of human variation in metabolic syndrome has been estimated to be ≈30% to 40%.13
In summary, we conclude that there is reasonably strong evidence from genetic epidemiology reports that CVD risk factors taken individually are characterized by the presence of significant genetic effects (broad-sense heritability). More comprehensive and larger studies are needed on this topic to clarify whether there are age, sex, and ethnic differences in these genetic effects. However, the evidence for genetic pleiotropy affecting multiple clinically relevant CVD risks factors is less abundant. But what is available strongly suggests that there are genomic loci exerting pleiotropic effects on multiple CVD risk factors. Here, the challenge is the development of a larger and more comprehensive body of data on the magnitude of the underlying genetic trait and to resolve it in terms of DNA variants, genes, and pathways.
Pathway and Network Analysis
Genomic Regions Associated With a Specific Risk Factor
To assess whether there is any evidence of genes and genomic regions contributing to variability of CVD risk, obesity, and other CVD risk factors, we combined the results reported in the most recent genome-wide association meta-analyses for the following traits, such as BMI,64 CAD,65 CRP,66 blood pressure,67 lipids,68 and T2DM.69 We used the number of loci specified by the authors of each meta-analysis to compile the final list of loci for each trait. Thus, the final list included loci identified in previous GWAS reports that may or may not have been replicated at the genome-wide level, as well as newly identified genome-wide significant loci from the most recent meta-analysis. For example, 56 of the 97 BMI loci reaching genome-wide significance in the latest GIANT consortium meta-analysis were novel,64 whereas the CARDIoGRAMplusC4D consortium meta-analysis of CAD GWAS identified 15 novel loci while only replicating 22 of the 30 established loci.65 Similarly, 8 novel loci were identified in the latest T2DM GWAS meta-analysis, whereas only 30 of the 57 established loci were replicated.69 Thus, of the 65 T2DM loci, only 38 reached genome-wide significance in the latest meta-analysis. For the remaining traits, 11 of the 18 CRP loci, 16 of the 28 blood pressure loci, and 62 of the 157 lipids loci reaching genome-wide significance were novel, respectively.
It should be noted that the loci included in this report for blood pressure were derived from GWAS of systolic and diastolic blood pressure analyzed as continuous traits and hypertension analyzed as a categorical trait. The loci included for BMI were identified from a meta-analysis that examined BMI as a continuous trait, although previous GWAS reports have examined BMI categorically in terms of obesity status. The GWAS loci for CRP and lipid traits were derived from meta-analysis of continuous traits, whereas the loci for coronary heart disease and T2DM were derived from meta-analysis of categorical traits. The lipid and lipoprotein loci include loci identified for the following traits, such as HDL-C, LDL-C, TC, and triglycerides.
Table 2 provides a summary of the number of loci by trait with the sample size of the study and the percentage of the trait variance accounted for by these loci as defined in the relevant publication. The complete list of the lead SNPs along with the traits was associated together with the level of significance, and the closest gene as reported in the original publications is presented in Online Table I to VI.
Table 2. Summary of GWAS Loci.
| Trait | n | No. of Loci* | % Variance Explained by Loci | Reference |
|---|---|---|---|---|
| BMI | 339 224 | 97 | 2.7 | Locke et al64 |
| CAD | 67 376 cases; 142 664 controls | 45 | 10.6 | Deloukas et al65 |
| CRP | 81 870 | 18 | ≈5 | Dehghan et al66 |
| BP | 203 056 | 28 | 0.90 | Ehret et al67 |
| Hypertension | 11 | |||
| Diastolic BP | 26 | |||
| Systolic BP | 25 | |||
| Lipids† | 188 577 | 157 | Willer et al68 | |
| HDL-C | 62 | ≈12–14 | ||
| LDL-C | 30 | ≈12–14 | ||
| TC | 40 | ≈12–14 | ||
| Triglycerides | 32 | ≈10–13 | ||
| Type 2 diabetes mellitus | 34 840 cases; 114 981 controls | 65 | 5.7 | Morris et al69 |
BMI indicates body mass index; CAD indicates coronary artery disease; CRP, C-reactive protein; GWAS, genome-wide association study; HDL-C, high-density lipoprotein cholesterol; LDL-C, low-density lipoprotein cholesterol; and SNP, single nucleotide polymorphism.
Number of loci as specified by authors of each meta-analysis. Thus, loci may or may not have been significant at the genome-wide level of P≤5×10⁻⁸.
For individual lipid and lipoprotein traits, number of loci represents those whose strongest association was for the specified trait. As multiple SNPs within the same loci (ie, chromosomal region) may have reached genome-wide significance, the number of loci across individual traits amounts to >157.
Identification of Candidate Pleiotropic Regions and Their Distributions Across CVD Traits
Our definition of pleiotropism relates to chromosomal region rather than to individual SNPs or genes. Pleiotropic loci are defined solely based on the colocalization of genetic associations and not on any biochemical or functional evidence. Chromosomal regions were defined as pleiotropic if they contain SNP(s) that were associated with ≥2 of the 6 traits or if 2 SNPs located within 150 kb from each other were associated with ≥2 traits. It should be noted that we used the SNPs to identify chromosomal regions that may harbour genes and sequence variants associated with multiple traits. On the basis of this definition, we found a total of 87 autosomal regions (a total of 181 SNPs, including single SNPs that were associated with 2 highly correlated traits, eg, TC and LDL-C) mapping to 56 genes. Notably, in several instances, multiple SNPs were mapped to the same gene. In the majority of cases, the nearest gene could be uniquely identified for each SNP. However, in some cases the SNP was sufficiently proximal to multiple genes (usually within 100 kb range). In these cases, all possible genes were mapped to that SNP (eg, genes ApoE-ApoC1 mapping to SNP rs445925).
The distribution of pleiotropy for the selected GWAS SNPs was examined by considering their associations with multiple traits. A total of 43 autosomal regions were identified for CAD risk with SNPs associated at P<1×10⁻⁴ and associations on 35 regions reached genome-wide significance (P<5×10⁻⁸). Of the 43 regions, 19 coincided with other CVD risk factor trait loci: 11 regions coincided with lipid/lipoprotein loci (5 with TC/LDL-C; 3 with TC/LDL-C and HDL-C/triglycerides, 1 with HDL-C/triglycerides, 1 with triglycerides, and 1 with HDL-C), 4 regions colocalized with blood pressure/hypertension (although none of the blood pressure signals reached genome-wide significance), 1 with CRP, 1 with BMI, and 1 with T2DM. In addition, the APOE-APOC1 cluster on chromosome 19 harbored associations with all 4 lipid traits, BMI and CRP in addition to CAD (Figure 1; Online Table VII).
Figure 1. Pleiotropy of genes with primary association to (A) coronary artery disease (CAD) and (B) body mass index (BMI).

Genes were identified based on their proximity to genome-wide association study–associated CAD and BMI single nucleotide polymorphisms (SNPs). Traits and genes are represented in columns and rows, respectively. The association of a gene to each trait is indicated in red with the color intensity proportional to the number of trait-associated SNPs mapping to that gene. The heatmap is based on a 2-way average linkage hierarchical clustering such that genes and traits are clustered based on the similarities of trait-wide associations. Heatmaps for the other cardiovascular disease traits are depicted in Online Figure I. BMI indicates body mass index; CAD, coronary artery disease; CHOL, total cholesterol; CRP, C-reactive protein; HDL, high-density lipoprotein cholesterol; HTN, hypertension; LDL, low-density lipoprotein cholesterol; T2DM, type 2 diabetes mellitus; and TRIG, triglycerides.
A total of 102 loci were reported for BMI and all of them were genome-wide significant (Figure 1; Online Table VII). However, only 11 of them colocalized with CAD or CVD risk factors (including the APOE-APOC1 super cluster on chromosome 19): 2 regions coincided with CAD, 6 with ≥1 lipid trait and 4 with T2DM (2 with T2DM only [including TCF7L2 locus] and 2 with HDL-C/triglycerides as well). It should be noted that the total sample size for BMI/obesity meta-analyses is about an order of magnitude greater than sample sizes in CAD and other CVD risk factor GWAS reports. Therefore, BMI/obesity analyses are powered to detect small effect sizes that are most probably missed (if they exist) by the analyses in other traits.
An example of this approach is shown in the heatmap displayed in Figure 1 using genes associated with CAD or BMI as the primary traits (results for other traits are provided as Online Figure I). Although the majority of genes only show associations with CAD, a subset of genes (APOB, APOE-APOC1, LPL TRIB1, and ZNF259-APOA5-APOA1 cluster) is also associated specifically with lipid-related traits, such as TC, HDL-C, LDL-C, and triglycerides. A separate subset of genes (IL6R, SH2B3, FURIN-FES, and GUCY1A3) was found to be variably associated with other traits, including hypertension, CRP levels, and BMI. In most instances, the association of a gene was inferred based on its mapping to a single GWAS SNP. Exceptions included the SLC22A3-LPAL2-LPA, ApoE-ApoC1, CDKN2-BAS1, COL4A1-COL4A2, and LIPA loci that each mapped to 2 genome-wide significant SNPs.
Pathway Analysis of Pleiotropic Genes
We used the Ingenuity Pathway Analysis (IPA) tool to investigate pathway enrichment among the 56 genes associated with the 87 pleiotropic regions. To identify the possible molecular mechanisms that might be enriched among a subset of the pleiotropic genes, we examined overlap of the pleiotropic gene list with gene sets representing canonical pathways and toxicity signatures in IPA (Figure 2). For each of these categories, the statistical significance of the overlap between the genes in these categories with the list of pleiotropic genes was determined via the Fisher exact test and corrected for multiple testing by the Benjamini–Hochberg procedure.70 Among the canonical pathways, we observed a highly significant enrichment for liver X receptor (LXR)/retinoid X receptor (RXR) and farnesoid X receptor/RXR nuclear receptor signaling among the pleiotropic genes, suggesting that these pathways might have a broad effect on several cardiometabolic traits (false discovery rate=3.16×10⁻¹⁵ and 1.58×10⁻¹³ for LXR and farnesoid X receptor signaling, respectively). We next compared the distribution of pleiotropy among the members of the LXR/RXR signaling (Figure 2A). All the 13 genes were associated with ≥1 of the lipid traits and 8 genes were associated with CAD, whereas only 2 genes were associated with BMI. A similar analysis was performed to determine if genes linked to specific toxicity signatures were over-represented in the list of pleiotropic genes. The analysis identified highly significant enrichment for signatures of CAD and hepatic steatosis as the top 2 enriched signatures (false discovery rate=5.97×10⁻¹⁰ and 2.39×10−09, respectively). Again, all the genes linked to the CAD and hepatic steatosis signatures showed a core pleiotropic association with ≥1 of the 4 lipid traits, whereas 8 genes were further associated with ≥1 additional trait. For example, 7 of the 13 CAD toxicity signature genes were associated with the disease itself, 3 genes with BMI, and 1 gene each for CRP and T2DM (Figure 2B). The full list of canonical pathways and toxicity signature gene sets are available in Online Table VIII.
Figure 2. Enrichment of biological pathways and toxicity gene signatures among pleiotropic genes.

A, Distribution of pleiotropism among the LXR/RXR signaling pathway genes. Column 1 shows the gene names and columns 2 to 10 list the traits. The association of a gene with a trait (as identified in genome-wide association study meta-analysis) is indicated with shading (cell value=1) and a lack of association in white (cell value=0). B, Distribution of pleiotropism among genes in the coronary heart disease toxicity signature. Column descriptions are identical to that in (A).BMI indicates body mass index; BP, blood pressure; CAD, coronary artery disease; CRP, C-reactive protein; HDL-C, high-density lipoprotein cholesterol; LDL-C, low-density lipoprotein cholesterol; T2DM, type 2 diabetes mellitus; TC, total cholesterol; and TG, triglycerides.
Interactome Analysis of Pleiotropic Region Genes
One can ask whether the population of GWAS SNPs retained for this review represents not only a list of genes but potentially also a set of biological networks. Therefore, in addition to the analysis of gene lists representing biological pathways or toxicity signatures, we further interrogated whether a subset of the pleiotropic genes could also be related via functional interactions (such as protein–protein interactions [PPIs], complex formation, enzyme–substrate relationships, etc). The presence of functionally interacting networks involving the pleiotropic genes was examined via the ReactomeFI plugin71 and visualized in the Cytoscape software environment.72 The results of our analysis are shown in Figure 3A. In this network, each gene is color-coded according to the trait(s) it was associated with. Considering genes that interact with ≥1 other gene, 43 of 62 genes (the number of genes increased from 56 to 62 as loci that included >1 gene were expanded) were included in the network, along with an additional 24 linker genes. An inspection of the network revealed that several pleiotropic genes, often associated with different sets of traits, were interconnected, either directly (eg, a complex consisting of HPR and APOA1; HPR being associated with total and LDL-C, and APOA1 additionally associated with CAD, HDL-C, and triglycerides) or indirectly via a linker gene (eg, TCF7L2 and VEGFA genes via the CREBBP linker). Notably, TCF7L2 and VEGFA show pleiotropy over nonoverlapping sets of traits (BMI and T2DM for TCF7L2 and HDL-C and triglycerides for VEGFA, respectively). Interestingly, this predicted interaction between TCF7L2 and VEGFA was recently observed in patients with proliferative diabetic retinopathy, as well as in a mouse model of proliferative diabetic retinopathy.73
Figure 3. Interaction networks underlying pleiotropic genes.
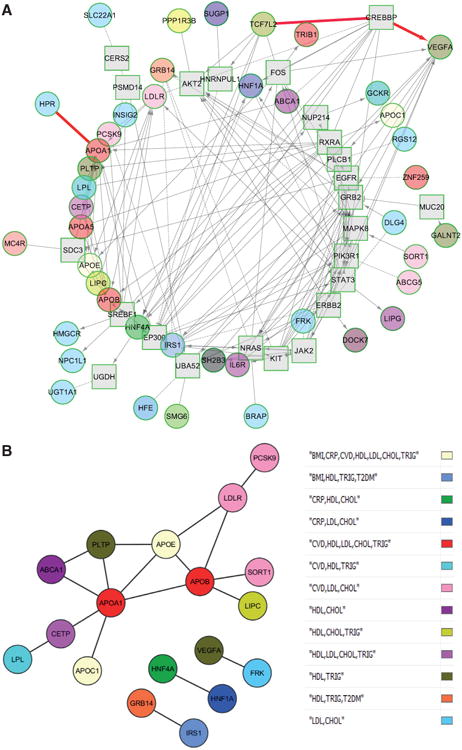
A, Interaction networks underlying pleiotropic genes. The ReactomeFI tool was used to identify interaction networks enriched for the pleiotropic genes. Genes are colored according to their trait-association status, described in the legend. Query genes are shown as circles, whereas linker genes are shown as squares. The edges connecting the genes (lines, dashed lines, and arrows) represent the different types of interactions among the genes. The interactions involving HPR and APOA1 and TCF7L2, CREBBP, and VEGFA are highlighted in red. B, Statistically significant protein–protein interaction (PPI) network of direct interactions. Genes are color-coded according to their pleiotropy. Statistical significance was ascertained by permutation testing of the InWeb PPI network, as described in the text.
An additional analysis was carried out to statistically evaluate the degree to which nonrandom PPI networks could emerge from these candidate pleiotropic genes. This was accomplished via 1000 rounds of within-degree, node-label permutation of the highly curated and high confidence InWeb PPI network (containing 169 810 high-confidence pairwise interactions involving 12 793 human proteins and their orthologs),74 and comparing parameters of network connectivity (node degree and edge number) in subnetworks arising from the pleiotropic genes in the original versus the random networks. Analysis was conducted in the Disease Association Protein–Protein Link Evaluator software environment.75
Both direct interactions among the pleiotropic genes and indirect interactions (via common interactors linking ≥2 pleiotropic genes) were separately considered when examining the networks. This analysis identified a network of 18 genes that showed a statistically significant level of direct connectivity, compared with expectations from chance. Significance was observed both for the number of observed edges (18, compared with an expectation of 2.2 according to the null hypothesis; P<0.0009) and the average degree of directly connected (observed, 2; expected, 0.98; P<0.009) or indirectly connected nodes (observed, 19.4; expected, 11.0; P<0.008). The significant network of direct interactions is shown in Figure 3B, whereas the larger network consisting of both the direct and indirect interactions is shown in Online Figure II.
Compared with the ReactomeFI networks described above, Disease Association Protein–Protein Link Evaluator investigates only one type of interaction (PPI) with a statistical evaluation of the expected randomness of the observed subnetwork. Thus, although ReactomeFI allows one to expand the network space by considering multiple categories of interactions, Disease Association Protein–Protein Link Evaluator conducts a statistically rigorous examination of a particular type of interaction. Therefore, the 2 tools are complementary.
Analysis of Predicted Regulatory Functions
The analyses described to date are based on genes that, in turn, are inferred depending on their proximity to the trait-associated GWAS SNPs. However, one has to remember that the majority of the trait-associated GWAS SNPs are physically located in noncoding regions of the genome. Thus, it is conceivable that the effects of some of the GWAS SNPs are not mediated through genes, but rather via regulatory control over biological functions, mediated through alterations in noncoding, structural elements of the genome. These regulatory effects from noncoding variants could form a significant component of the overall biological effects of the trait-associated SNPs. To explore this possibility, we queried the data generated by the ENCODE (Encyclopedia of DNA Elements) project76,77 for distribution of GWAS SNPs located in pleiotropic regions (and SNPs in strong linkage disequilibrium with these GWAS SNPs) among the various regulatory elements (eg, evolutionarily constrained sequences, enhancers, DNAse hypersensitive open chromatin regions, promoters, and 3′- and 5′-untranslated regions), in addition to possible coding sequence variations resulting in synonymous or nonsynonymous amino acid substitutions. The list of SNPs was first expanded by identifying SNPs in strong linkage disequilibrium with the GWAS SNPs located in pleiotropic regions (r2>0.8, based on 1000 Genomes Phase 1 European population data). This increased the total number of SNPs to 6175. Possible regulatory effects were examined via the HaploReg tool (version 2).78 HaploReg analysis was conducted at 2 levels, such as (1) interrogating SNPs for statistical enrichment of enhancers and DNAse hypersensitivity sites (representing open chromatin; compared with a background set of all SNPs in the 1000G pilot project) and (2) annotating the expanded SNP set for their presence within promoters, enhancers, DNAse, transcription factor binding, expression quantitative trait loci sites or coding regions within genes.
Results of the various analyses on the possible regulatory function of the selected SNPs are shown in Figure 4. Of the 181 GWAS SNPs, 136 SNPs were annotated to ≥1 regulatory feature. The distribution of these 136 SNPs among the different features is presented in Figure 4A. Results for additional SNPs, in linkage disequilibrium with the GWAS SNPs, are shown in Online Table VIII. The majority of GWAS SNPs located in pleiotropic regions were found to be associated with enhancer or DNAse hypersensitive regions. A similar pattern of distribution was also obtained with the expanded SNP set (Online Figure III). We also carried out an enrichment analysis to determine if there was over-representation of enhancers and DNAse hypersensitive regions among the 136 SNPs, when compared against the background of all SNPs identified in the 1000 Genomes pilot project. For this analysis, regulatory data from each cell type available in the ENCODE project was analyzed separately. The results (Figure 4B) show strong statistical evidence for enrichment of enhancer sequences among the SNPs for several, but not all, cell types (eg, H1, HepG2, K562, and NHLF cells; P<2.6×10−05). A similar examination of DNAse hypersensitive sites identified some significant findings, although the level of evidence was weaker (best P<0.007 for progeria syndrome fibroblasts). Because the cell lines investigated in ENCODE may not have a direct relation to cardiovascular physiology, these findings should be interpreted with caution. Nevertheless, the observed enrichment of enhancer and DNAse hypersensitive site sequences in multiple cell types suggest that the pleiotropic SNPs may also exert similar regulatory effects in cells relevant to cardiovascular and metabolic function.
Figure 4. Analysis of potential regulatory functions of single nucleotide polymorphisms (SNPs) located in pleiotropic regions.

A, Pie chart based on all SNPs (genome-wide association study+linkage disequilibrium). Pie chart showing the distribution of different regulatory features among the selected SNPs. The name of each regulatory feature is indicated, followed by the number of SNPs associated with that feature (some SNPs are associated with multiple features). B, Enrichment of enhancers and DNAse hypersensitive sites among pleiotropic SNPs. Analysis for enrichment of enhancers and DNAse hypersensitive sites among SNPs in different cell models used by the ENCODE (Encyclopedia of DNA Elements) project. Column 1, name of cell line; column 2, description of cell line; column 3, observed number of regulatory features; column 4, number expected by chance; column 5, fold-enrichment of observed/expected; column 6, significance of enrichment P value; and column 7, type of regulatory feature.
Interpretation of the Evidence
Several findings can be identified from this review and the pathway and network analysis undertaken on SNPs and genomic regions showing evidence of pleiotropism on ≥2 of the CVD traits considered here. First, there is a strong evidence that there is a significant heritability component to human variation in the risk factors when considered individually. Second, based on genetic epidemiology and statistical modeling studies, there is a moderate evidence that the pairwise covariation and familial clustering of the CVD risk factors is partly because of genetic pleiotropic effects. Third, a total of 87 autosomal regions, identified by 181 SNPs and mapping to 56 gene loci, were found to be pleiotropic. Traits most commonly coaggregating on these regions were CAD and plasma lipids, whereas only a few pleiotropic regions were found for BMI and obesity. Fourth, enrichment for LXR/RXR and farnesoid X receptor/RXR nuclear receptor signaling among the pleiotropic genes was observed with an effect on multiple CVD traits, especially on CAD and lipids. Fifth, an analysis of toxicity signatures revealed that the genes linked to CAD and hepatic steatosis were suggestive of core pleiotropic associations with the CVD traits considered here. Sixth, explorations of potential functional interactions suggested that several pleiotropic loci were associated with different sets of traits either directly (eg, APOA1 associated with CAD, HDL-C, and triglycerides) or indirectly via a linker gene (eg, TCF7L2 and VEGFA genes via the CREBBP linker). Seventh, investigations into PPIs among the pleiotropic genes showed a network of 18 genes exhibiting a statistically significant level of direct connectivity compared with simulated random networks. Eighth, despite the fact that the cell lines investigated in ENCODE may not have direct relevance to cardiovascular physiology, the hypothesis that the GWAS SNPs and SNPs in strong linkage disequilibrium with them exert their effects via regulatory elements of the genome was considered. For several but not all cell types, a majority of GWAS SNPs were found to be in enhancer or DNAse hypersensitive genomic regions.
There is a strong evidence for positive associations between obesity and increased risk of CVD incidence and mortality.79–81 The biological mechanisms driving these observed associations are likely to be complex. At least 3 different models could be proposed to explain the association of excess adiposity with CVD, such as (1) a direct effect of body fat on CVD; (2) an indirect effect mediated via recognized CVD risk factors, such as hypertension, dyslipidemia and T2DM; and (3) an indirect effect mediated by other mechanisms, such as inflammation, endothelial dysfunction, thrombogenic factors, left ventricular hypertrophy, atrial fibrillation, and insulin resistance. Genetic and postgenetic mechanisms may operate through one or more of these 3 routes to link obesity to CVD. This seems to be the more probable scenario because several studies have shown that the detrimental effects of excess body weight cannot be fully accounted for by the established CVD risk factors alone.79,81–83 On the basis of our analysis of common SNPs from the GWAS reports, we do not see strong evidence for pleiotropism among the genetic regions associated with BMI and CAD. Among the established CVD risk factors (and CRP, a marker of inflammation), the level of overlap with BMI-associated genetic loci is also low, perhaps with the exception of HDL-C (6 candidate genes overlap). Thus, it is possible that the genetic basis for the association between excess adiposity and CAD operates through other paths and risk factors or the association may be accounted for by primarily postgenetic mechanisms.
There has been 1 previous attempt to uncover genetic pleiotropism among 5 CVD risk factors and CAD.84 It was based on a search for overlapping genetic variants independently associated with obesity, diabetes mellitus, hyperlipidemia, hypertension, kidney disease, and CAD in the National Human Genome Research Institute GWAS catalog. A set of 107 eligible GWAS (by June 2011) were interrogated and 44 positional genes shared by ≥2 of the 6 traits were found but only in studies of non-European populations. Seven genes provided evidence for pleiotropy with ≥3 traits, primarily lipid phenotypes. Fourteen positional genes were shared between CAD and lipids, whereas 9 were shared between diabetes mellitus and obesity traits. The most significant candidate for pleiotropic effects was KLHL29 for which the GWAS signals associated with blood pressure, lipids, kidney disease, and CAD. Other genes with strong evidence of connectivity among some of the CVD traits included PCSK9, LDLR, LPL, APOB, APOC1, PDGFD, and VEGFA. This analysis included 17 of the 44 loci identified in the study by Gottesman et al84 and found that 12 showed evidence of pleiotropy: APOB, APOC1, CDKN2BAS, FTO, GCKR, IRS1, LDLR, LPL, PCSK9, SH2B3, TRIB1, and ZNF259.
In a recent report, Holmes et al85 describe the findings from a Mendelian randomization study of a genetic score comprised 14 BMI–associated SNPs and its relations to glycemic, inflammation, lipid, and blood pressure traits, as well as subclinical atherosclerosis.85 The BMI genetic score was strongly associated with CVD-related traits, such as glycemic, inflammation, lipid, and blood pressure phenotypes, as well as hs-CRP and fibrinogen. However, although the BMI genetic score was related to the risk of T2DM, it was not associated with coronary heart disease, stroke, or carotid intima media thickness. Furthermore, a causal effect of the BMI genetic score on coronary heart disease events could not be substantiated by the authors in a meta-analysis based on 27 465 coronary heart disease events.
Li et al.86 recently examined the pleiotropic effects of the 95 lipid GWAS loci individually and collectively (ie, genetic risk score) with fasting plasma glucose, glycated hemoglobin (HbA1c), and homeostasis model assessment-estimated insulin resistance in 2 large cohorts. Interestingly, the authors found an opposite genetic effect between dyslipidemia and glucose-related traits in a cohort-specific manner, as higher triglycerides, TC, and LDL-C genetic risk scores and lower HDL-C genetic risk scores were weakly (r=−0.07 to 0.11), but significantly correlated with lower glucose-related trait levels after adjusting for blood lipid levels.86 Individually, 15 lipid loci showed a pleiotropic association with glucose traits, with 8 having opposite allelic directions of effect on dyslipidemia and glucose-related trait levels.86 These results suggest that there is a significant pleiotropy between lipid loci and glucose-related traits and this relationship involves a complex genetic regulation and metabolic interplay between lipids and glucose metabolism. The authors conclude that the positive metabolic relationship but opposite genetic effect may partly explain the low power seen in previous studies trying to detect the genetic association of lipid loci with glucose traits.86
It should be noted that some of the GWAS meta-analyses we used to derive the SNPs for our analyses had already explored to some extent potential pleiotropic effects. For example, the latest report by the Global Lipids Genetics Consortium68 tested if the strongest lipid loci are associated with CAD, as well as cardiovascular and metabolic risk factors. The results showed that the lipid SNPs were more likely to be nominally associated (P<0.05) with the additional traits than would be expected by chance alone: the magnitude of observed nominal associations over expected ones ranged from 2.2-fold for fasting glucose to 5.1-fold for CAD.
However, the interpretation of these results from the pleiotropic perspective is still uncertain. For example, it is not known if the association between the FTO locus and HDL-C is simply reflecting the strong association between FTO and BMI, or if it is independent of BMI. This question was recently addressed in a smaller study that investigated pleiotropism between GWAS-derived obesity and body fat distribution SNPs and cardiovascular and metabolic traits.87 Even though the study was based on ≈33 000 subjects (versus 185 000 in the GWAS report), the FTO locus was not significantly associated with HDL-C whether BMI was included as a covariate. However, the direction of the FTO-HDL association reversed from negative (β=−0.01; P=0.22 in the unadjusted model) to positive (β=0.01; P=0.23) after adjusting for BMI.87
These examples illustrate the challenges posed by quantitative studies aimed at testing hypotheses on pleiotropic loci. There is a need for standardized analytic strategies to approach these questions in a uniform and comprehensive manner so that the findings can be made comparable across studies and populations. One of the major questions to be addressed by such new analytic tools would be to provide protection against confounders mimicking pleiotropic effects. Moreover, novel analytic strategies should perhaps take advantage of emerging GWA-based data on gene–gene and gene–environment interaction effects that are rapidly becoming available to augment the search for pleiotropic CVD loci.
The review and related in silico studies presented herein need to be evaluated in light of the following limitations. Even though the recent GWAS meta-analyses that were used for each trait are large by today's standard, some of the reports are based on substantially larger sample sizes than others. This has undoubtedly influenced the number of SNPs and genes that constitute the foundation of the pathway and network analyses reported here. When much larger sample sizes will be available for all CVD traits GWAS, it is evident that the number of significantly associated SNPs will grow substantially and probably the number of pleiotropic regions. Furthermore, ongoing and future whole-genome and exome sequencing studies will unravel the finer structure of genetic associations and identify additional common and rare variants affecting CVD traits. One important issue is that we were not able to include the whole universe of biological and behavioral risk factors for CVD. When a more global and fully integrated pathway and network analysis is performed based on all known risk factors and fully powered genomic screens, it is likely to generate even more informative panels of pleiotropic SNPs and chromosomal regions and functional evidence on genetic pleiotropism.
Finally, one of the incentives for examining pleiotropy is to identify common mechanisms underlying related disorders that may be therapeutically targeted for the amelioration of these disorders. It is conceptually possible that, by developing a treatment directed at pleiotropic genes or pathways, one can gain therapeutic benefits against multiple disorders through a single drug rather than a cocktail of medicines. This could reduce complications often associated with polypharmacy, such as patient compliance with multiple drug regimens, drug–drug interactions (eg, the interaction between cholesterol-lowering statins and triglyceride-lowering fibrates) and the additive side effects associated with multiple drugs. Thus, identification of the biological pathways and reaction networks enriched for the pleiotropic genes could further expand our repertoire of possible drug targets. Even if it is not possible to pharmacologically target a pleiotropic gene, or proves to be refractory because of side effects, other genes in the same pathway may be exploited for therapeutic benefit. For example, our analysis identified the LXR signaling pathway as highly enriched for pleiotropic genes. Indeed LXR, a sterol-sensitive transcription factor and regulator of cholesterol homeostasis, is already an attractive drug target for the treatment of lipid disorders88 and tissue and subtype-selective LXR agonists are promising strategies for developing targeted modulators of lipid metabolism. However, undesirable hepatic side effects have proven to be a major challenge in these efforts. In this context, other target genes in the LXR signaling pathway could provide additional opportunities and offer alternative solutions to the treatment of lipid disorders The fact that we found little evidence of pleiotropic SNPs and genes on obesity and other CVD risk factors emphasizes that weight loss and weight management remain important clinical tools in the prevention and treatment of cardiometabolic diseases.
Conclusions
A clustering of CVD risk factors is commonly observed in epidemiological studies and clinical settings. Whether the clustering results from pleiotropic effects of specific genes remains to be fully understood. Genetic epidemiology studies have provided proof-of-concept evidence for the notion that there are genes and DNA sequence variants exerting pleiotropic influences on multiple CVD risk factors. Using recent meta-analyses of GWAS reports, we have identified autosomal regions and panels of SNPs with positional evidence of involvement in covariation among CVD traits, especially CAD and plasma lipids. We have selected for further bioinformatics studies loci nearest lead SNPs showing significant associations with ≥2 of the following: CAD, BMI, CRP, blood pressure, lipids, and T2DM. A subtotal of 87 autosomal regions identified by 181 SNPs, mapping to 56 genes, were found to be pleiotropic. Pathways, networks, interactomes and genomic coding sequences and regulatory elements were explored in silico using bioinformatics technologies. There was relatively strong evidence for interacting genes, pathways, and networks suggesting a biological basis for genetic pleiotropism in the clustering of CVD traits, especially CAD and plasma lipids, whereas evidence for pleiotropic effects involving obesity was much less convincing. Pleiotropic SNPs were over-represented in enhancer sequences and DNAse hypersensitive regions as identified from the ENCODE resources. Of the 181 pleiotropic SNPs, 136 were annotated to ≥1 DNA regulatory element. We conclude from our review and bioinformatics explorations that there is a reasonable evidence for the presence of genomic sequence variants and positional genes exerting pleiotropic effects on CVD risk factors. We suggest that larger studies with more comprehensive trait panels are needed at this time to provide the necessary resources to be able to investigate in depth the CVD risk factor clustering in terms of DNA variants, genes, pathways, and actionable targets. Such studies could perhaps take advantage of the fact that GWA-based data on gene–gene and gene–environment interaction effects are becoming available to augment the search for pleiotropic CVD loci.
Supplementary Material
Acknowledgments
Sources of Funding: This work was supported by National Center on Minority Health and Health Disparities grant P20MD000175-09, National Institute of Diabetes and Digestive and Kidney Diseases grant 1R21DK088319-01, American Heart Association grant AHA10SDG4230068, and Duke-NUS grant WBS R-913-200-076-263 to Dr Ghosh, Centers of Biomedical Research Excellence (National Institutes of Health-8 P20 GM103528) grant to Dr Sarzynski, Louisiana Clinical and Translational Science Center (1 U54 GM104940 from the National Institute of General Medical Sciences) grant to Dr Sarzynski, and National Heart, Lung, and Blood Institute grant HL045670 to Drs Rankinen and Bouchard. Dr Bouchard is supported in part by the John W. Barton, Sr. Chair in Genetics and Nutrition.
Nonstandard Abbreviations and Acronyms
- BMI
body mass index
- CAD
coronary artery disease
- CVD
cardiovascular disease
- GWAS
genome-wide association study
- HDL-C
high-density lipoprotein cholesterol
- hs-CRP
high-sensitivity C-reactive protein
- LDL-C
low-density lipoprotein cholesterol
- LXR
liver X receptor
- PPI
protein–protein interaction
- RXR
retinoid X receptor
- SNP
single nucleotide polymorphism
- T2DM
type 2 diabetes mellitus
Footnotes
The online-only Data Supplement is available with this article at http://circres.ahajournals.org/lookup/suppl/doi:10.1161/CIRCRESAHA.116.302888/-/DC1.
Disclosures: Dr Bouchard is an advisor to Pathway Genomics, San Diego, CA. The other authors report no conflicts.
References
- 1.Lozano R, Naghavi M, Foreman K, et al. Global and regional mortality from 235 causes of death for 20 age groups in 1990 and 2010: a systematic analysis for the Global Burden of Disease Study 2010. Lancet. 2012;380:2095–2128. doi: 10.1016/S0140-6736(12)61728-0. [DOI] [PMC free article] [PubMed] [Google Scholar]
- 2.Ajani UA, Ford ES, Mokdad AH. Prevalence of high C-reactive protein in persons with serum lipid concentrations within recommended values. Clin Chem. 2004;50:1618–1622. doi: 10.1373/clinchem.2004.036004. [DOI] [PubMed] [Google Scholar]
- 3.Physical Activity Guidelines Advisory Committee. Physical Activity Guidelines Advisory Committee Report, 2008. Washington, DC: U.S. Department of Health and Human Services; 2008. [DOI] [PubMed] [Google Scholar]
- 4.Bouchard C, Perusse L. Genetics of causes and manifestations of the metabolic syndrome. In: Crepaldi G, editor. 6th European Symposium on Metabolism: The Plurimetabolic Syndrome. Amsterdam, The Netherlands: Elsevier Science Publishers; 1994. [Google Scholar]
- 5.Nelson TL, Vogler GP, Pedersen NL, Hong Y, Miles TP. Genetic and environmental influences on body fat distribution, fasting insulin levels and CVD: are the influences shared? Twin Res. 2000;3:43–50. doi: 10.1375/136905200320565689. [DOI] [PubMed] [Google Scholar]
- 6.Hong Y, Weisnagel SJ, Rice T, Sun G, Mandel SA, Gu C, Rankinen T, Gagnon J, Leon AS, Skinner JS, Wilmore JH, Bergman RN, Bouchard C, Rao DC HERITAGE Family Study. Familial resemblance for glucose and insulin metabolism indices derived from an intravenous glucose tolerance test in Blacks and Whites of the HERITAGE Family Study. Clin Genet. 2001;60:22–30. doi: 10.1034/j.1399-0004.2001.600104.x. [DOI] [PubMed] [Google Scholar]
- 7.Lin HF, Boden-Albala B, Juo SH, Park N, Rundek T, Sacco RL. Heritabilities of the metabolic syndrome and its components in the Northern Manhattan Family Study. Diabetologia. 2005;48:2006–2012. doi: 10.1007/s00125-005-1892-2. [DOI] [PMC free article] [PubMed] [Google Scholar]
- 8.Berrahmoune H, Herbeth B, Siest G, Visvikis-Siest S. Heritability of serum hs-CRP concentration and 5-year changes in the Stanislas family study: association with apolipoprotein E alleles. Genes Immun. 2007;8:352–359. doi: 10.1038/sj.gene.6364395. [DOI] [PubMed] [Google Scholar]
- 9.Fox ER, Benjamin EJ, Sarpong DF, Rotimi CN, Wilson JG, Steffes MW, Chen G, Adeyemo A, Taylor JK, Samdarshi TE, Taylor HA., Jr Epidemiology, heritability, and genetic linkage of C-reactive protein in African Americans (from the Jackson Heart Study) Am J Cardiol. 2008;102:835–841. doi: 10.1016/j.amjcard.2008.05.049. [DOI] [PMC free article] [PubMed] [Google Scholar]
- 10.Austin MA, Zhang C, Humphries SE, Chandler WL, Talmud PJ, Edwards KL, Leonetti DL, McNeely MJ, Fujimoto WY. Heritability of C-reactive protein and association with apolipoprotein E genotypes in Japanese Americans. Ann Hum Genet. 2004;68:179–188. doi: 10.1046/j.1529-8817.2004.00078.x. [DOI] [PubMed] [Google Scholar]
- 11.Lange LA, Burdon K, Langefeld CD, Liu Y, Beck SR, Rich SS, Freedman BI, Brosnihan KB, Herrington DM, Wagenknecht LE, Bowden DW. Heritability and expression of C-reactive protein in type 2 diabetes in the Diabetes Heart Study. Ann Hum Genet. 2006;70:717–725. doi: 10.1111/j.1469-1809.2006.00280.x. [DOI] [PubMed] [Google Scholar]
- 12.Wessel J, Moratorio G, Rao F, et al. C-reactive protein, an ‘intermediate phenotype’ for inflammation: human twin studies reveal heritability, association with blood pressure and the metabolic syndrome, and the influence of common polymorphism at catecholaminergic/beta-adrenergic pathway loci. J Hypertens. 2007;25:329–343. doi: 10.1097/HJH.0b013e328011753e. [DOI] [PubMed] [Google Scholar]
- 13.Kraja AT, Rao DC, Weder AB, Cooper R, Curb JD, Hanis CL, Turner ST, de Andrade M, Hsiung CA, Quertermous T, Zhu X, Province MA. Two major QTLs and several others relate to factors of metabolic syndrome in the family blood pressure program. Hypertension. 2005;46:751–757. doi: 10.1161/01.HYP.0000184249.20016.bb. [DOI] [PubMed] [Google Scholar]
- 14.Luo BF, Du L, Li JX, Pan BY, Xu JM, Chen J, Yin XY, Ren Y, Zhang F. Heritability of metabolic syndrome traits among healthy younger adults: a population based study in China. J Med Genet. 2010;47:415–420. doi: 10.1136/jmg.2009.068932. [DOI] [PubMed] [Google Scholar]
- 15.Namboodiri KK, Kaplan EB, Heuch I, Elston RC, Green PP, Rao DC, Laskarzewski P, Glueck CJ, Rifkind BM. The Collaborative Lipid Research Clinics Family Study: biological and cultural determinants of familial resemblance for plasma lipids and lipoproteins. Genet Epidemiol. 1985;2:227–254. doi: 10.1002/gepi.1370020302. [DOI] [PubMed] [Google Scholar]
- 16.Weiss LA, Pan L, Abney M, Ober C. The sex-specific genetic architecture of quantitative traits in humans. Nat Genet. 2006;38:218–222. doi: 10.1038/ng1726. [DOI] [PubMed] [Google Scholar]
- 17.Argyropoulos G, Smith S, Bouchard C. Genetics of the metabolic syndrome. In: Kumar S, O'Rahilly S, editors. Insulin Resistance: Insulin Action and its Disturbances in Disease. West Sussex, England: John Wiley & Sons; 2005. pp. 401–450. [Google Scholar]
- 18.Forsblom CM, Kanninen T, Lehtovirta M, Saloranta C, Groop LC. Heritability of albumin excretion rate in families of patients with Type II diabetes. Diabetologia. 1999;42:1359–1366. doi: 10.1007/s001250051450. [DOI] [PubMed] [Google Scholar]
- 19.Dupuis J, Larson MG, Vasan RS, Massaro JM, Wilson PW, Lipinska I, Corey D, Vita JA, Keaney JF, Jr, Benjamin EJ. Genome scan of systemic biomarkers of vascular inflammation in the Framingham Heart Study: evidence for susceptibility loci on 1q. Atherosclerosis. 2005;182:307–314. doi: 10.1016/j.atherosclerosis.2005.02.015. [DOI] [PubMed] [Google Scholar]
- 20.Pankow JS, Folsom AR, Cushman M, Borecki IB, Hopkins PN, Eckfeldt JH, Tracy RP. Familial and genetic determinants of systemic markers of inflammation: the NHLBI family heart study. Atherosclerosis. 2001;154:681–689. doi: 10.1016/s0021-9150(00)00586-4. [DOI] [PubMed] [Google Scholar]
- 21.Retterstol L, Eikvar L, Berg K. A twin study of C-Reactive Protein compared to other risk factors for coronary heart disease. Atherosclerosis. 2003;169:279–282. doi: 10.1016/s0021-9150(03)00192-8. [DOI] [PubMed] [Google Scholar]
- 22.Warren DM, Soria JM, Souto JC, Comuzzie A, Fontcuberta J, Blangero J, MacCluer JW, Almasy L. Heritability of hemostasis phenotypes and their correlation with type 2 diabetes status in Mexican Americans. Hum Biol. 2005;77:1–15. doi: 10.1353/hub.2005.0034. [DOI] [PubMed] [Google Scholar]
- 23.Ring HZ, Lessov CN, Reed T, Marcus R, Holloway L, Swan GE, Carmelli D. Heritability of plasma sex hormones and hormone binding globulin in adult male twins. J Clin Endocrinol Metab. 2005;90:3653–3658. doi: 10.1210/jc.2004-1025. [DOI] [PubMed] [Google Scholar]
- 24.Perusse L, Rice TK, Bouchard C. Genetic component to obesity: evidence from genetic epidemiology. In: Bray GA, Bouchard C, editors. Handbook of Obesity: Epidemiology, Etiology, and Physiopathology. Boca Raton, FL: CRC Press; 2014. pp. 91–104. [Google Scholar]
- 25.Bouchard C. Genetics and the metabolic syndrome. Int J Obes Relat Metab Disord. 1995;19(suppl 1):S52–S59. [PubMed] [Google Scholar]
- 26.Wardle J, Carnell S, Haworth CM, Plomin R. Evidence for a strong genetic influence on childhood adiposity despite the force of the obesogenic environment. Am J Clin Nutr. 2008;87:398–404. doi: 10.1093/ajcn/87.2.398. [DOI] [PubMed] [Google Scholar]
- 27.Katzmarzyk PT, Malina RM, Pérusse L, Rice T, Province MA, Rao DC, Bouchard C. Familial resemblance in fatness and fat distribution. Am J Hum Biol. 2000;12:395–404. doi: 10.1002/(SICI)1520-6300(200005/06)12:3<395∷AID-AJHB10>3.0.CO;2-J. [DOI] [PubMed] [Google Scholar]
- 28.Pérusse L, Després JP, Lemieux S, Rice T, Rao DC, Bouchard C. Familial aggregation of abdominal visceral fat level: results from the Quebec family study. Metabolism. 1996;45:378–382. doi: 10.1016/s0026-0495(96)90294-2. [DOI] [PubMed] [Google Scholar]
- 29.Rice T, Després JP, Pérusse L, Gagnon J, Leon AS, Skinner JS, Wilmore JH, Rao DC, Bouchard C. Segregation analysis of abdominal visceral fat: the HERITAGE Family Study. Obes Res. 1997;5:417–424. doi: 10.1002/j.1550-8528.1997.tb00664.x. [DOI] [PubMed] [Google Scholar]
- 30.Burke GL, Savage PJ, Sprafka JM, Selby JV, Jacobs DR, Jr, Perkins LL, Roseman JM, Hughes GH, Fabsitz RR. Relation of risk factor levels in young adulthood to parental history of disease. The CARDIA study. Circulation. 1991;84:1176–1187. doi: 10.1161/01.cir.84.3.1176. [DOI] [PubMed] [Google Scholar]
- 31.Manson JE, Colditz GA, Stampfer MJ, Willett WC, Krolewski AS, Rosner B, Arky RA, Speizer FE, Hennekens CH. A prospective study of maturity-onset diabetes mellitus and risk of coronary heart disease and stroke in women. Arch Intern Med. 1991;151:1141–1147. [PubMed] [Google Scholar]
- 32.Sarlund H, Pyörälä K, Penttilä I, Laakso M. Early abnormalities in coronary heart disease risk factors in relatives of subjects with non-insulin-dependent diabetes. Arterioscler Thromb. 1992;12:657–663. doi: 10.1161/01.atv.12.6.657. [DOI] [PubMed] [Google Scholar]
- 33.Watanabe RM, Valle T, Hauser ER, Ghosh S, Eriksson J, Kohtamäki K, Ehnholm C, Tuomilehto J, Collins FS, Bergman RN, Boehnke M. Familiality of quantitative metabolic traits in Finnish families with non-insulin-dependent diabetes mellitus. Finland-United States Investigation of NIDDM Genetics (FUSION) Study investigators. Hum Hered. 1999;49:159–168. doi: 10.1159/000022865. [DOI] [PubMed] [Google Scholar]
- 34.Li JK, Ng MC, So WY, Chiu CK, Ozaki R, Tong PC, Cockram CS, Chan JC. Phenotypic and genetic clustering of diabetes and metabolic syndrome in Chinese families with type 2 diabetes mellitus. Diabetes Metab Res Rev. 2006;22:46–52. doi: 10.1002/dmrr.577. [DOI] [PubMed] [Google Scholar]
- 35.Santos RL, Zillikens MC, Rivadeneira FR, Pols HA, Oostra BA, van Duijn CM, Aulchenko YS. Heritability of fasting glucose levels in a young genetically isolated population. Diabetologia. 2006;49:667–672. doi: 10.1007/s00125-006-0142-6. [DOI] [PubMed] [Google Scholar]
- 36.Pérusse L, Rice T, Després JP, Bergeron J, Province MA, Gagnon J, Leon AS, Rao DC, Skinner JS, Wilmore JH, Bouchard C. Familial resemblance of plasma lipids, lipoproteins and postheparin lipoprotein and hepatic lipases in the HERITAGE Family Study. Arterioscler Thromb Vasc Biol. 1997;17:3263–3269. doi: 10.1161/01.atv.17.11.3263. [DOI] [PubMed] [Google Scholar]
- 37.Wu KD, Hsiao CF, Ho LT, Sheu WH, Pei D, Chuang LM, Curb D, Chen YD, Tsai HJ, Dzau VJ, Cox D, Tai TY. Clustering and heritability of insulin resistance in Chinese and Japanese hypertensive families: a Stanford-Asian Pacific Program in Hypertension and Insulin Resistance sibling study. Hypertens Res. 2002;25:529–536. doi: 10.1291/hypres.25.529. [DOI] [PubMed] [Google Scholar]
- 38.Carmelli D, Cardon LR, Fabsitz R. Clustering of hypertension, diabetes, and obesity in adult male twins: same genes or same environments? Am J Hum Genet. 1994;55:566–573. [PMC free article] [PubMed] [Google Scholar]
- 39.Selby JV, Newman B, Quiroga J, Christian JC, Austin MA, Fabsitz RR. Concordance for dyslipidemic hypertension in male twins. JAMA. 1991;265:2079–2084. [PubMed] [Google Scholar]
- 40.Mitchell BD, Kammerer CM, Mahaney MC, Blangero J, Comuzzie AG, Atwood LD, Haffner SM, Stern MP, MacCluer JW. Genetic analysis of the IRS. Pleiotropic effects of genes influencing insulin levels on lipoprotein and obesity measures. Arterioscler Thromb Vasc Biol. 1996;16:281–288. doi: 10.1161/01.atv.16.2.281. [DOI] [PubMed] [Google Scholar]
- 41.Hong Y, Pedersen NL, Brismar K, de Faire U. Genetic and environmental architecture of the features of the insulin-resistance syndrome. Am J Hum Genet. 1997;60:143–152. [PMC free article] [PubMed] [Google Scholar]
- 42.Liese AD, Mayer-Davis EJ, Tyroler HA, Davis CE, Keil U, Schmidt MI, Brancati FL, Heiss G. Familial components of the multiple metabolic syndrome: the ARIC study. Diabetologia. 1997;40:963–970. doi: 10.1007/s001250050775. Erratum in: Diabetologia 1998; 41:608. [DOI] [PubMed] [Google Scholar]
- 43.Schumacher MC, Maxwell TM, Wu LL, Hunt SC, Williams RR, Elbein SC. Dyslipidemias among normoglycemic members of familial NIDDM pedigrees. Diabetes Care. 1992;15:1285–1289. doi: 10.2337/diacare.15.10.1285. [DOI] [PubMed] [Google Scholar]
- 44.Laws A, Stefanick ML, Reaven GM. Insulin resistance and hypertriglyceridemia in nondiabetic relatives of patients with noninsulin-dependent diabetes mellitus. J Clin Endocrinol Metab. 1989;69:343–347. doi: 10.1210/jcem-69-2-343. [DOI] [PubMed] [Google Scholar]
- 45.Selby JV, Austin MA, Newman B, Zhang D, Quesenberry CP, Jr, Mayer EJ, Krauss RM. LDL subclass phenotypes and the insulin resistance syndrome in women. Circulation. 1993;88:381–387. doi: 10.1161/01.cir.88.2.381. [DOI] [PubMed] [Google Scholar]
- 46.Haffner SM, Stern MP, Hazuda HP, Mitchell BD, Patterson JK, Ferrannini E. Parental history of diabetes is associated with increased cardiovascular risk factors. Arteriosclerosis. 1989;9:928–933. doi: 10.1161/01.atv.9.6.928. [DOI] [PubMed] [Google Scholar]
- 47.Williams RR, Hunt SC, Hasstedt SJ, Hopkins PN, Wu LL, Berry TD, Stults BM, Barlow GK, Schumacher MC, Lifton RP. Are there interactions and relations between genetic and environmental factors predisposing to high blood pressure? Hypertension. 1991;18:I29–I37. doi: 10.1161/01.hyp.18.3_suppl.i29. [DOI] [PubMed] [Google Scholar]; 47a Stamler J, Vaccaro O, Neaton JD, Wentworth D. Diabetes, other risk factors, and 12-yr cardiovascular mortality for men screened in the Multiple Risk Factor Intervention Trial. Diabetes Care. 1993;16:434–444. doi: 10.2337/diacare.16.2.434. [DOI] [PubMed] [Google Scholar]
- 48.Rice T, Province M, Pérusse L, Bouchard C, Rao DC. Cross-trait familial resemblance for body fat and blood pressure: familial correlations in the Québec Family Study. Am J Hum Genet. 1994;55:1019–1029. [PMC free article] [PubMed] [Google Scholar]
- 49.Rice T, Nadeau A, Pérusse L, Bouchard C, Rao DC. Familial correlations in the Québec family study: cross-trait familial resemblance for body fat with plasma glucose and insulin. Diabetologia. 1996;39:1357–1364. doi: 10.1007/s001250050583. [DOI] [PubMed] [Google Scholar]
- 50.Pérusse L, Rice T, Després JP, Rao DC, Bouchard C. Cross-trait familial resemblance for body fat and blood lipids: familial correlations in the Quebec Family Study. Arterioscler Thromb Vasc Biol. 1997;17:3270–3277. doi: 10.1161/01.atv.17.11.3270. [DOI] [PubMed] [Google Scholar]
- 51.Hong Y, Rice T, Gagnon J, Després JP, Nadeau A, Pérusse L, Bouchard C, Leon AS, Skinner JS, Wilmore JH, Rao DC. Familial clustering of insulin and abdominal visceral fat: the HERITAGE Family Study. J Clin Endocrinol Metab. 1998;83:4239–4245. doi: 10.1210/jcem.83.12.5312. [DOI] [PubMed] [Google Scholar]
- 52.An P, Rice T, Gagnon J, Leon AS, Skinner JS, Wilmore JH, Bouchard C, Rao DC. Cross-trait familial resemblance for resting blood pressure and body composition and fat distribution: the HERITAGE family study. Am J Hum Biol. 2000;12:32–41. doi: 10.1002/(SICI)1520-6300(200001/02)12:1<32∷AID-AJHB5>3.0.CO;2-6. [DOI] [PubMed] [Google Scholar]
- 53.Loos RJ, Katzmarzyk PT, Rao DC, Rice T, Leon AS, Skinner JS, Wilmore JH, Rankinen T, Bouchard C HERITAGE Family Study. Genome-wide linkage scan for the metabolic syndrome in the HERITAGE Family Study. J Clin Endocrinol Metab. 2003;88:5935–5943. doi: 10.1210/jc.2003-030553. [DOI] [PubMed] [Google Scholar]
- 54.Chen W, Srinivasan SR, Elkasabany A, Berenson GS. Cardiovascular risk factors clustering features of insulin resistance syndrome (Syndrome X) in a biracial (Black-White) population of children, adolescents, and young adults: the Bogalusa Heart Study. Am J Epidemiol. 1999;150:667–674. doi: 10.1093/oxfordjournals.aje.a010069. [DOI] [PubMed] [Google Scholar]
- 55.Arya R, Blangero J, Williams K, Almasy L, Dyer TD, Leach RJ, O'Connell P, Stern MP, Duggirala R. Factors of insulin resistance syndrome–related phenotypes are linked to genetic locations on chromosomes 6 and 7 in nondiabetic Mexican-Americans. Diabetes. 2002;51:841–847. doi: 10.2337/diabetes.51.3.841. [DOI] [PubMed] [Google Scholar]
- 56.Edwards KL, Talmud PJ, Newman B, Krauss RM, Austin MA. Lipoprotein candidate genes for multivariate factors of the insulin resistance syndrome: a sib-pair linkage analysis in women twins. Twin Res. 2001;4:41–47. doi: 10.1375/1369052012137. [DOI] [PubMed] [Google Scholar]
- 57.Meigs JB, D'Agostino RB, Sr, Wilson PW, Cupples LA, Nathan DM, Singer DE. Risk variable clustering in the insulin resistance syndrome. The Framingham Offspring Study. Diabetes. 1997;46:1594–1600. doi: 10.2337/diacare.46.10.1594. [DOI] [PubMed] [Google Scholar]
- 58.Austin MA, Edwards KL, McNeely MJ, Chandler WL, Leonetti DL, Talmud PJ, Humphries SE, Fujimoto WY. Heritability of multivariate factors of the metabolic syndrome in nondiabetic Japanese Americans. Diabetes. 2004;53:1166–1169. doi: 10.2337/diabetes.53.4.1166. [DOI] [PubMed] [Google Scholar]
- 59.Hanson RL, Imperatore G, Bennett PH, Knowler WC. Components of the “metabolic syndrome” and incidence of type 2 diabetes. Diabetes. 2002;51:3120–3127. doi: 10.2337/diabetes.51.10.3120. [DOI] [PubMed] [Google Scholar]
- 60.Lakka HM, Laaksonen DE, Lakka TA, Niskanen LK, Kumpusalo E, Tuomilehto J, Salonen JT. The metabolic syndrome and total and cardiovascular disease mortality in middle-aged men. JAMA. 2002;288:2709–2716. doi: 10.1001/jama.288.21.2709. [DOI] [PubMed] [Google Scholar]
- 61.Ninomiya JK, L'Italien G, Criqui MH, Whyte JL, Gamst A, Chen RS. Association of the metabolic syndrome with history of myocardial infarction and stroke in the Third National Health and Nutrition Examination Survey. Circulation. 2004;109:42–46. doi: 10.1161/01.CIR.0000108926.04022.0C. [DOI] [PubMed] [Google Scholar]
- 62.Pladevall M, Singal B, Williams LK, Brotons C, Guyer H, Sadurni J, Falces C, Serrano-Rios M, Gabriel R, Shaw JE, Zimmet PZ, Haffner S. A single factor underlies the metabolic syndrome: a confirmatory factor analysis. Diabetes Care. 2006;29:113–122. doi: 10.2337/diacare.29.1.113. [DOI] [PubMed] [Google Scholar]
- 63.Shen BJ, Todaro JF, Niaura R, McCaffery JM, Zhang J, Spiro A, III, Ward KD. Are metabolic risk factors one unified syndrome? Modeling the structure of the metabolic syndrome X. Am J Epidemiol. 2003;157:701–711. doi: 10.1093/aje/kwg045. [DOI] [PubMed] [Google Scholar]
- 64.Locke AE, Kahali B, Berndt SI, et al. Genetic studies of body mass index yield new insights for obesity biology. Nature. 2015;518:197–206. doi: 10.1038/nature14177. [DOI] [PMC free article] [PubMed] [Google Scholar]
- 65.Deloukas P, Kanoni S, Willenborg C, et al. Large-scale association analysis identifies new risk loci for coronary artery disease. Nat Genet. 2013;45:25–33. doi: 10.1038/ng.2480. [DOI] [PMC free article] [PubMed] [Google Scholar]
- 66.Dehghan A, Dupuis J, Barbalic M, et al. Meta-analysis of genome-wide association studies in >80 000 subjects identifies multiple loci for C-reactive protein levels. Circulation. 2011;123:731–738. doi: 10.1161/CIRCULATIONAHA.110.948570. [DOI] [PMC free article] [PubMed] [Google Scholar]
- 67.Ehret GB, Munroe PB, Rice KM, et al. Genetic variants in novel pathways influence blood pressure and cardiovascular disease risk. Nature. 2011;478:103–109. doi: 10.1038/nature10405. [DOI] [PMC free article] [PubMed] [Google Scholar]
- 68.Willer CJ, Schmidt EM, Sengupta S, et al. Discovery and refinement of loci associated with lipid levels. Nat Genet. 2013;45:1274–1283. doi: 10.1038/ng.2797. [DOI] [PMC free article] [PubMed] [Google Scholar]
- 69.Morris AP, Voight BF, Teslovich TM, et al. Wellcome Trust Case Control Consortium; Meta-Analyses of Glucose and Insulin-related traits Consortium (MAGIC) Investigators; Genetic Investigation of ANthropometric Traits (GIANT) Consortium; Asian Genetic Epidemiology Network–Type 2 Diabetes (AGEN-T2D) Consortium; South Asian Type 2 Diabetes (SAT2D) Consortium; DIAbetes Genetics Replication And Meta-analysis (DIAGRAM) Consortium. Large-scale association analysis provides insights into the genetic architecture and pathophysiology of type 2 diabetes. Nat Genet. 2012;44:981–990. doi: 10.1038/ng.2383. [DOI] [PMC free article] [PubMed] [Google Scholar]
- 70.Benjamini Y, Hochberg Y. Controlling the false discovery rate - a practical and powerful approach to multiple testing. J Roy Stat Soc B Met. 1995;57:289–300. [Google Scholar]
- 71.Croft D, O'Kelly G, Wu G, et al. Reactome: a database of reactions, pathways and biological processes. Nucleic Acids Res. 2011;39:D691–D697. doi: 10.1093/nar/gkq1018. [DOI] [PMC free article] [PubMed] [Google Scholar]
- 72.Shannon P, Markiel A, Ozier O, Baliga NS, Wang JT, Ramage D, Amin N, Schwikowski B, Ideker T. Cytoscape: a software environment for integrated models of biomolecular interaction networks. Genome Res. 2003;13:2498–2504. doi: 10.1101/gr.1239303. [DOI] [PMC free article] [PubMed] [Google Scholar]
- 73.Luo J, Zhao L, Chen AY, et al. TCF7L2 variation and proliferative diabetic retinopathy. Diabetes. 2013;62:2613–2617. doi: 10.2337/db12-1093. [DOI] [PMC free article] [PubMed] [Google Scholar]
- 74.Lage K, Karlberg EO, Størling ZM, Olason PI, Pedersen AG, Rigina O, Hinsby AM, Tümer Z, Pociot F, Tommerup N, Moreau Y, Brunak S. A human phenome-interactome network of protein complexes implicated in genetic disorders. Nat Biotechnol. 2007;25:309–316. doi: 10.1038/nbt1295. [DOI] [PubMed] [Google Scholar]
- 75.Rossin EJ, Lage K, Raychaudhuri S, Xavier RJ, Tatar D, Benita Y, Cotsapas C, Daly MJ International Inflammatory Bowel Disease Genetics Constortium. Proteins encoded in genomic regions associated with immune-mediated disease physically interact and suggest underlying biology. PLoS Genet. 2011;7:e1001273. doi: 10.1371/journal.pgen.1001273. [DOI] [PMC free article] [PubMed] [Google Scholar]
- 76.ENCODE Project Consortium. The ENCODE (ENCyclopedia Of DNA Elements) Project. Science. 2004;306:636–640. doi: 10.1126/science.1105136. [DOI] [PubMed] [Google Scholar]
- 77.Kellis M, Wold B, Snyder MP, et al. Defining functional DNA elements in the human genome. Proc Natl Acad Sci U S A. 2014;111:6131–6138. doi: 10.1073/pnas.1318948111. [DOI] [PMC free article] [PubMed] [Google Scholar]
- 78.Ward LD, Kellis M. HaploReg: a resource for exploring chromatin states, conservation, and regulatory motif alterations within sets of genetically linked variants. Nucleic Acids Res. 2012;40:D930–D934. doi: 10.1093/nar/gkr917. [DOI] [PMC free article] [PubMed] [Google Scholar]
- 79.Bogers RP, Bemelmans WJ, Hoogenveen RT, Boshuizen HC, Woodward M, Knekt P, van Dam RM, Hu FB, Visscher TL, Menotti A, Thorpe RJ, Jr, Jamrozik K, Calling S, Strand BH, Shipley MJ BMI-CHD Collaboration Investigators. Association of overweight with increased risk of coronary heart disease partly independent of blood pressure and cholesterol levels: a meta-analysis of 21 cohort studies including more than 300 000 persons. Arch Intern Med. 2007;167:1720–1728. doi: 10.1001/archinte.167.16.1720. [DOI] [PubMed] [Google Scholar]
- 80.McGee DL Diverse Populations Collaboration. Body mass index and mortality: a meta-analysis based on person-level data from twenty-six observational studies. Ann Epidemiol. 2005;15:87–97. doi: 10.1016/j.annepidem.2004.05.012. [DOI] [PubMed] [Google Scholar]
- 81.Ni Mhurchu C, Rodgers A, Pan WH, Gu DF, Woodward M Asia Pacific Cohort Studies Collaboration. Body mass index and cardiovascular disease in the Asia-Pacific Region: an overview of 33 cohorts involving 310 000 participants. Int J Epidemiol. 2004;33:751–758. doi: 10.1093/ije/dyh163. [DOI] [PubMed] [Google Scholar]
- 82.Mora S, Yanek LR, Moy TF, Fallin MD, Becker LC, Becker DM. Interaction of body mass index and framingham risk score in predicting incident coronary disease in families. Circulation. 2005;111:1871–1876. doi: 10.1161/01.CIR.0000161956.75255.7B. [DOI] [PubMed] [Google Scholar]
- 83.Yan LL, Daviglus ML, Liu K, Stamler J, Wang R, Pirzada A, Garside DB, Dyer AR, Van Horn L, Liao Y, Fries JF, Greenland P. Midlife body mass index and hospitalization and mortality in older age. JAMA. 2006;295:190–198. doi: 10.1001/jama.295.2.190. [DOI] [PubMed] [Google Scholar]
- 84.Gottesman O, Drill E, Lotay V, Bottinger E, Peter I. Can genetic pleiotropy replicate common clinical constellations of cardiovascular disease and risk? PLoS One. 2012;7:e46419. doi: 10.1371/journal.pone.0046419. [DOI] [PMC free article] [PubMed] [Google Scholar]
- 85.Holmes MV, Lange LA, Palmer T, et al. Causal effects of body mass index on cardiometabolic traits and events: a Mendelian randomization analysis. Am J Hum Genet. 2014;94:198–208. doi: 10.1016/j.ajhg.2013.12.014. [DOI] [PMC free article] [PubMed] [Google Scholar]
- 86.Li N, van der Sijde MR, Bakker SJ, Dullaart RP, van der Harst P, Gansevoort RT, Elbers CC, Wijmenga C, Snieder H, Hofker MH, Fu J LifeLines Cohort Study Group. Pleiotropic effects of lipid genes on plasma glucose, HbA1c, and HOMA-IR levels. Diabetes. 2014;63:3149–3158. doi: 10.2337/db13-1800. [DOI] [PubMed] [Google Scholar]
- 87.van Vliet-Ostaptchouk JV, den Hoed M, Luan J, et al. Pleiotropic effects of obesity-susceptibility loci on metabolic traits: a meta-analysis of up to 37,874 individuals. Diabetologia. 2013;56:2134–2146. doi: 10.1007/s00125-013-2985-y. [DOI] [PubMed] [Google Scholar]
- 88.Hong C, Tontonoz P. Liver X receptors in lipid metabolism: opportunities for drug discovery. Nat Rev Drug Discov. 2014;13:433–444. doi: 10.1038/nrd4280. [DOI] [PubMed] [Google Scholar]
Associated Data
This section collects any data citations, data availability statements, or supplementary materials included in this article.