Background: Protein N-terminal methyltransferases (NTMTs) methylate protein N-terminal α-amines.
Results: Inhibition pattern and methylation progress analyses were performed to determine the kinetic mechanism and processivity of NTMT1.
Conclusion: NTMT1 utilizes a random sequential Bi Bi mechanism and proceeds in a distributive manner.
Significance: This information provides a rational basis for developing specific inhibitors targeting NTMT1.
Keywords: Enzyme Kinetics, Enzyme Mechanism, Enzyme Processing, Epigenetics, Post-translational Modification (PTM), Protein Methylation, Distributive Mechanism, Protein N-terminal Methyltransferase
Abstract
The protein N-terminal methyltransferase 1 (NTMT1) catalyzes the transfer of the methyl group from the S-adenosyl-l-methionine to the protein α-amine, resulting in formation of S-adenosyl-l-homocysteine and α-N-methylated proteins. NTMT1 is an interesting potential anticancer target because it is overexpressed in gastrointestinal cancers and plays an important role in cell mitosis. To gain insight into the biochemical mechanism of NTMT1, we have characterized the kinetic mechanism of recombinant NTMT1 using a fluorescence assay and mass spectrometry. The results of initial velocity, product, and dead-end inhibition studies indicate that methylation by NTMT1 proceeds via a random sequential Bi Bi mechanism. In addition, our processivity studies demonstrate that NTMT1 proceeds via a distributive mechanism for multiple methylations. Together, our studies provide new knowledge about the kinetic mechanism of NTMT1 and lay the foundation for the development of mechanism-based inhibitors.
Introduction
Protein methylation is an important epigenetic modification that has been implicated in regulation of transcription, DNA repair, signal transduction, and protein-protein interactions (1, 2). Enzymes that are responsible for methylating lysine and arginine residues in proteins have received extensive attention over the past decades (1, 2). Although protein α-N-methylation was observed for a variety of proteins over 3 decades ago, little is known about this modification (3). In 2010, the first two eukaryotic α-N-terminal protein methyltransferases were discovered; the Macara laboratory (4) identified NTMT12/NRMT1/METTL11A from humans, and the Clarke laboratory (5) identified YBR261C/Tae1 from yeast. Recently, Schaner Tooley and co-workers (6) showed that NTMT2/NRMT2/METTL11B also has α-N-terminal methylation activity.
NTMT1 transfers a methyl group from the S-adenosyl-l-methionine (AdoMet) to α-N-terminal amines, where the lone pair of electrons on the α-amine attacks the electrophilic methylsulfonium group of AdoMet to yield the S-adenosyl-l-homocysteine (AdoHcy) and methylated protein (Fig. 1). There are generally three different methylation states: mono-, di-, and trimethylation. The different individual methylation states at the protein α-N terminus may have divergent roles with respect to biological functions (3, 7, 8). The relative populations of all four methylation states of regulator of chromosome condensation 1 (RCC1) have been shown to differ between asynchronous and mitotic cells, with the dimethylated species being the most prevalent (7). However, the centromere protein A (CENP-A) is predominantly trimethylated during mitosis (8).
FIGURE 1.

NTMT1-catalyzed methylation reaction. SAM, AdoMet; SAH, AdoHcy.
NTMT1 recognizes a canonical motif XPK (where X represents A, P, or S) (4). Known substrates carrying this motif include RCC1, SET protein (also known as I2PP2A), tumor suppressor retinoblastoma protein, zinc finger protein 15, and damaged DNA-binding protein 2 (4, 9). Recent in vitro peptide methylation studies reveal that NTMT1 has a broader substrate specificity (10). Therefore, α-N-terminal methylation is likely to be a widespread post-translational modification.
NTMT1 has been shown to play an important role in regulating protein-DNA interactions (7, 9). Knockdown of NTMT1 increases multipolar spindle formation during cell mitosis and results in mitotic defects (7). The α-N-terminal methylation of RCC1 is essential to stabilize its interaction with chromatin during mitosis and to ensure proper mitotic division (7). The α-N-terminal methylation of CENP-A and -B was shown to enhance their binding to chromatin and CENP-B box during mitosis (8, 11). The α-N-terminal methylation of damaged DNA-binding protein 2 facilitates its recruitment to DNA damage foci for DNA repair (9). Also, the level of α-N-terminal methylation increases in response to a variety of extracellular stimuli, including increased cell density, heat shock, and arsenite treatment (11, 12).
Despite increased efforts to understand various NTMT1 activities within a cellular context, very little is known about its mechanism. Herein we sought to determine the kinetic mechanism for NTMT1. Additionally, we have examined the progression of methylation to determine how the distribution of methylation states varies over time. Our results indicate that NTMT1 follows a random sequential Bi Bi mechanism in which either AdoMet or protein substrate can initially bind to NTMT1. Furthermore, we find that NTMT1 catalysis displays a distributive mechanism for multiple methylations.
EXPERIMENTAL PROCEDURES
Materials
All chemicals and reagents were used as purchased without further purification except for α-cyano-3-hydroxycinnamic acid. Most chemicals and reagents were purchased from Aldrich, Fisher, VWR, EMD, Calbiochem, and ChemImpex. Nickel-nitrilotriacetic acid resin was used as purchased from Qiagen. Human NTMT1 clone (AD-003) was obtained from Addgene. The AdoHcy hydrolase (SAHH) clone was obtained through a Materials Transfer Agreement with Dr. Raymond C. Trievel (University of Michigan) and was expressed and purified as described by Collazo et al. (13).
Preparation of Peptide Substrates and Inhibitors
Peptides representing hRCC1-6 (SPKRIA), hRCC1-9 (SPKRIAKRR), hRCC1-10 (SPKRIAKRRS), and hRCC1-12 (SPKRIAKRRSPP) were synthesized on Rink amide resin using standard Fmoc chemistry with a CEM Liberty microwave peptide synthesizer. Fmoc protection groups at the α-N termini were removed by 20% (v/v) piperidine in N,N-dimethylformamide. Me-RCC1-10 and Ac-RCC1-10 peptides were prepared according to the literature (14). The Me2-RCC1-10 peptide was synthesized as follows. To the deprotected RCC1-10 peptide on resin (0.1 mmol) in N,N-dimethylformamide (2 ml) was added formaldehyde (24 μl of 37% (w/v) solution, 0.24 mmol), HOAc (20 μl), and NaBH3CN (15 mg, 0.24 mmol) (15). The mixture was placed on a shaker for 4 h. The resin was washed with N,N-dimethylformamide, and the reaction was repeated. The procedure for synthesis of Me3-RCC1-10 peptide was as follows. To Me2-RCC1-10 on resin (0.03 mmol) in N,N-dimethylformamide (2 ml) was added methyl iodide (83 μl, 1.2 mmol), 18-crown-6 (176 mg, 0.6 mmol), and K2CO3 (93 mg, 0.6 mmol) (16). The reaction column was wrapped in aluminum foil and placed on a shaker overnight. Peptides were cleaved from resin and purified by reverse phase HPLC (Waters). The synthesized peptides were confirmed by mass spectrometry. RCC1-6 [M + H]+ calcd 670.4359, found 670.4818. Me3RCC1-6 [M + H]+ calcd 712.4828, found 682.5795 ([M-30]+). RCC1-9 [M + H]+ calcd 1110.7331, found 1110.8332. RCC1-10 [M + H]+ calcd 1197.7651, found 1197.9726. MeRCC1-10 [M + H]+ calcd 1211.7807, found 1212.0329. Me2RCC1-10 [M + H]+ calcd 1225.7964, found 1226.0826. Me3RCC1-10 [M + H]+ calcd 1239.8120, found 1210.0995 ([M-30]+). Ac-RCC1-10 [M + H]+ calcd 1239.7756, found 1240.0435. RCC1-12 [M + H]+ calcd 1392.8546, found 1392.0378. Amino acid analysis was performed by the W.M. Keck Foundation Biotechnology Resource Laboratory at Yale University for three peptides (RCC1-10, Me-RCC1-10, and Ac-RCC1-10). The Ac-RCC1-10 was used to generate a calibration curve by HPLC for quantitation of the remaining peptides.
Purification of NTMT1
His-NTMT1 was expressed in Escherichia coli BL21 (DE3) codon plus RIL cells in Terrific Broth medium in the presence of 50 μg/ml kanamycin, using a pET28a-LIC expression vector that encodes a full-length NTMT1 (amino acids 1–222) with His6 tag obtained from Addgene. Cells were grown at 37 °C to A600 of 1.5, induced by isopropyl β-d-1-thiogalactopyranoside (final concentration 1 mm), and incubated overnight at 15 °C. Cells were harvested by centrifugation at 5,000 rpm. Cell pellets were suspended in 25 mm Tris-HCl buffer (pH 8.0) containing 0.3 m NaCl and 10 mm imidazole, lysed by passing through a Microfluidizer (Microfluidics Corp.) at 20,000 p.s.i., and centrifuged at 15,000 rpm for 15 min at 4 °C. The supernatant was loaded onto a nickel-nitrilotriacetic acid column. After removal of unbound protein by extensive washing, the protein was eluted with 25 mm Tris-HCl buffer (pH 8.0) containing 100 mm imidazole and 300 mm NaCl. Combined elution fractions were dialyzed in the dialysis buffer (25 mm Tris, pH 7.5, 150 mm NaCl, 50 mm KCl) three times to provide His-NTMT1. The yield was 20 mg/liter.
To remove the His tag from NTMT1, thrombin (200 μl, 1 unit/μl in 1× PBS) was added to His-NTMT1 (20 mg) in 25 mm Tris-HCl buffer (pH 8.0) containing 100 mm imidazole and 300 mm NaCl and gently shaken at room temperature. After 3.5 h, p-aminobenzamidine-agarose was added to remove thrombin. The resultant solution was dialyzed in 25 mm Tris-HCl buffer (pH 8.0) buffer containing 150 mm NaCl and 50 mm KCl overnight and run over a nickel column three times to remove residual His-NTMT1 and yield untagged NTMT1, which was stored at −80 °C. Protein purity (>95%) was verified by SDS-PAGE, and the concentration was determined.
Continuous Fluorescence Assay
A fluorescence-based SAHH-coupled assay was adapted to study the kinetics of NTMT1, which monitors the formation of a ThioGlo1-thiol adduct that exhibits a strong fluorescence at 500 nm (13, 17, 18). NTMT1 activity was measured under the following conditions in a final well volume of 100 μl: 25 mm Tris (pH 7.5), 50 mm KCl, 10 μm SAHH, 0.2 μm NTMT1, 100 μm AdoMet, and 15 μm ThioGlo1. 10 μm SAHH was used to ensure that the hydrolysis of AdoHcy was not rate-limiting as compared with NTMT1. ThioGlo1 was prepared as a stock solution in DMSO and stored protected from light at −20 °C. All components except for peptide substrate were initially mixed in a 96-well plate, and the reaction was initiated at 37 °C with the addition of a peptide substrate. All peptide substrate concentrations were varied from 0 to 40 μm except for RCC1-6, which was varied from 0 to 160 μm. Fluorescence was monitored on a FlexStation® 3 microplate reader with excitation = 370 nm and emission = 500 nm. The data for the initial rates were fit to the Michaelis-Menten model using least squares nonlinear regression with GraphPad Prism 5 software (version 5.04).
Initial Velocity Analysis
The initial rates for AdoMet were determined at different fixed concentrations of the RCC1-10 peptide (1, 2, 4, and 8 μm). For reactions where the RCC1-10 peptide was the varied substrate, the initial rates were examined at fixed concentration of AdoMet (12.5, 25, 50, and 100 μm). The initial rates were globally fit to the following equations using least squares nonlinear regression with GraphPad Prism 5 software (19).
 |
When A is saturating, αKB = KmB.
 |
KA and KB are the dissociation constants of the substrate A and B binding to the free enzyme, respectively (19). Vmax and Km are the Michaelis constants.
Mass Spectrometry-based Methylation Assay
Mass spectrometry (MS)-based methylation assays were performed and analyzed via an Applied Biosystems Voyager matrix-assisted laser desorption/ionization time-of-flight mass spectrometer. Methylation was performed under the following conditions: 0.2 μm NTMT1, 25 mm Tris (pH 7.5), 50 mm KOAc, peptide substrate, and 2 mm dithiothreitol at either 30 or 37 °C for 5 min before the addition of AdoMet to initiate the reaction. Aliquots were quenched in a 1:1 ratio with a quenching solution (20 mm NH4H2PO4, 0.4% (v/v) TFA in 1:1 acetonitrile/water) and kept at 4 °C before analysis (20). α-Cyano-3-hydroxycinnamic acid was recrystallized and dissolved to a final concentration of 2 mg/ml in matrix solution (10 mm NH4H2PO4, 0.2% (v/v) TFA in 1:1 acetonitrile/water) (20, 21). Samples (0.3 μl) were directly spotted with 0.5 μl of α-cyano-3-hydroxycinnamic acid matrix solution. An average of five acquisitions were performed for each well. For the inhibition assays, inhibitors were incubated in buffer with NTMT1 in the absence of both enzyme substrates for 5 min. Three independent trials were performed for all experiments. Data were processed in Data Explorer by applying a noise filter (correlation factor of 0.7) and a baseline correction. The fraction of each methylation state was determined by summing the areas of the monoisotopic peaks for that state ([M + H]+, [M + Na]+, and [M + K]+) and dividing by the total area of all relevant species. Multiplying the original peptide concentration by the fraction gave the concentration of each methylation state. Dividing the concentration by the time at which the aliquot was quenched provided the rate of methylation for that species. Rate constants for the irreversible conversion of substrates to products were determined by fitting of the progression data with the Levenberg-Marquardt algorithm via Dynafit (22, 23).
Inhibition Studies
The Me3-RCC1-10 peptide and AdoHcy were used as the product inhibitors. The Ac-RCC1-10 and sinefungin were used as the dead-end analogues (24). We used RCC1-9 as the peptide substrate in the inhibition studies because Ac-RCC1-10 and Me3-RCC1-10 overlap the peaks for RCC1-10. The IC50 values were determined for all four inhibitors by fitting the activity data with GraphPad. In cases where the highest concentration tested did not result in greater than 50% inhibition, the IC50 was determined manually as greater than the highest concentration. The inhibition patterns were determined by fitting the initial rate data for competitive, noncompetitive, uncompetitive, and mixed inhibition, respectively.
RESULTS
Protein Expression and Purification
His-NTMT1 was expressed as a fusion protein and purified according to a published protocol from the Structural Genomics Consortium. The His tag was removed with thrombin to yield untagged NTMT1. The yield for the cleaved form of NTMT1 is 2.5 mg/liter after purification.
Kinetic Characterization of NTMT1 Activity
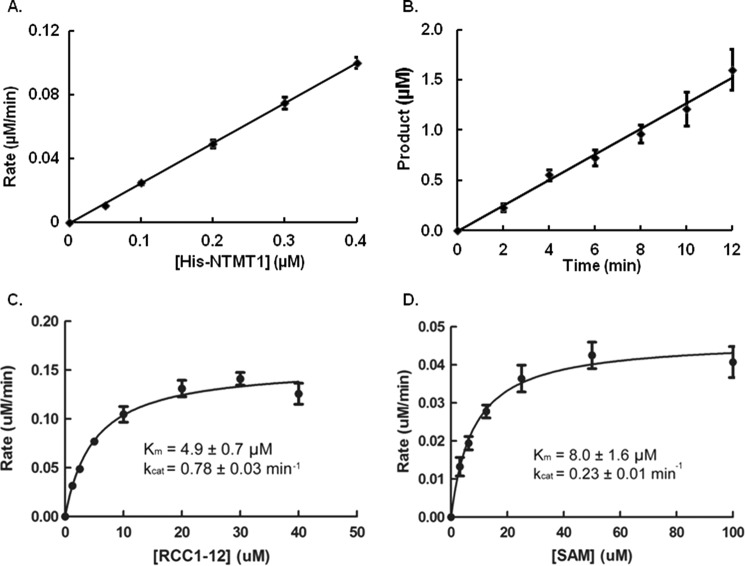
The steady-state kinetic parameters of both His-NTMT1 and NTMT1 were determined for RCC1-12 and AdoMet using a continuous fluorescence assay (13, 17, 18). For the fluorescence assay, the concentration of AdoHcy formed during the reaction was derived from a standard calibration curve generated with glutathione and ThioGlo1. The linearity of the methylation reaction with respect to enzyme concentration was confirmed in the range of 0–0.4 μm (Fig. 2A). We chose to use 0.2 μm enzyme for our assays, and the linearity of the methylation reaction with respect to time is shown in Fig. 2B. We compared the activities between His-NTMT1 and NTMT1. The Km value for RCC1-12 with His-NTMT1 is 4.9 ± 0.7 μm, with a kcat value at 0.78 ± 0.03 min−1 (Fig. 2C). The Km value for AdoMet with His-NTMT1 is 8.0 ± 1.6 μm with a kcat value at 0.23 ± 0.01 min−1 (Fig. 2D). These values are in reasonable agreement with NTMT1 (Table 1). Therefore, we used both His-NTMT1 and untagged NTMT1 interchangeably.
FIGURE 2.
Steady-state kinetics of His-NTMT1 activity as detected by fluorescence assay. A, linear relationship between His-NTMT1 concentration and initial velocity (y = 0.2525x − 0.001, R2 = 0.9996). B, the linear increase in the concentration of product with time (y = 0.1282x − 0.0126, R2 = 0.9919). C, varied RCC1-12 concentration with AdoMet at 100 μm. D, varied AdoMet (SAM) concentration with RCC1-12 at 40 μm. Error bars, S.D.
TABLE 1.
Comparison of activities of His-NTMT1 with NTMT1
| Substrate | NTMT1 |
His-NTMT1 |
||||
|---|---|---|---|---|---|---|
| Km | kcat | kcat/Km | Km | kcat | kcat/Km | |
| μm | min−1 | m−1 min−1 | μm | min−1 | m−1 min−1 | |
| RCC1-12a | 3.1 ± 0.3 | 0.57 ± 0.01 | 1.8×10⁵ | 4.9 ± 0.7 | 0.78 ± 0.03 | 1.6×10⁵ |
| AdoMetb | 11.7 ± 1.3 | 0.57 ± 0.02 | 4.9×10⁴ | 8.0 ± 1.6 | 0.23 ± 0.01 | 2.9×10⁴ |
a [AdoMet] = 100 μm.
b [RCC1-12] = 40 μm.
Substrate Recognition
A series of peptides based on the N terminus of RCC1 were prepared with different lengths and N-terminal methylation states. We determined the steady-state kinetic parameters for methylation of these peptide substrates via fluorescence assay. The resulting rate constants are compiled in Table 2. Kinetic studies on peptides with different lengths (6–12-mer) gave Km values from 0.89 to 4.9 μm and kcat values from 0.44 to 0.59 min−1. The kcat/Km values ranged from 1.4 × 10⁵ to 4.9 × 10⁵ m−1 min−1. The Km values for the unmethylated and monomethylated substrates are very similar (0.89 and 1.4 μm, respectively). The Km value for the dimethylated substrate (4.3 μm) is about 5-fold higher than unmethylated substrate. The kcat/Km value for the dimethylated substrate is about 3–4-fold lower than unmethylated and monomethylated peptide substrates.
TABLE 2.
Effect of C-terminal truncations and N-terminal modifications of NTMT1 recognition
| Peptide ID | Sequence | Km | kcat | kcat/Km |
|---|---|---|---|---|
| μm | min−1 | m−1 min−1 | ||
| RCC1-6 | SPKRIA | 3.2 ± 0.4 | 0.56 ± 0.02 | 1.8×10⁵ |
| RCC1-9 | SPKRIAKRR | 1.4 ± 0.1 | 0.53 ± 0.01 | 3.8×10⁵ |
| RCC1-10 | SPKRIAKRRS | 0.89 ± 0.09 | 0.44 ± 0.01 | 4.9×10⁵ |
| MeRCC1-10 | Me-SPKRIAKRRS | 1.4 ± 0.1 | 0.58 ± 0.01 | 4.1×10⁵ |
| Me2RCC1-10 | Me2-SPKRIAKRRS | 4.3 ± 0.5 | 0.59 ± 0.02 | 1.4×10⁵ |
NTMT1 Catalysis Proceeds in a Distributive Manner
We applied a MALDI-MS assay to understand the progression of methylation for RCC1-10 and Me-RCC1-10. To determine whether ionization efficiency was a factor, we analyzed a sample mixture containing variable amounts of peptides with differing methylation states (RCC1-10, Me-RCC1-10, Me2-RCC1-10, and Me3-RCC1-10) via MALDI-MS. The relative fraction of each peptide was calculated from the areas of all of the relevant peaks for each component. Results showed acceptable levels of precision and accuracy (less than 5% error), indicating that N-terminal methylation does not significantly affect the efficiency of ionization.
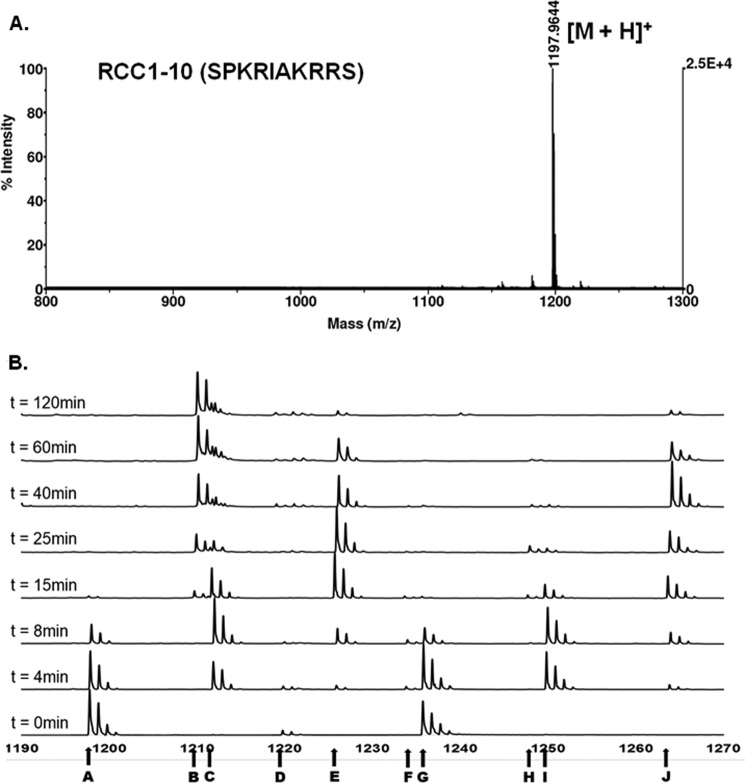
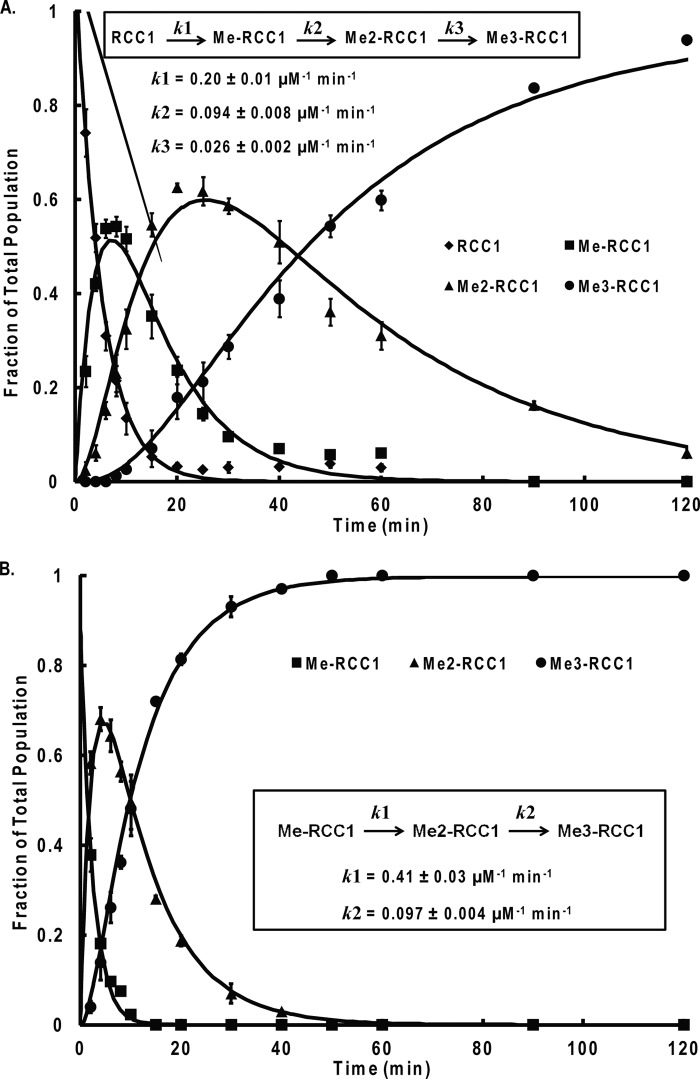
As shown in Figs. 3 and 4, we monitored product formation over 2 h. For both RCC1-10 and Me-RCC1-10 substrates, the concentrations of each of the intermediates (Me-RCC1-10 and Me2-RCC1-10, respectively) increased to ∼50% of the sample throughout the progression. The overall peptide concentration was 10 μm, so the intermediate concentrations peaked at ∼5 μm. Because the enzyme concentration was only 0.2 μm, the intermediates must be released and accumulated throughout the progress of the reaction, which is indicative of a distributive mechanism. The progression of methylation of the monomethylated RCC1 was faster than that of the dimethylated RCC1, with complete trimethylation occurring within 40 min. The RCC1 peptide was consumed at a slightly slower rate, with complete trimethylation occurring after about 2 h, which was partially due to the extra intermediate step for the RCC1 peptide compared with the monomethylated substrate. In both cases, the half-life time for initial substrate was about 3 min. The data were fitted via Dynafit software to determine the rate constant (k) for each methylation step (Fig. 4). For the methylation progression from the RCC1 to Me3RCC1, a k1 value of 0.20 ± 0.01 μm−1 min−1 was obtained. The MeRCC1 fitting analysis afforded a k1 value of 0.41 ± 0.03 μm−1 min−1.
FIGURE 3.
MALDI-MS analysis of RCC1-10 peptide methylation progression. A, mass spectrum of RCC1-10 peptide. B, representative stacked plot of MALDI-MS analysis of methylation of RCC1-10. Monoisotopic peaks from left to right are as follows: m/z 1197, [M + H]+ (A); m/z 1210, [M + 3CH3-30]+ (B); m/z 1211, [M + CH3 + H]+ (C); m/z 1219, [M + Na]+ (D); m/z 1225, [M + 2CH3 + H]+ (E); m/z 1233, [M + CH3 + Na]+ (F); m/z 1235, [M + K]+ (G); m/z 1247, [M + 2CH3 + Na]+ (H); m/z 1249, [M + CH3 + K]+ (I); m/z 1263, [M + 2CH3 + K]+ (J).
FIGURE 4.
NTMT1 methylated the RCC1-10 and Me-RCC1-10 in a distributive fashion. A, population distribution of RCC1-10 methylated states over time. B, population distribution of MeRCC1-10 methylated states over time. Unmethylated, monomethylated, dimethylated, and trimethylated RCC1-10 were quantified by mass spectrometry. The reactions were carried out with 0.2 μm NTMT1, 10 μm RCC1-10 or Me-RCC1-10, and 50 μm AdoMet in 25 mm Tris, 50 mm KCl, and 2 mm DTT. Error bars, S.D.
Initial Velocity Studies
We carried out initial velocity studies to characterize the kinetic mechanism of NTMT1. The initial velocities were fit to a global nonlinear curve to obtain values for Km(RCC1-10), Km(AdoMet), and K(RCC1-10) when the concentration of RCC1-10 peptide was varied at different fixed concentrations of the AdoMet. Similar experiments were performed to obtain Km(RCC1-10), Km(AdoMet), and K(AdoMet) when the concentration of AdoMet was varied at different fixed concentrations of the RCC1-10 (Table 3). The resulting double reciprocal plots exhibit an increasing slope with decreasing AdoMet concentrations, producing intersecting lines with the intercept lying in the second quadrant (Fig. 5). This pattern indicates that NTMT1 catalysis proceeds in a sequential rather than a ping-pong mechanism.
TABLE 3.
Initial velocity studies
| Varied substrate | Fixed substrate | kcat | K(RCC1) | Km (RCC1) | K(AdoMet) | Km (AdoMet) |
|---|---|---|---|---|---|---|
| min−1 | μm | μm | μm | μm | ||
| RCC1-10 | AdoMeta | 0.59 ± 0.03 | 3.3 ± 1.3 | 1.6 ± 0.4 | 13.6 ± 2.8 | |
| AdoMet | RCC1-10b | 1.4 ± 0.1 | 2.3 ± 0.4 | 7.9 ± 2.9 | 6.1 ± 1.7 |
a [AdoMet] = 12.5, 25, 50, or 100 μm.
b [RCC1-10] = 1, 2, 4, or 8 μm.
FIGURE 5.
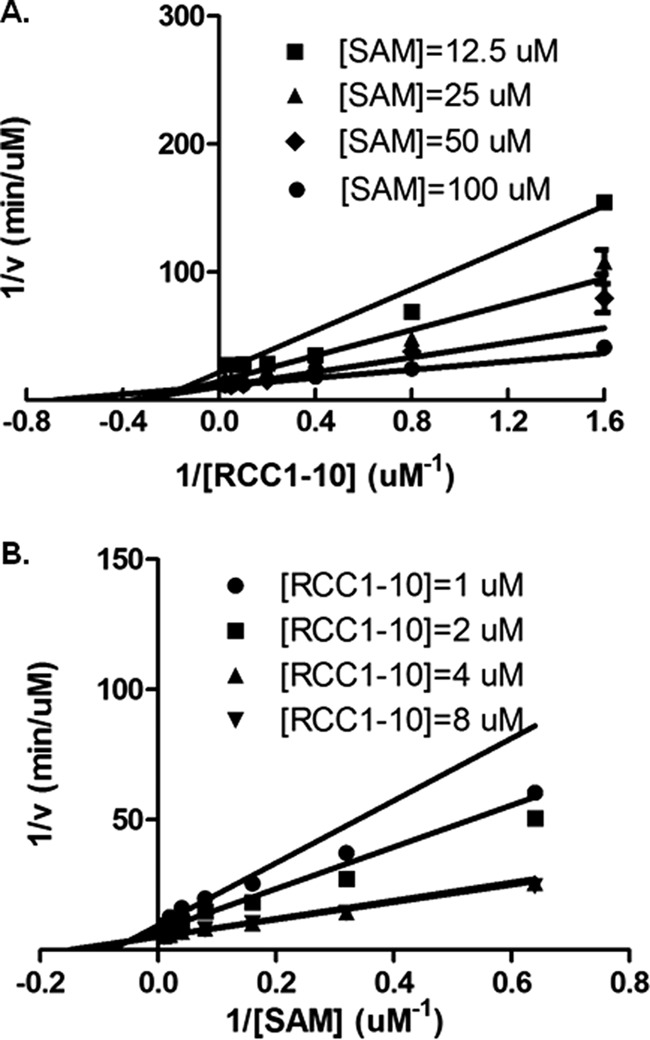
Initial velocity patterns. Lineweaver-Burk plots display an intersecting line pattern, indicative of a sequential mechanism, when fixed concentrations of AdoMet (SAM) and RCC1-10 are assayed at various concentrations of the substrate, RCC1-10 (A) and AdoMet (B). Error bars, S.D.
Product and Dead-end Inhibition Studies
In order to determine the order of substrate binding and product release for the NTMT1-catalyzed reaction, product and dead-end inhibition studies were performed. We initiated the inhibition studies by determination of the IC50 values for each of the product and dead-end inhibitors via the MALDI-MS assay as described under “Experimental Procedures.” We used AdoHcy and Me3-RCC1-6 as product inhibitors. Sinefungin, which is a known methyltransferase inhibitor, and Ac-RCC1-10, which has an acetyl group at the N-α-amine, were used as the inhibitors for the dead-end analogue studies. AdoHcy was found to have an IC50 value of ∼3 μm. Sinefungin was found to be 10-fold less active than AdoHcy, with an IC50 of 33 μm. However, neither of the peptide analogues (trimethylated or acetylated) showed significant inhibitory activity up to 25 μm (Table 4).
TABLE 4.
Product and dead-end inhibition results for NTMT1
| Inhibitor | IC50 | Varying substrate |
|
|---|---|---|---|
| AdoMeta | RCC1-9b | ||
| μm | |||
| Me3RCC1-6 | >25 | Noncompetitive | Competitive |
| SAH | 3.3 ± 0.4 | Competitive | Noncompetitive |
| Ac-RCC1-10 | >30 | Noncompetitive | Competitive |
| Sinefungin | 32.7 ± 5.0 | Competitive | Noncompetitive |
a [RCC1-9] = 4 μm.
b [AdoMet] = 5 μm.
For product inhibition studies, the results show that the Me3-RCC1-6 peptide acts as a competitive inhibitor when the concentration of RCC1-9 peptide is varied and AdoMet is at a fixed concentration (Fig. 6). AdoHcy was a competitive inhibitor when the concentration of AdoMet was varied and RCC1-9 substrate peptide was at a fixed concentration (Fig. 7). The results indicate that AdoHcy and Me3-RCC1-6 compete with AdoMet and RCC1-9 for the same form of the NTMT1, respectively. To further define the kinetic mechanism of NTMT1, we determined the inhibition pattern by Me3-RCC1-6 at fixed concentration of RCC1-9. The results showed that Me3-RCC1-6 is a noncompetitive inhibitor for AdoMet, and AdoHcy is a noncompetitive inhibitor for RCC1-9 (Figs. 6 and 7). These inhibition patterns indicate a rapid equilibrium random kinetic mechanism.
FIGURE 6.
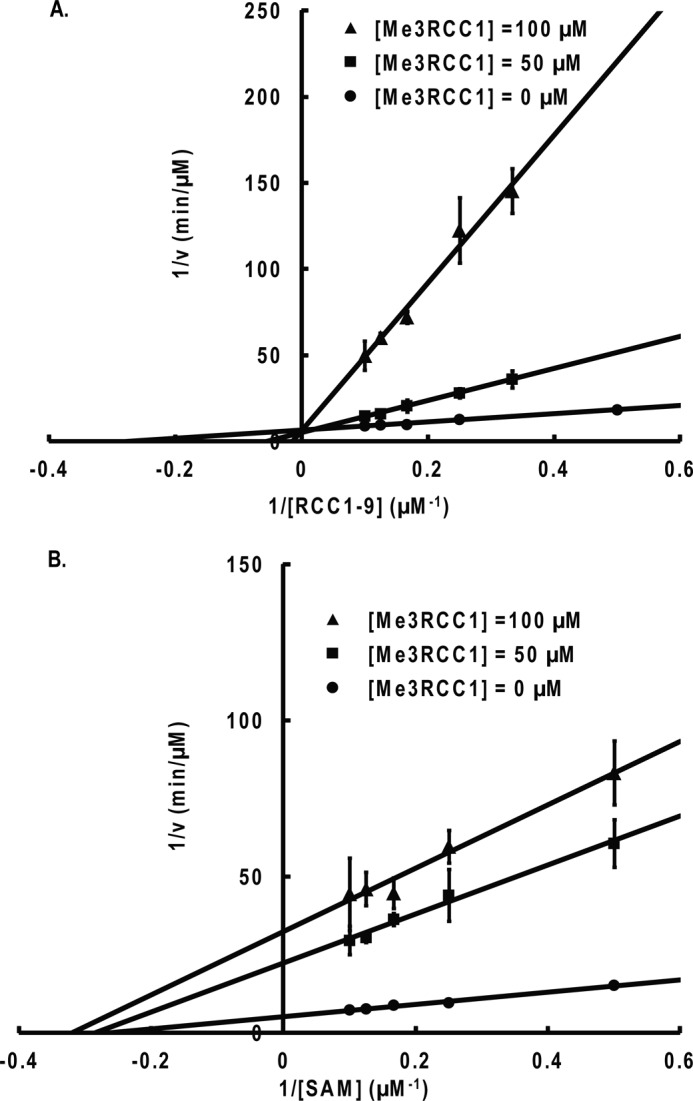
Product inhibition studies with Me3-RCC1-6. A, competitive inhibition is observed when RCC1-9 is the varied substrate and AdoMet (SAM) is the fixed substrate (8 μm). B, noncompetitive inhibition is observed when AdoMet is the varied substrate and RCC1-9 is the fixed substrate (5 μm). Error bars, S.D.
FIGURE 7.
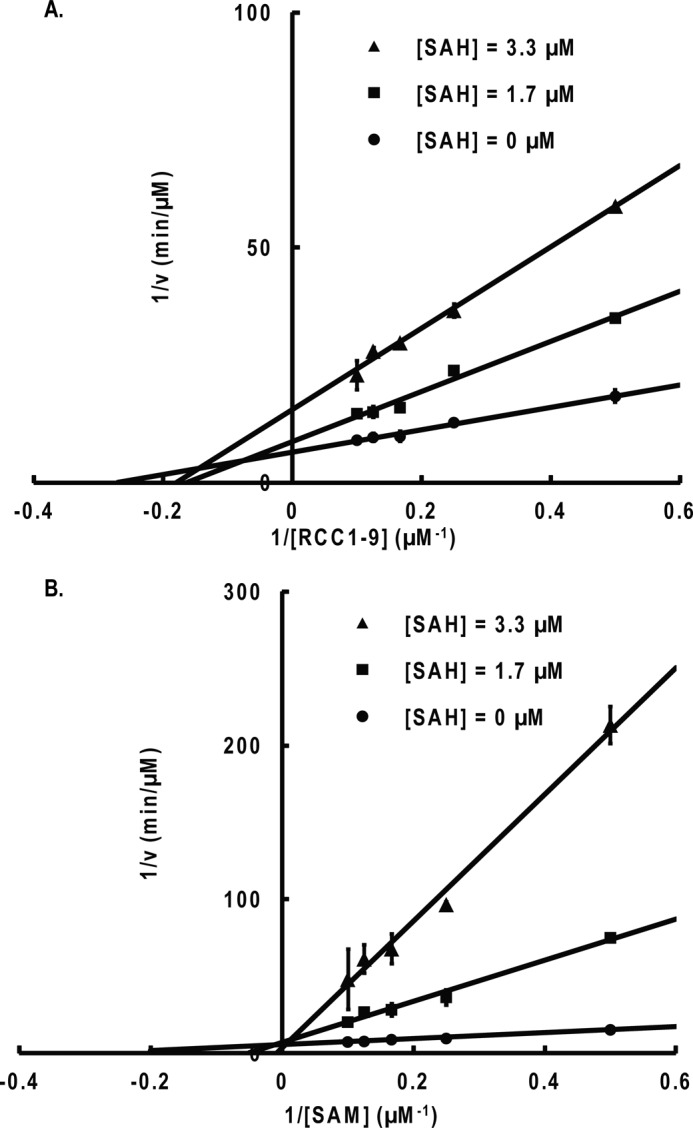
Product inhibition studies with AdoHcy (SAH). A, noncompetitive inhibition is observed when RCC1-9 is the varied substrate and AdoMet (SAM) is the fixed substrate (8 μm). B, competitive inhibition is observed when AdoMet is the varied substrate and RCC1-9 is the fixed substrate (5 μm). Error bars, S.D.
To further confirm the kinetic mechanism of NTMT1, we carried out dead-end analogue studies. Results show that the Ac-RCC1-10 peptide acts as a competitive inhibitor when the concentration of RCC1-9 peptide is varied and AdoMet is at a fixed concentration (Fig. 8). Sinefungin was a competitive inhibitor when the concentration of AdoMet was varied and RCC1-9 substrate peptide was at a fixed concentration (Fig. 9). The results indicate that sinefungin and Ac-RCC1-10 compete with AdoMet and RCC1-9 for the same form of the NTMT1, respectively. Noncompetitive inhibition patterns were observed by sinefungin and Ac-RCC1-10 for RCC1-9 and AdoMet, respectively (Figs. 8 and 9). Taken together, these results indicate that the enzyme proceeds via a random ordered mechanism because an ordered or Theorell-Chance mechanism would require the observation of at least one uncompetitive inhibition pattern for either of the substrates (Scheme 1).
FIGURE 8.
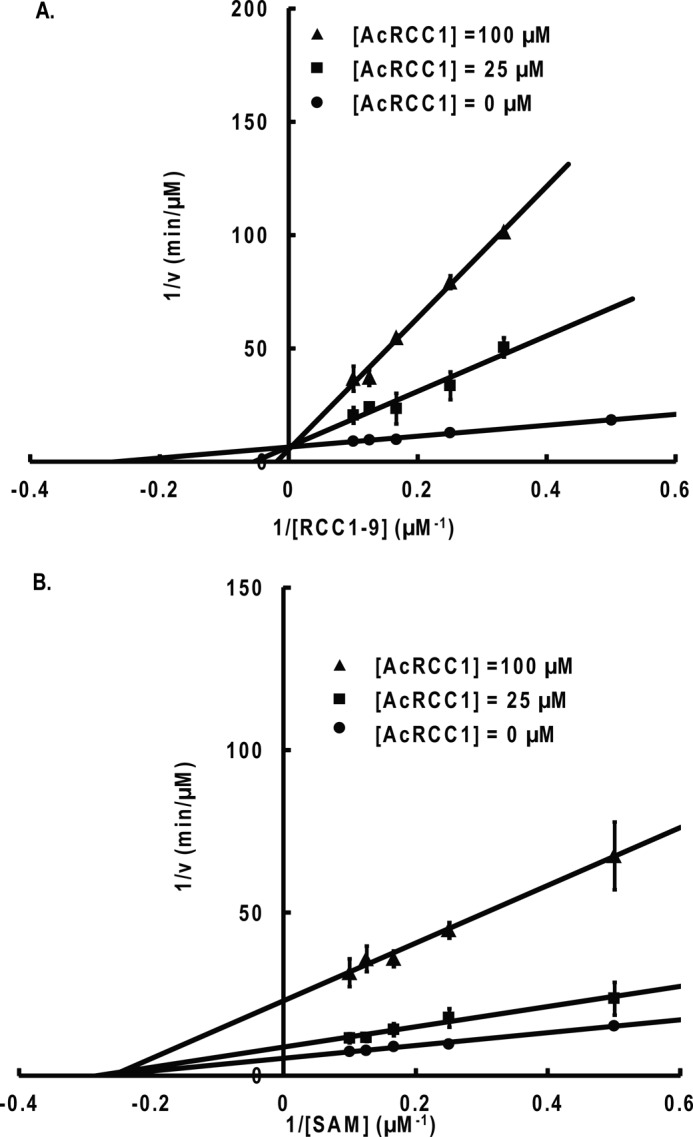
Dead-end analogue inhibition studies with Ac-RCC1-10. A, competitive inhibition is observed when RCC1-9 is the varied substrate and AdoMet is the fixed substrate (8 μm). B, noncompetitive inhibition is observed when AdoMet (SAM) is the varied substrate and RCC1-9 is the fixed substrate (5 μm). Error bars, S.D.
FIGURE 9.
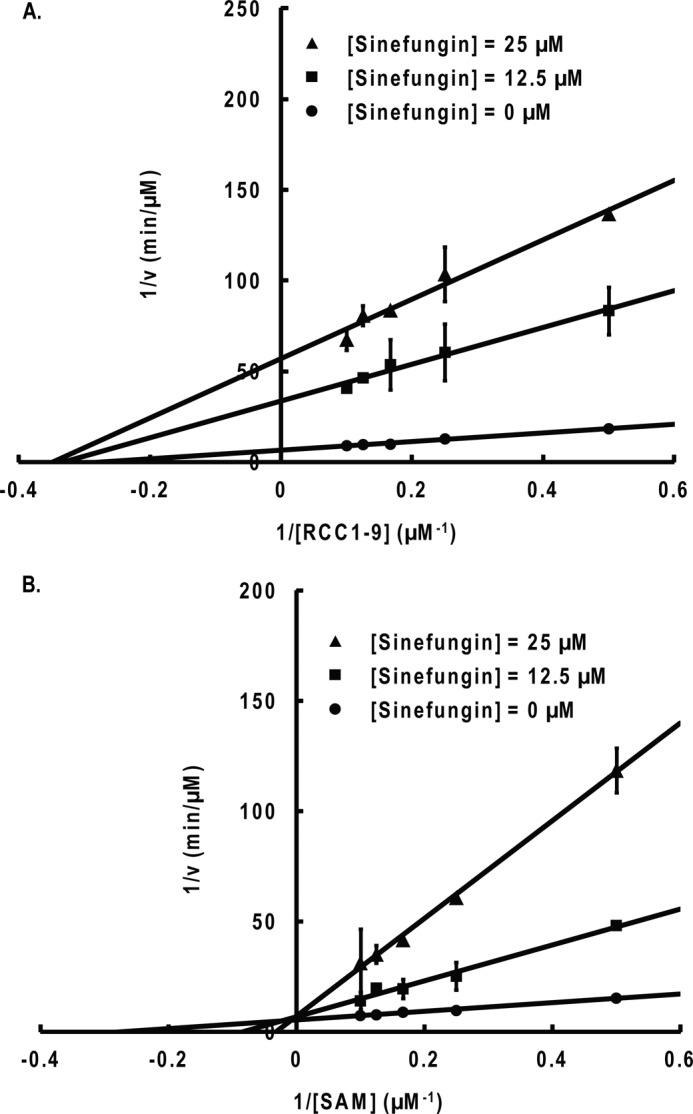
Product inhibition studies with sinefungin. A, noncompetitive inhibition is observed when RCC1-9 is the varied substrate and AdoMet is the fixed substrate (8 μm). B, competitive inhibition is observed when AdoMet (SAM) is the varied substrate and RCC1-9 is the fixed substrate (5 μm). Error bars, S.D.
SCHEME 1.
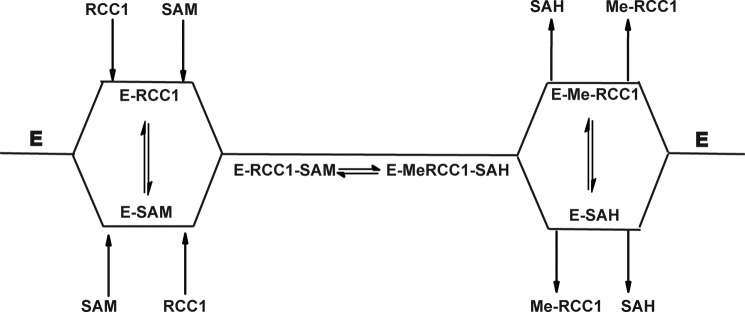
Random sequential mechanism. SAM, AdoMet; SAH, AdoHcy.
DISCUSSION
Specific chemical inhibitors can serve as valuable tools for manipulating the biological functions of NTMT1 and elucidating its role in cell growth and cancer research. In order to rationally design specific NTMT1 inhibitors, we initiated our efforts to characterize the substrate recognition, processivity, and kinetic mechanism for NTMT1. To identify a short peptide substrate that could be used for mechanistic studies, we have prepared a series of peptides and determined their steady-state kinetic parameters. Our studies revealed that peptides that are derived from the N-terminal of RCC1 showed comparable Km values and catalytic efficiency. The Km values of peptide substrates decrease and the catalytic efficiency increases with increasing length of the substrate peptide up to 10-mer. The Km value increases and catalytic efficiency decreases when the substrate length is increased to a 12-mer. It appears that a 10-mer is the optimal length for RCC1 peptides. All investigated peptides contain the consensus SPK sequence, which has been inferred to be important from previous docking studies (4). Our results further show that downstream residues also contribute to catalytic efficiency.
To investigate how NTMT1 catalyzes peptide substrates with different methylation states, we modified the α-N-amines of RCC1-10 peptide to provide Me-RCC1-10, Me2-RCC1-10, and Me3-RCC1-10, as described under “Experimental Procedures.” We observed [M-30]+ for the trimethylated substrates instead of [M + H]+, which was commonly observed for the other peptides. This correlates with a loss of formaldehyde, most likely resulting from the N-terminal serine side chain. Loss of formaldehyde from protonated serine in MALDI-MS has been observed previously (25, 26). We noticed that this fragmentation is unique with trimethylated serine at the N terminus because we did not observe this phenomenon for other peptides. The reason that this fragmentation pattern was only observed with the trimethylated peptides could possibly stem from a contribution to the stability of the charged radical from the permanent positive charge of the tertiary amine on the α-carbon. Neighboring groups have been shown to contribute to the stabilization of serine fragmentation in MALDI-MS (26).
Our results along with our progression of methylation studies suggest that NTMT1 has comparable catalytic efficiency for unmethylated and monomethylated peptide substrates, with ∼3-fold lower efficiency for the dimethylated substrate. NTMT2, a close homologue of NTMT1, has been reported to be primarily a monomethyltransferase (6). It was proposed that NTMT2 primes for NTMT1 by providing monomethylated substrates based on concurrent expression of NTMT1 and NTMT2 (6). Because the kinetic constants for unmethylated and monomethylated peptide substrates from our study are comparable, it is unlikely that NTMT1 is solely dependent on NTMT2 for the production of monomethylated peptide substrates. However, NTMT2 certainly would facilitate progression toward trimethylation.
Although NTMT1 is known to catalyze the mono-, di-, and trimethylation of α-N-amines, it is not clear whether the protein substrates remain bound to the enzyme throughout multiple methylations or if the substrate is released and rebinds between each methylation event. There have been conflicting reports in the literature as to the nature of the processivity of NTMT1. Immunoprecipitation analysis of the methylation distribution for the N terminus of CENP-A was determined to be indicative of a processive mechanism (8). However, substrate specificity studies with NTMT1, as well as the distributions of methylated states of RCC1 in HeLa cells, suggest that NTMT1 proceeds in a distributive manner (7, 10). The methylation processivity is important to guide the design of mechanism-based inhibitors for NTMT1. If the enzyme were processive, inhibitors designed to mimic the transition states could be difficult to develop, because the intermediates are not released until the final product is formed. Hence, it is critical to clarify the steady-state mechanism.
We decided to directly observe the relative population changes in the methylation states over time via a mass spectrometry method. By utilizing the concentration of the initial peptide as an internal standard and comparing the relative monoisotopic peak areas, we were able to measure the populations of all methylation states simultaneously. Our methylation progression study clearly showed that the population of the different intermediate methylation states achieved concentrations that were higher than the NTMT1 concentration used in the assay, which is consistent with a distributive mechanism. However, a full-length protein substrate may exhibit a processive mechanism if it has significantly higher affinity to the enzyme or a slower off-rate than the enzyme turnover time. Future study with full-length protein substrates would be interesting to explore this possibility.
We used DynaFit software to fit both sets of progression data to generate the rate constants for each methylation step (Fig. 4). Because methylation is an irreversible process, the reaction rate is equivalent to kcat/Km. This allowed us to compare the data obtained via the mass spectrometry assay with the kcat/Km values determined in the continuous fluorescence assay (Table 2). We chose to compare the reaction constant for the first methylation step because produced AdoHcy would accumulate in sufficient concentrations to inhibit methylation rate for the following methylation steps. The initial rate constants for RCC1 and MeRCC1 (0.20 and 0.41 μm−1 min−1, respectively) are comparable with the kcat/Km values determined for these substrates (0.49 and 0.41 μm−1 min−1, respectively), which validate the methylation progression analysis and kinetic data obtained from our assays.
The inhibition study indicates that AdoHcy is a very potent inhibitor for NTMT1, which is 10-fold better than sinefungin. This suggests that AdoHcy plays an important role in regulation of NTMT1 activity in a feedback manner. 3-Deazaneplanocin A that inhibits the activity of SAHH can inhibit the activity of NTMT1 through inhibiting the hydrolysis of AdoHcy (27). Interestingly, the other product, the trimethylated peptide, has a much higher IC50 value. Further studies are needed to fully understand why the peptide inhibitors are not as efficient as the product AdoHcy. However, AdoHcy has a potential to serve as a lead compound to develop a small molecule inhibitor for NTMT1.
Herein we present the first evidence that NTMT1 is a distributive protein methyltransferase that follows a random sequential Bi Bi kinetic mechanism. A distributive processivity is favorable for the development of bisubstrate inhibitors of NTMT1 to mimic the ternary complex of both substrates bound to the enzyme. This information, in conjunction with further kinetic and inhibitory activity data, will help to better understand the substrate affinity and mechanism of the enzyme, which are an essential foundation for studying the function and regulation of protein N-terminal methylations, as well as provide a rational basis to facilitate the development of bisubstrate inhibitors as NTMT1 inhibitors to mimic the catalytic transition state.
Acknowledgments
We thank Raymond Trievel for the SAHH plasmid. We gratefully acknowledge critical feedback from Philip A. Cole and H. Tonie Wright.
This work was supported, in whole or in part, by National Institutes of Health, National Center for Advancing Translational Sciences, Grant UL1TR000058 (to the Virginia Commonwealth University Center for Clinical and Translational Research). This work was also supported by the startup funds from the Virginia Commonwealth University School of Pharmacy and the A.D. Williams Fund.
- NTMT
- protein N-terminal methyltransferase
- AdoHcy
- S-adenosyl-l-homocysteine
- SAHH
- S-adenosyl-l-homocysteine hydrolase
- AdoMet
- S-adenosyl-l-methionine
- CENP
- centromere protein
- RCC1
- regulator of chromosome condensation 1
- Fmoc
- N-(9-fluorenyl)methoxycarbonyl.
REFERENCES
- 1. Yost J. M., Korboukh I., Liu F., Gao C., Jin J. (2011) Targets in epigenetics: inhibiting the methyl writers of the histone code. Curr. Chem. Genomics 5, 72–84 [DOI] [PMC free article] [PubMed] [Google Scholar]
- 2. Copeland R. A., Olhava E. J., Scott M. P. (2010) Targeting epigenetic enzymes for drug discovery. Curr. Opin. Chem. Biol. 14, 505–510 [DOI] [PubMed] [Google Scholar]
- 3. Stock A., Clarke S., Clarke C., Stock J. (1987) N-terminal methylation of proteins: structure, function and specificity. FEBS Lett. 220, 8–14 [DOI] [PubMed] [Google Scholar]
- 4. Tooley C. E., Petkowski J. J., Muratore-Schroeder T. L., Balsbaugh J. L., Shabanowitz J., Sabat M., Minor W., Hunt D. F., Macara I. G. (2010) NRMT is an α-N-methyltransferase that methylates RCC1 and retinoblastoma protein. Nature 466, 1125–1128 [DOI] [PMC free article] [PubMed] [Google Scholar]
- 5. Webb K. J., Lipson R. S., Al-Hadid Q., Whitelegge J. P., Clarke S. G. (2010) Identification of protein N-terminal methyltransferases in yeast and humans. Biochemistry 49, 5225–5235 [DOI] [PMC free article] [PubMed] [Google Scholar]
- 6. Petkowski J. J., Bonsignore L. A., Tooley J. G., Wilkey D. W., Merchant M. L., Macara I. G., Schaner Tooley C. E. (2013) NRMT2 is an N-terminal monomethylase that primes for its homologue NRMT1. Biochem. J. 456, 453–462 [DOI] [PMC free article] [PubMed] [Google Scholar]
- 7. Chen T., Muratore T. L., Schaner-Tooley C. E., Shabanowitz J., Hunt D. F., Macara I. G. (2007) N-terminal α-methylation of RCC1 is necessary for stable chromatin association and normal mitosis. Nat. Cell Biol. 9, 596–603 [DOI] [PMC free article] [PubMed] [Google Scholar]
- 8. Bailey A. O., Panchenko T., Sathyan K. M., Petkowski J. J., Pai P. J., Bai D. L., Russell D. H., Macara I. G., Shabanowitz J., Hunt D. F., Black B. E., Foltz D. R. (2013) Posttranslational modification of CENP-A influences the conformation of centromeric chromatin. Proc. Natl. Acad. Sci. U.S.A. 110, 11827–11832 [DOI] [PMC free article] [PubMed] [Google Scholar]
- 9. Cai Q., Fu L., Wang Z., Gan N., Dai X., Wang Y. (2014) α-N-Methylation of damaged DNA-binding protein 2 (DDB2) and its function in nucleotide excision repair. J. Biol. Chem. 289, 16046–16056 [DOI] [PMC free article] [PubMed] [Google Scholar]
- 10. Petkowski J. J., Schaner Tooley C. E., Anderson L. C., Shumilin I. A., Balsbaugh J. L., Shabanowitz J., Hunt D. F., Minor W., Macara I. G. (2012) Substrate specificity of mammalian N-terminal α-amino methyltransferase NRMT. Biochemistry 51, 5942–5950 [DOI] [PMC free article] [PubMed] [Google Scholar]
- 11. Dai X., Otake K., You C., Cai Q., Wang Z., Masumoto H., Wang Y. (2013) Identification of novel α-N-methylation of CENP-B that regulates its binding to the centromeric DNA. J. Proteome Res. 12, 4167–4175 [DOI] [PMC free article] [PubMed] [Google Scholar]
- 12. Villar-Garea A., Forne I., Vetter I., Kremmer E., Thomae A., Imhof A. (2012) Developmental regulation of N-terminal H2B methylation in Drosophila melanogaster. Nucleic Acids Res. 40, 1536–1549 [DOI] [PMC free article] [PubMed] [Google Scholar]
- 13. Collazo E., Couture J. F., Bulfer S., Trievel R. C. (2005) A coupled fluorescent assay for histone methyltransferases. Anal. Biochem. 342, 86–92 [DOI] [PubMed] [Google Scholar]
- 14. Borch R. F., Bernstein M. D., Durst H. D. (1971) Cyanohydridoborate anion as a selective reducing agent. J. Am. Chem. Soc. 93, 2897–2904 [Google Scholar]
- 15. Biron E., Chatterjee J., Kessler H. (2006) Optimized selective N-methylation of peptides on solid support. J. Pept. Sci. 12, 213–219 [DOI] [PubMed] [Google Scholar]
- 16. Santhiya D., Dias R. S., Shome A., Das P. K., Miguel M. G., Lindman B., Maiti S. (2009) Role of linker groups between hydrophilic and hydrophobic moieties of cationic surfactants on oligonucleotide-surfactant interactions. Langmuir 25, 13770–13775 [DOI] [PubMed] [Google Scholar]
- 17. Dorgan K. M., Wooderchak W. L., Wynn D. P., Karschner E. L., Alfaro J. F., Cui Y., Zhou Z. S., Hevel J. M. (2006) An enzyme-coupled continuous spectrophotometric assay for S-adenosylmethionine-dependent methyltransferases. Anal. Biochem. 350, 249–255 [DOI] [PubMed] [Google Scholar]
- 18. Ctrnáctá V., Stejskal F., Keithly J. S., Hrdý I. (2007) Characterization of S-adenosylhomocysteine hydrolase from Cryptosporidium parvum. FEMS Microbiol. Lett. 273, 87–95 [DOI] [PubMed] [Google Scholar]
- 19. Copeland R. A. (2000) Enzymes: A Practical Introduction to Structure, Mechanism, and Data Analysis, 2nd Ed., pp. 352–359, Wiley-VCH, Inc., New York [Google Scholar]
- 20. Zhu X., Papayannopoulos I. A. (2003) Improvement in the detection of low concentration protein digests on a MALDI TOF/TOF workstation by reducing α-cyano-4-hydroxycinnamic acid adduct ions. J. Biomol. Tech. 14, 298–307 [PMC free article] [PubMed] [Google Scholar]
- 21. Rechthaler J., Pittenauer E., Schaub T. M., Allmaier G. (2013) Detection of amine impurity and quality assessment of the MALDI matrix α-cyano-4-hydroxy-cinnamic acid for peptide analysis in the amol range. J. Am. Soc. Mass Spectrom. 24, 701–710 [DOI] [PubMed] [Google Scholar]
- 22. Kuzmic P. (1996) Program DYNAFIT for the analysis of enzyme kinetic data: application to HIV proteinase. Anal. Biochem. 237, 260–273 [DOI] [PubMed] [Google Scholar]
- 23. Sohl C. D., Guengerich F. P. (2010) Kinetic analysis of the three-step steroid aromatase reaction of human cytochrome P450 19A1. J. Biol. Chem. 285, 17734–17743 [DOI] [PMC free article] [PubMed] [Google Scholar]
- 24. Obianyo O., Osborne T. C., Thompson P. R. (2008) Kinetic mechanism of protein arginine methyltransferase 1. Biochemistry 47, 10420–10427 [DOI] [PMC free article] [PubMed] [Google Scholar]
- 25. Pu D., Cassady C. J. (2008) Negative ion dissociation of peptides containing hydroxyl side chains. Rapid Commun. Mass Spectrom. 22, 91–100 [DOI] [PubMed] [Google Scholar]
- 26. Reid G. E., Simpson R. J., O'Hair R. A. (2000) Leaving group and gas phase neighboring group effects in the side chain losses from protonated serine and its derivatives. J. Am. Soc. Mass Spectrom. 11, 1047–1060 [DOI] [PubMed] [Google Scholar]
- 27. Miranda T. B., Cortez C. C., Yoo C. B., Liang G., Abe M., Kelly T. K., Marquez V. E., Jones P. A. (2009) DZNep is a global histone methylation inhibitor that reactivates developmental genes not silenced by DNA methylation. Mol. Cancer Ther. 8, 1579–1588 [DOI] [PMC free article] [PubMed] [Google Scholar]


