Abstract
In this work, we report a system-level integration of portable microscopy and microfluidics for the realization of optofluidic imaging flow analyzer with a throughput of 450 cells/s. With the use of a cellphone augmented with off-the-shelf optical components and custom designed microfluidics, we demonstrate a portable optofluidic imaging flow analyzer. A multiple microfluidic channel geometry was employed to demonstrate the enhancement of throughput in the context of low frame-rate imaging systems. Using the cell-phone based digital imaging flow analyzer, we have imaged yeast cells present in a suspension. By digitally processing the recorded videos of the flow stream on the cellphone, we demonstrated an automated cell viability assessment of the yeast cell population. In addition, we also demonstrate the suitability of the system for blood cell counting.
I. INTRODUCTION
Cell viability assessment is an important technique used in fields related to cell-based research.1–3 Viability testing is performed to assess the live/dead condition of cells present in a given population and infer cell survival rate as a result of cytotoxicity, measure cell morbidity in apoptosis, potential of bacteria to survive an environmental shock, etc. Morphological changes or changes in membrane permeability are used to asses the viability of cells.4–6 Viability assays can be loosely classified into two types: analysis of whole population and analysis of individual cells in a given population. Assessment of viability on a single cell level provides a more detailed result, when compared to bulk measurements carried out on the whole population.5
The membrane permeability and/or physiological state is inferred by assessment of exclusion of certain types of dyes or uptake and retention of other types of dyes. One of the widely used viability assessment techniques is the trypan blue dye exclusion test. It is based on the principle that live cells with an intact plasma membrane exclude trypan blue, whereas non-viable cells take up trypan blue as their cell membrane is not intact and hence unable to control the passage of macromolecules through the cell membrane.
In general, optical detection techniques: flow cytometry and microscopy are employed to asses the dye exclusion or retention in cells and thereby infer their viability.1 Both flow cytometry and microscopy are gold-standard techniques employed in medical diagnostics as well as basic biological research. Flow cytometry enables automated high-speed quantitative multi-parameter analysis of large population of cells. The essential hardware like lasers and multiple detectors and the conventional fluid handling system render flow cytometry systems bulky and expensive.7 Over the past few years, there have been several efforts to demonstrate compact optofluidic flow cytometers.8 In contrast to flow cytometry, microscopy has a simpler architecture and enables viability assessment of cells via examination of images of cells smeared on a slide. In addition, clinical microscopy is also used for the diagnosis of multitude of diseases. However, different attributes of microscopy: low-throughput, necessity for skilled personnel for sample handling and processing, manual examination and analysis for conducting the assay or test, and bulkiness of the setup make it impractical for usage at the point-of-care or in resource-poor/on-field settings.
Of late, there has been a growth of interest in developing portable microscopy systems so as to enable the use of microscopy in resource-poor or in field-settings. Different designs of field-portable microscopes have been reported in the literature. Most of these portable microscopy systems employ custom optics and consumer-grade imaging devices (like a digital camera or cellphone) to enable microscopic examination of slides.9–17 Despite their portability and efficiency, these systems inherit some of the previously mentioned limitations of microscopy: requirement of skilled personnel for sample handling and preparation, need for focus adjustments and manual scanning of the slide through multiple field of views to acquire images of larger number of cells on the smear/slide, etc.
On the other hand, there has been a recent trend of enhancing the throughput of conventional microscopy with the synergistic use of optics and microfluidics. These imaging systems are, in general, referred to as Imaging Flow Cytometry (IFC) systems.18–25 While IFC systems offer the advantages of both microscopy (acquisition of morphological features from images and high spatial resolution) and flow cytometry (automation, high sensitivity, and high-throughput),26 one of the major limitation is the requirement of using high speed cameras. Most of the reported IFC systems in the literature employed cameras with frame rates of few to several thousand frames per second. This makes the system not only bulky and expensive but also challenging for the realization of a portable device, which is relevant to resource-poor/field settings.
On the other hand, throughputs of imaging flow analyzers realized with the use of portable/inexpensive imaging devices (like cellphones) have mostly been limited by the low frame rates of acquisition. Several portable and integrated optofluidic imaging devices have been reported in the recent past. In the integrated optofluidic devices reported so far, two approaches have been predominantly employed to integrate the fluidic and the optical components of the system. The first approach involves chip level integration, wherein the optical and fluidic components are integrated into a single chip. In this approach, the images of cells flowing through the microfluidic channels are computationally recovered from the recorded shadow images. These devices have come to be known as optofluidic microscopes.27–30 The second approach employs integration at a system level, wherein the microfluidic devices/channels act as sample handling units through which cells are flown. As the cells pass through the microfluidic channel, they are imaged using an imaging device, which lies external to the sample handling unit.31–33 In some cases, these devices have been referred to as optofluidic imaging flow analyzers.31 The current work pertains to the case of system level integrated optofluidic devices.
In this paper, while employing the principles of imaging flow cytometry, we demonstrate a microfluidics based portable bright-field imaging system with the use of a cell-phone and low cost off-the shelf optical components. Further, with the use of a multiple microfluidic channel geometry, we demonstrate the enhancement of achievable imaging throughput in the context of imaging flow analyzers based on low-frame rate imaging devices. With the frame rate of acquisition, being only 30 frames per second (fps), we demonstrate a throughput of about 450 cells per second. Further, we demonstrate an important application of such a portable imaging system by performing a cell viability assay on a given population of yeast cells. The clinical relevance of the presented instrument has been demonstrated by imaging human red blood cells (RBCs) present in a suspension.
II. CELL-PHONE BASED PORTABLE DIGITAL MICROSCOPE
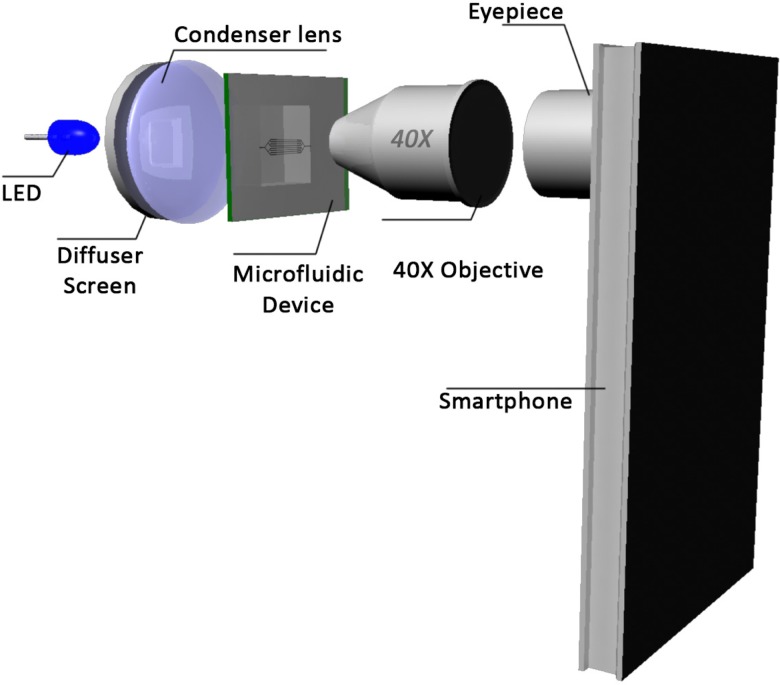
As mentioned earlier, there have been several demonstrations of portable microscopy systems. Most of the previously demonstrated systems predominantly fall into two distinct categories, they are lens-based9,10,13–16 and lens-free systems.11,12 In this work, we have adopted a lens-based system, wherein we have used an eye-piece (10×) and a objective (Lawrence & Mayo, 40×, N.A = 0.65) to turn a cellphone (Sony Xperia Z) into a microscope. A generic LED augmented with a ground glass diffuser (Thorlabs DG10600MD, Grit = 600, Diameter = 1 in) and an aspheric condenser lens (Thorlabs ACL2520, f = 20 mm, Diameter = 25 mm) have been used to provide a uniform illumination on the sample plane. The schematic of the imaging system is shown in Figure 1.
FIG. 1.
Schematic of the cellphone based portable microscope.
A. Characterization of the imaging system
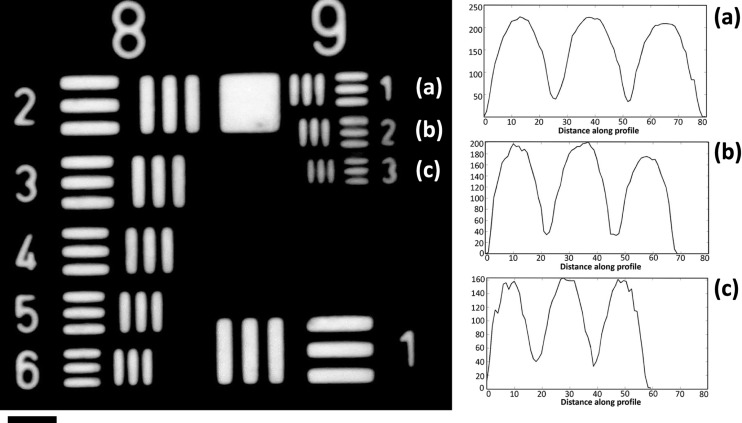
As per the Rayleigh criteria, the resolution of the imaging system can be predicted by the numerical aperture of condenser and objective. The theoretical resolution limit of the presented instrument was estimated to be about 535 nm. A 1951 USAF Negative resolution target (Edmund Optics 55‐622) has been used to characterize the imaging system. The system field of view was estimated to be about ∼180 μm in diameter. The system is easily able to resolve the smallest feature present on the target, which is a 0.78 μm feature (shown in Figure 2). The line profiles across the images of 1st, 2nd, and 3rd elements of the 9th group have been shown in Figure 2(c).
FIG. 2.
Imaging system characterization using USAF 1951 negative resolution target. (a)–(c) Images of 1st, 2nd, and 3rd elements of the 9th group and their corresponding line profiles. Length of scale bar is 5 μm.
III. INTEGRATED MICROFLUIDIC PORTABLE IMAGING SYSTEM
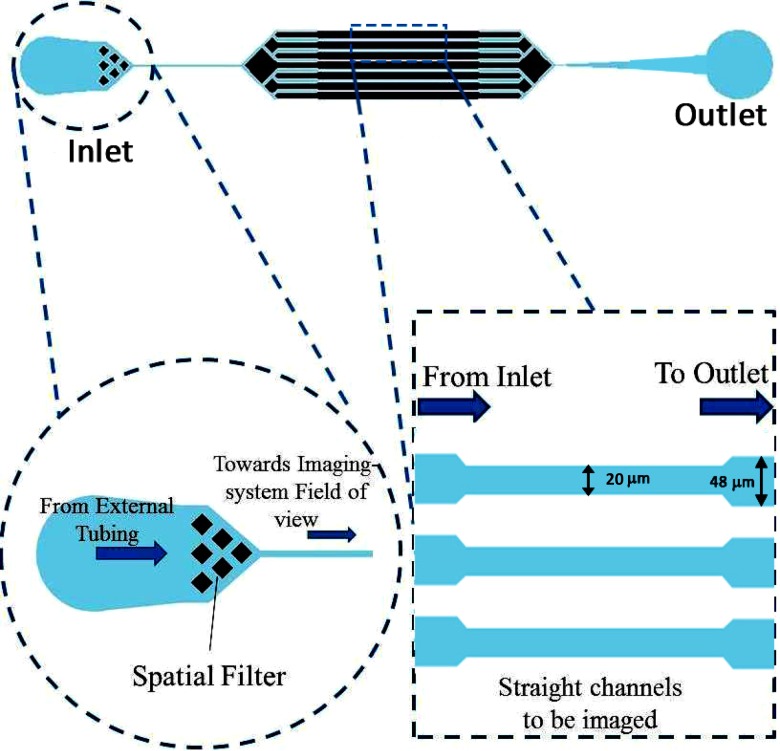
Custom-fabricated microfluidic devices were integrated into the portable microscope system so as to enable automated imaging as in the case of a typical IFC system. Conventional photo-lithography and soft-lithography34 techniques were used to fabricate microfluidic devices compatible with the compact digital microscope. In order to achieve a thickness close to 9 μm, the SU8‐2015 negative photoresist was spin coated at 6000 rpm for 30 s. The pre-baking was carried out at 95 °C for 3 min. Subsequently, the spin coated substrate was exposed to 130 mJ/cm2 of UV energy using a EVG620 automated mask aligner system. The post-baking was carried out at 95 °C for 4 min. Finally, the development of the wafer was carried out to remove the unwanted resist. The thickness of the patterned photoresist in the fabricated master was measured to be 9.8 μm using Dektak surface profiler. Replica molding of the photoresist master was carried out in PDMS by using Sylgard 184 and curing agent in 10:1 ratio, degassing them and curing overnight at 65 °C. After the curing step, the PDMS devices were cut, and holes were punched at inlet and outlet locations and bonded with cleaned glass cover slips (thickness = 0.13 mm) using oxygen plasma bonding. Each device had parallel channels with a width = 20 μm, depth = 9.8 μm, and an inter-channel spacing of about 60 μm. In order to avoid sudden reduction in channel width (from inlet), the initial portions of the channel had width of 48 μm, after which the channel width was reduced to 20 μm. At the inlet of the microfluidic device, a spatial filter was incorporated so as to filter out particles bigger than dimensions of the narrow portions of the channel to avoid clogging of the channels/device. The representative schematic of the microfluidic device is shown in Figure 3.
FIG. 3.
Design of the microfluidic device. Device consisted of straight channels which were 20 μm wide in the central portion of the device and 48 μm at other locations.
An attachment to the cell-phone, for housing the optics (LED, diffuser screen, condenser, and objective lens) and the replaceable microfluidic device (cartridge), was fabricated. The attachment consists of a slot (opening), so that inserting the microfluidic cartridge into this slot positions it at the sample plane of the imaging system. The positioning of the microfluidic device in the sample plane enables us to image the biological specimen flowing through the microfluidic channels of the device. The image of the fully integrated automated portable microscope is shown in Figure 4. The advantage offered by the presented system is the ease of multiple image acquisition of large number of cells. Multiple image acquisition in the case of slide based systems is a tedious process, which involves several readjustments of focus, magnification, and field of views. In the case of presented system, the process of sample handling and multiple image acquisition is fully automated. The fluid flow (in the microfluidic system) automatically transports the biological specimen from inlet to the field of view of the imaging system. The cellphone based portable system continuously images part of the microfluidic device at an appropriate magnification. The images of cells flowing across this region are captured in the form of a video by the cell-phone thus automating the process of multiple image acquisition.
FIG. 4.
Image of the integrated opto-fluidic imaging flow analyzer.
IV. SYSTEM CHARACTERIZATION IN FLOW
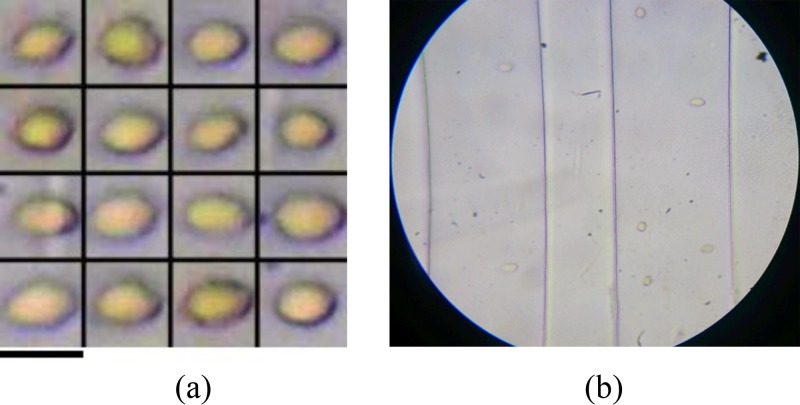
The achievable throughputs using the portable optofluidic imaging flow analyzer were investigated by imaging a suspension of RBCs in flow. The suspension was flown through the microfluidic device at a flow rate of about 20 μl h−1 using a syringe pump (NE 1000 New Era pump systems) and the videos of the flow stream were recorded. The videos of the flow stream were acquired with the use of “sports-mode” of the camera, so as to enable lowest possible exposure (thereby lowest possible motion blur) for a given illumination. Images of different cells were extracted from the videos using background subtraction and morphological image processing toolbox of MATLAB. Using the presented system, we have been able to achieve imaging throughputs of up to 3000 cells per minute. A frame extracted from the video recorded while RBCs are flowing through the microfluidic device has been shown in Fig. 5(b). The representative images of RBCs acquired using the portable imaging flow analyzer have been shown in Figure 5(a).
FIG. 5.
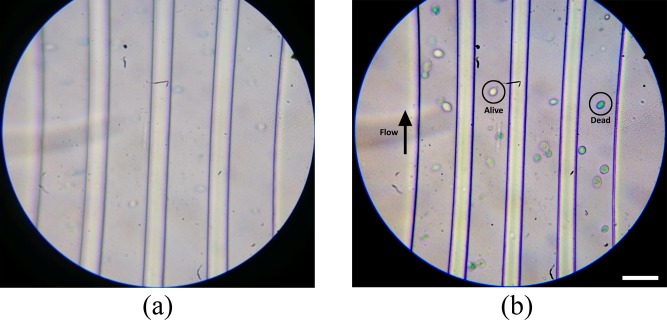
Higher flow rates can be used to ensure more particles in the field of view and thereby higher possible imaging throughputs. However, it was observed that further increase in flow rates resulted in loss of fidelity in the acquired images due to motion-blur. For a given exposure time, motion blur in the acquired images is dependent on the particle flow velocity (at the given flow rate). More particularly, the particle flow velocity depends on the volumetric flow rate in the channel (through which the particle is moving). In order to facilitate lower flow velocities (thereby lower motion blur), we have incorporated more number of the channels in the same field of view. An increase in the number of channels would result in distribution of fluid across more number of channels, which in turn gives rise to reduction in volumetric flow rate per channel, thereby reducing the motion blur. Further, an increase in the number of channels would have the effect of enhancing the system throughput by enabling imaging of more number of cells, flowing across multiple channels. In the current experiments, a multiple channel geometry with inter-channel spacing about 9.8 μm was employed. An image of the field of view of the imaging flow analyzer while imaging the device with closely spaced channels is shown in Figure 6(b). Using this multiple channel geometry and optimizing the concentration and pumping speeds for the given frame rate and exposure, the highest achievable throughput was investigated. Different flow rates between 10 μl h−1 and 40 μl h−1 were employed, wherein theoptimally high throughput of about 27 000 cells per minute was achieved at about 20–25 μlh−1. Although low frame-rate camera based portable optofluidic imaging systems have been reported earlier,31,35 the question of achievable throughputs and possible enhancement in the throughput has remained unanswered so far. With the use of a multiple parallel channel geometry, we have demonstrated the possibility of enhancing throughputs in such scenarios. Such an approach effectively leverages advantages of both low-frame rate imaging systems (like cellphones: portability) and custom microfluidics (throughput enhancement, automated sample handling). Further, other functionalities built into consumer-grade imaging devices can also be exploited. For example, the auto-focus feature built into cellphones can be used to bring the microfluidic channels into focus. In our experiments, the cellphone camera autofocuses: continuously varies the focus for initial few seconds of capture [see Figs. 5(b) and 6(a)] to determine the right focus, following which channels are brought into focus for subsequent acquisition, thereby eliminating the need for manual fine focus adjustments. A frame extracted from video after the autofocus is complete is shown in Fig. 6(b).
FIG. 6.
V. CELL VIABILITY ASSESSMENT OF YEAST CELLS
In order to demonstrate the relevance of the presented system to medical diagnostics and biological research in resource-poor/field settings, we have performed an automated cell viability assay of a given population of yeast cells. Yeast species Saccharomyces cerevisiae was cultured in YPD (yeast extract, peptone, and dextrose) (Himedia G037) liquid medium overnight at 37 °C in orbital shaking incubator. The cells were harvested after incubation by centrifuging at 500 g for about 10 min. Harvested cells were resuspended in distilled water. The yeast suspension of appropriate dilution was divided into two equal parts and one part of it was subjected to heating at 55 °C for 5 min to prepare dead cells. The dead cells were stained with 5% methylene blue for 10 min at room temperature and were separated by centrifuging at 500 g for 10 min and supernatant was discarded. The stained dead cells and the viable cells were mixed in distilled water. It is a known fact that only dead cells would take up and retain the methylene blue stain.36
The suspension of yeast cells was assessed using the portable optofluidic imaging flow analyzer system. The suspension was flown through the microfluidic device at a flow rate of about 20 μ lh−1 using a syringe pump (NE 1000 New Era pump systems) and the videos of the flow stream were recorded. A snapshot of the field of view (196 μm × 180 μm) while imaging the suspension of yeast cells is shown in Figure 6(b). As it can seen from the figure, viable cells (marked “alive”) are not stained, whereas the non-viable cells (marked “dead”) have taken up and retained the stain. In conventional methods, a smear of yeast cells has to be manually examined under the microscope and the number of stained and unstained cells has to counted to assess the population of cells. Manual microscopic examination is a tedious process and also qualitative in nature, in terms of assessing the status of a given cell; whereas, the current method is automated and quantitative in nature, even at the single cell level in terms of quantitative assessment of dye retention. By computationally assessing the color content of the image of a given cell, we determine its viability status. Since both the process of image acquisition and assessment of viability are automated, errors/variations due to subjective perception would be reduced to a minimum. Further, manual microscopic examination of a large population of cells is a time-taking process, whereas the presented imaging flow analyzer employs microfluidic sample handling to enable image acquisition of large number of cells within few minutes.
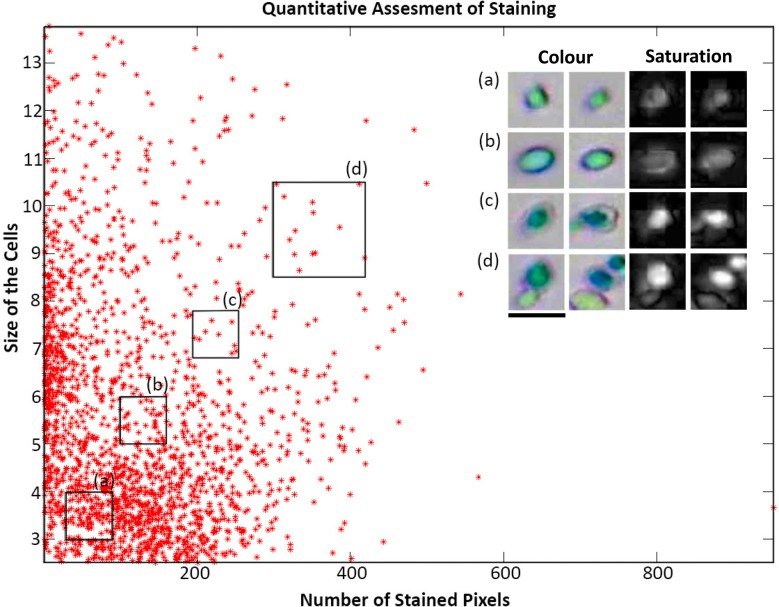
The frames of the video were extracted and processed using the background subtraction to extract the images of cells in MATLAB (R2013b, Mathworks, Inc.). Images of the cells extracted from videos were further processed to quantitatively assess the relative amount of dye retention/exclusion in a given cell. The saturation (color content) in a given image of cell was quantitatively assessed by counting the total number of pixels above the saturation level of the background (of the image). The saturation average level of the background was found to be 100 and was set as threshold for counting the number colored pixels. To get an insight into the distribution of the staining within the population, the histogram of total number of stained pixels for different images has been plotted (shown in Figure 7). The histogram corresponds to images of about 4006 cells, of which nearly half were found to be alive as evident from the peak in the histogram at the least stained (“viable”) cells. This observation is in agreement with the intuitive expectation that half of the cells would be dead, as only half of the suspension was subjected to heating.
FIG. 7.
Quantitative assessment of staining in the given yeast cell population. Color and saturation level images of cells corresponding to different gated regions of the histogram have been shown. Length of scale bar is 8 μm.
As it can be understood from the histogram, the cells present in the gated region (a) are very feebly stained and hence are viable, while the cells present in the other regions have retained the dye and thus are not viable. Automated assessment of dye exclusion or uptake and retention provides a quantitative insight into the stage of cell death over a large population of cells. The presented system would also enable multi-parametric analysis of cells for cell viability assessment. From the images of stained cells, two parameters were extracted, the size of cell and the dye retention. A scatter plot of dye retention capability as a function of cell size is shown in Figure 8.
FIG. 8.
Scatter plot of Size of cells versus the relative amount of dye retention. Length of scale bar is 8 μm.
For cytotoxicity studies, such an assessment would give an easy understanding of propensity of cell death when subjected to certain drug, with respect to its size or any other parameter. In the case of conventional and other non-microfluidics based imaging systems, it would be significantly difficult to acquire images of large population of cells and quantitatively asses their dye retention in an automated manner. On the other hand, conventional flow cytometry can also be used to perform cell-viability assays. In contrast to conventional flow cytometry, the presented system is based on imaging, thus enables extraction of additional morphological and spatial information, apart from being able to assess live-dead status. In addition, the platform is significantly cost-effective as compared to conventional flow cytometer.
VI. CONCLUSION AND FUTURE SCOPE
In this work, we have presented a cellphone based imaging flow analyzer for applications in basic biological research as well as clinical diagnostics in resource-poor settings. We have presented an investigation into achievable throughputs with microfluidics based system level integrated portable imaging systems, which employ inexpensive low frame-rate cameras (in our case 30 fps). Although the realized system is portable in comparison to conventional systems, it can be further compacted with the use of optofluidic lens systems.37 In addition, we have demonstrated an enhanced throughput of about 450 cells/s with the use of closely spaced multiple channel geometry. With the use of the presented system, we have performed an automated cell viability assessment of a given population of yeast cells. Cell viability assessment is an important technique used in cytotoxicity studies and other cell-based biological research.
The instrument along with the presented technique can be very easily extended for use in medical diagnostic applications. For example, by staining the nucleus of white blood cells (WBCs) and assessing the relative amount of nuclear content within different cells would enable differential blood count. Blood cell counting is the most commonly performed laboratory diagnostic test. Implementation of complete blood counting on such inexpensive and portable platforms can potentially enable rapid and quantitative diagnostics in resource-poor settings. Moreover, the design of our microfluidic cartridge can be improved upon to enable on-chip mixing of the stain/dye with the bio-sample.38 This would automate the process of sample preparation essential for performing variety of diagnostics and biological assays with the presented optofluidic imaging analyzer.
ACKNOWLEDGMENTS
The authors thank Rajesh Srinivasan for preparing suspensions of yeast cells for the experiments. The authors acknowledge funding from Space Technology Cell (ISRO-IISc), Biotechnology Ignition Grant (BIG) of BIRAC and Department of Electronics and Information Technology (DeitY). BIG team also acknowledges the support of incubation center, Robert-Bosch Center for Cyber-Physical Systems (RBCCPS), IISc and Centre for Cellular and Molecular Platforms (C-CAMP).
References
- 1.Kummrow A., Frankowski M., Bock N., Werner C., Dziekan T., and Neukammer J., Cytometry 83A, 197 (2013). 10.1002/cyto.a.22213 [DOI] [PubMed] [Google Scholar]
- 2.Lévesque A., Paquet A., and Pagé M., Cytometry 20, 181 (1995). 10.1002/cyto.990200211 [DOI] [PubMed] [Google Scholar]
- 3.Kaneshiro E. S., Wyder M. A., Wu Y.-P., and Cushion M. T., J. Microbiol. Methods 17, 1 (1993). 10.1016/S0167-7012(93)80010-4 [DOI] [Google Scholar]
- 4.Strober W., “ APPENDIX 3B trypan blue exclusion test of cell viability,” Curr. Protoc. Immunol. (published online 2001), pp. A.3B.1–A.3B.2 10.1002/0471142735.ima03bs21 [DOI] [PubMed] [Google Scholar]
- 5.Stoddart M. J., Methods Mol. Biol. 740, 1 (2011). 10.1007/978-1-61779-108-6_1 [DOI] [PubMed] [Google Scholar]
- 6.Johnson S., Nguyen V., and Coder D., Current Protocols in Cytometry ( Wiley Online Library, 2013), Chap. 9, Unit 9.2. [DOI] [PubMed] [Google Scholar]
- 7.L. A. S. R. P. o. P. U. o. N. Mexico, Flow Cytometry for Biotechnology ( Oxford University Press, 2005). [Google Scholar]
- 8.Cho S. H., Godin J. M., Chen C.-H., Qiao W., Lee H., and Lo Y.-H., Biomicrofluidics 4, 43001 (2010). 10.1063/1.3511706 [DOI] [PMC free article] [PubMed] [Google Scholar]
- 9.Breslauer D. N., Maamari R. N., Switz N. A., Lam W. A., and Fletcher D. A., PLoS One 4, e6320 (2009). 10.1371/journal.pone.0006320 [DOI] [PMC free article] [PubMed] [Google Scholar]
- 10.Skandarajah A., Reber C. D., Switz N. A., and Fletcher D. A., PLoS One 9, e96906 (2014). 10.1371/journal.pone.0096906 [DOI] [PMC free article] [PubMed] [Google Scholar]
- 11.Lee S. A. and Yang C., Lab Chip 14, 3056 (2014). 10.1039/C4LC00523F [DOI] [PMC free article] [PubMed] [Google Scholar]
- 12.Lee M., Yaglidere O., and Ozcan A., Biomed. Opt. Express 2, 2721 (2011). 10.1364/BOE.2.002721 [DOI] [PMC free article] [PubMed] [Google Scholar]
- 13.Cybulski J. S., Clements J., and Prakash M., PLoS One 9, e98781 (2014). 10.1371/journal.pone.0098781 [DOI] [PMC free article] [PubMed] [Google Scholar]
- 14.Smith Z. J., Chu K., Espenson A. R., Rahimzadeh M., Gryshuk A., Molinaro M., Dwyre D. M., Lane S., Matthews D., and Wachsmann-Hogiu S., PLoS One 6, e17150 (2011). 10.1371/journal.pone.0017150 [DOI] [PMC free article] [PubMed] [Google Scholar]
- 15.Arpa A., Wetzstein G., Lanman D., and Raskar R., in 2012 IEEE Computer Society Conference on Computer Vision and Pattern Recognition Workshops (CVPRW) (2012), pp. 23–28. [Google Scholar]
- 16.Schaefer S., Boehm S. A., and Chau K. J., Appl. Opt. 51, 2581 (2012). 10.1364/AO.51.002581 [DOI] [PubMed] [Google Scholar]
- 17.Shin D., Pierce M. C., Gillenwater A. M., Williams M. D., and Richards-Kortum R. R., PLoS One 5, e11218 (2010). 10.1371/journal.pone.0011218 [DOI] [PMC free article] [PubMed] [Google Scholar]
- 18.Goda K., Ayazi A., Gossett D. R., Sadasivam J., Lonappan C. K., Sollier E., Fard A. M., Hur S. C., Adam J., Murray C., Wang C., Brackbill N., Carlo D. D., and Jalali B., Proc. Natl. Acad. Sci. U.S.A. 109, 11630 (2012). 10.1073/pnas.1204718109 [DOI] [PMC free article] [PubMed] [Google Scholar]
- 19.Schonbrun E., Gorthi S. S., and Schaak D., Lab Chip 12, 268 (2012). 10.1039/C1LC20843H [DOI] [PubMed] [Google Scholar]
- 20.Pégard N. C. and Fleischer J. W., J. Biomed. Opt. 18, 040503 (2013). 10.1117/1.JBO.18.4.040503 [DOI] [PubMed] [Google Scholar]
- 21.Wu J., Li J., and Chan R. K. Y., Opt. Express 21, 14474 (2013). 10.1364/OE.21.014474 [DOI] [PubMed] [Google Scholar]
- 22.Schonbrun E., Di Caprio G., and Schaak D., Opt. Express 21, 8793 (2013). 10.1364/OE.21.008793 [DOI] [PubMed] [Google Scholar]
- 23.Gorthi S. S. and Schonbrun E., Opt. Lett. 37, 707 (2012). 10.1364/OL.37.000707 [DOI] [PubMed] [Google Scholar]
- 24.Gorthi S. S., Schaak D., and Schonbrun E., Opt. Express 21, 5164 (2013). 10.1364/OE.21.005164 [DOI] [PubMed] [Google Scholar]
- 25.Wu J. and Chan R. K. Y., Opt. Express 21, 23921 (2013). 10.1364/OE.21.023921 [DOI] [PubMed] [Google Scholar]
- 26.Basiji D. A., Ortyn W. E., Liang L., Venkatachalam V., and Morrissey P., Clin. Lab. Med. 27, 653 (2007). 10.1016/j.cll.2007.05.008 [DOI] [PMC free article] [PubMed] [Google Scholar]
- 27.Zheng G., Lee S. A., Yang S., and Yang C., Lab Chip 10, 3125 (2010). 10.1039/c0lc00213e [DOI] [PubMed] [Google Scholar]
- 28.Cui X., Lee L. M., Heng X., Zhong W., Sternberg P. W., Psaltis D., and Yang C., Proc. Natl. Acad. Sci. U.S.A. 105, 10670 (2008). 10.1073/pnas.0804612105 [DOI] [PMC free article] [PubMed] [Google Scholar]
- 29.Pang S., Cui X., DeModena J., Wang Y. M., Sternberg P., and Yang C., Lab Chip 10, 411 (2010). 10.1039/b919004j [DOI] [PMC free article] [PubMed] [Google Scholar]
- 30.Lee S. A., Leitao R., Zheng G., Yang S., Rodriguez A., and Yang C., PLoS One 6, e26127 (2011). 10.1371/journal.pone.0026127 [DOI] [PMC free article] [PubMed] [Google Scholar]
- 31.Zhu H., Mavandadi S., Coskun A. F., Yaglidere O., and Ozcan A., Anal. Chem. 83, 6641 (2011). 10.1021/ac201587a [DOI] [PMC free article] [PubMed] [Google Scholar]
- 32.Bishara W., Zhu H., and Ozcan A., Opt. Express 18, 27499 (2010). 10.1364/OE.18.027499 [DOI] [PMC free article] [PubMed] [Google Scholar]
- 33.Shin D., Daneshpanah M., Anand A., and Javidi B., Opt. Lett. 35, 4066 (2010). 10.1364/OL.35.004066 [DOI] [PubMed] [Google Scholar]
- 34.Xia Y. and Whitesides G. M., Annu. Rev. Mater. Sci. 28, 153 (1998). 10.1146/annurev.matsci.28.1.153 [DOI] [Google Scholar]
- 35.Zhu H. and Ozcan A., J. Visualized Exp. 74, e50451 (2013). 10.3791/50451 [DOI] [PMC free article] [PubMed] [Google Scholar]
- 36.Bonora A. and Mares D., Curr. Microbiol. 7, 217 (1982). 10.1007/BF01568802 [DOI] [Google Scholar]
- 37.Nguyen N.-T., Biomicrofluidics 4, 031501 (2010). 10.1063/1.3460392 [DOI] [PMC free article] [PubMed] [Google Scholar]
- 38.Tan A. P., Dudani J. S., Arshi A., Lee R. J., Tse H. T. K., Gossett D. R., and Carlo D. D., Lab Chip 14, 522 (2014). 10.1039/C3LC50870F [DOI] [PubMed] [Google Scholar]


