Abstract
Understanding how drugs are distributed in perilymph following local applications is important as local drug therapies are increasingly used to treat disorders of the inner ear. The potential contribution of cerebrospinal fluid (CSF) entry to perilymph homeostasis has been controversial for over half a century, largely due to artifactual contamination of collected perilymph samples with CSF. Measures of perilymph flow and of drug distribution following round window niche applications have both suggested a slow, apically directed flow occurs along scala tympani (ST) in the normal, sealed cochlea. In the present study, we have used fluorescein isothiocyanate-dextran as a marker to study perilymph kinetics in guinea pigs. Dextran is lost from perilymph more slowly than other substances so far quantified. Dextran solutions were injected from pipettes sealed into the lateral semicircular canal (SCC), the cochlear apex, or the basal turn of ST. After varying delays, sequential perilymph samples were taken from the cochlear apex or lateral SCC, allowing dextran distribution along the perilymphatic spaces to be quantified. Variability was low and findings were consistent with the injection procedure driving volume flow towards the cochlear aqueduct, and with volume flow during perilymph sampling driven by CSF entry at the aqueduct. The decline of dextran with time in the period between injection and sampling was consistent with both a slow volume influx of CSF (∼30 nL/min) entering the basal turn of ST at the cochlear aqueduct and a CSF-perilymph exchange driven by pressure-driven fluid oscillation across the cochlear aqueduct. Sample data also allowed contributions of other processes, such as communications with adjacent compartments, to be quantified. The study demonstrates that drug kinetics in the basal turn of ST is complex and is influenced by a considerable number of interacting processes.
Keywords: cochlea, blood-labyrinth barrier, perilymph pharmacokinetics, round window
Introduction
Although the inner ear fluid spaces are small in volume, they are arranged as tubes with lengths substantially longer than their widths, and in contact with highly vascular tissues. The fluids along these spaces are largely unstirred, so that applied substances typically do not distribute uniformly throughout them. Rather, they spread slowly along the narrow tubes driven by passive diffusion, slow longitudinal fluid movements, and also influenced by distribution to adjacent compartments and elimination to blood.
The role of the cochlear aqueduct and the contribution of cerebrospinal fluid (CSF) entry to perilymph homeostasis have been controversial topics for many years. While markers injected into CSF entered the cochlea (Altmann and Waltner 1947, 1950; Gisselsson 1949), fluorescent marker injected into the perilymph was also found to enter the CSF (Kaupp and Giebel 1980). In reality, the communication rate between perilymph and CSF under physiologic conditions cannot be derived from studies that utilized injections of relatively large volumes of marker due to the induced mechanical disturbances. Surgical occlusion of the cochlear aqueduct did not induce pathological changes in the cochlea (Kimura et al. 1974), suggesting communication with CSF did not play a critical role in perilymph homeostasis. Although perilymph sampling studies showed CSF and scala tympani (ST) perilymph had similar transfer kinetics with blood for some substances (Ferrary et al. 1987), interpretation of the studies was made uncertain by a demonstrated contamination of perilymph samples aspirated from the basal turn of ST with CSF (Hara et al. 1989; Salt et al. 2003). The rate of perilymph flow along ST in the intact, sealed cochlea was quantified with markers measured in real time with ion-selective electrodes (Ohyama et al. 1988). These measurements suggested a slow, apically directed flow of 1.6 nL/min. The longitudinal flow rate was dramatically increased to over 1 μL/min when the cochlea was perforated apically to the site of flow measurement (Ohyama et al. 1988). From these studies, it was concluded that CSF entry into the cochlea had little influence on perilymph in the normal, sealed condition but could dramatically affect perilymph when the cochlea was perforated, as typically occurs during sampling. The development of the procedure for sequential sampling from the cochlear apex (Mynatt et al. 2006) overcame the contamination problems associated with sampling from the basal turn and permitted drug gradients along ST to be quantified. In three studies in which separate substances were applied to the round window (RW) niche (tetramethylammonium marker, dexamethasone, and gentamicin), it was found that the drugs distributed apically along ST faster than could be accounted for by diffusion alone (Mynatt et al. 2006; Plontke et al. 2007, 2008). To account for the measured drug gradients, each of the studies needed to incorporate an apically directed perilymph flow, at rates of 19, 9, and 21 nL/min, respectively. The accuracy of these estimates was influenced, however, by the variable amounts of drug entering ST with RW niche applications and the contributions of other processes simultaneously influencing distribution, such as distribution into adjacent fluid and tissue compartments and elimination to blood. The use of dextran as a marker simplifies interpretation as analysis of the data presented here shows that elimination to blood is lower than for substances previously studied. In addition, the use of direct injections into perilymph greatly reduces variability between experiments, allowing both the amount and the distribution of the applied substance to be better controlled than with applications to the RW niche. The goal of the study was to establish how dextran becomes distributed in the ear during and following injection, how the dextran distribution changes over time, and what underlying mechanisms dominated these changes.
Materials and Methods
Animals
The study used 37 pigmented, NIH-strain guinea pigs of both sexes weighing 400–600 g, bred in our own colony. Experiments were conducted in accordance with policies of the United States Department of Agriculture, the National Institutes of Health guidelines for the handling and use of laboratory animals, and under protocols 20100135 and 20130069 approved by the Animal Care Committee of Washington University.
Animals were anesthetized with 100 mg/kg sodium thiobutabarbital (Inactin, Sigma, St Louis, MO) and maintained on 0.8 to 1.2 % isoflurane in oxygen with mechanical ventilation through a tracheal cannula. Tidal volume was adjusted to maintain a 5 % end-tidal CO2 level, monitored with a CapnoTrue AMP (Bluepoint Medical, The Netherlands). Heart rate and blood oxygen saturation were monitored with a pulse oximeter (Surgivet, Waukesha, WI). Body temperature was maintained at 38 °C with a DC-powered thermistor-controlled heating blanket.
Experimental Conditions and Surgical Approach
Ten different injection and sampling protocols were used for the study, as summarized in Table 1. Groups are identified by a letter (A–J) and an acronym of the injection–sampling condition (last column). Each experiment involved a single injection of fluorescein isothiocyanate (FITC)-dextran-containing solution from a pipette sealed into a specific location in the ear (the lateral semicircular canal (SCC), cochlear apex, or the basal turn of ST) followed by sequential sampling of fluids from either the lateral SCC or the cochlear apex. Sampling from the lateral SCC was used to assess the entire perilymph space while sampling from the apex allowed the dextran distribution along ST to be quantified in greater detail than with lateral SCC sampling.
TABLE 1.
Experimental conditions for dextran kinetic measurements
| Expt | No. | Injection location | Injection rate (μL/min) | Injection duration (min) | Delay before Sampling (min) | Sampling location | Manipulation | Abbreviated as |
|---|---|---|---|---|---|---|---|---|
| A | 3 | Lateral SCC | 1 | 60 | 0 | Lateral SCC | LC60-0LC | |
| B | 3 | Lateral SCC | 1 | 60 | 120 | Lateral SCC | LC60-120LC | |
| C | 3 | Lateral SCC | 1 | 60 | 0 | Cochlear apex | LC60-0AP | |
| D | 3 | Lateral SCC | 1 | 60 | 120 | Cochlear apex | LC60-120AP | |
| E | 3 | Cochlear apex | 0.4 | 120 | 0 | Lateral SCC | AP120-0LC | |
| F | 3 | Cochlear apex | 0.4 | 60 | 120 | Cochlear apex | AP60-120AP | |
| G | 3 | ST basal | 0.4 | 60 | 0 | Lateral SCC | ST60-0LC | |
| H | 5 | ST basal | 0.4 | 7.5 | 40 | Cochlear apex | ST7-40AP | |
| I | 3 | ST basal | 0.4 | 7.5 | 40 | Cochlear apex | Animal inverted | ST7-40APINV |
| J | 3 | ST basal | 0.4 | 7.5 | 40 | Cochlear apex | RW obstructed | ST7-40APRWO |
For those experiments where both injection and sampling occurred at the LSCC, access to the lateral semicircular canal (LSCC) was obtained with a post-auricular incision and a lateral opening in the auditory bulla. To prepare the LSCC for injection and sampling, the bone over the canal was thinned with a dental burr and a branch of the facial nerve was removed where necessary in animals where it ran parallel to the LSCC. When the canal was visible through the thinned bone, the bone was dried and thin cyanoacrylate glue (Permabond 101; Permabond, Pottstown, PA) was applied followed by layers of two-part silicone adhesive (Kwik-Cast, World Precision Instruments, Sarasota, FL). The silicone was applied thinly over the canal but multiple layers were built up at the edges to form a hydrophobic cup. A 30–40-μm fenestration into the bony canal wall was made through the adhesives using a 30 ° House stapes pick (N1705 80, Bausch and Lomb Inc.). The conical shape of the pick prevented substantial entry of the tip into the canal, minimizing damage to the membranous endolymphatic system (Hirose et al. 2014).
For those experiments where either injection or sampling occurred in the cochlea, the inner ear was accessed by a ventral approach, opening the auditory bulla widely. Injection and sampling sites were prepared in an identical manner as described above for the LSCC. The mucosa covering the bone was first removed. For a fenestration site in the basal turn of ST, the bone was first thinned with a flap knife. Layers of cyanoacrylate adhesive and silicone were then applied to the dry bone before a fenestration was made with a pick. For injections into the LSCC, cochlear apex, or basal turn of ST, the injection pipette was inserted into the prepared fenestration, a tissue wick used to remove the bolus of fluid accumulating on the hydrophobic surface, and a droplet of cyanoacrylate glue applied to seal the junction. Following this procedure, there was no subsequent fluid leakage at the injection site.
Injection of Solutions
FITC-labeled Dextran (FD4, Sigma, St Louis, FW 3000–5000) was added to an artificial perilymph containing (in mM) NaCl (125), KCl (3.5), NaHCO3 (25), CaCl2 (1.3), MgCl2 (1.2), NaH2PO4 (0.75), and dextrose (5). For experimental groups in which the injection was 60 min or longer (groups A–G), 1 mM FITC-dextran was included in the solution; otherwise (groups H–J), 2.5 mM FITC-dextran was included.
Solutions were injected from pipettes sealed into the ear, driven by a digitally controlled pump (Ultrapump, World Precision Instruments, Sarasota, FL) mounted on a manipulator. A 100-μL gas-tight syringe (1710TLL Hamilton) was mounted on the motor unit, coupled to a 1-mm diameter glass injection pipette with a plexiglass coupler (MPH6S10, World Precision Instruments, Sarasota, FL). The pipette had been pulled to a fine tip and was broken, not beveled, to a blunt tip diameter of 10–15 μm. The coupler was permanently sealed to the injection syringe with cyanoacrylate glue to ensure that no fluid leakage could occur at the junction. Injections were performed at a rate of 0.4 or 1 μL/min and for durations of 7.5 to 120 min for different groups as detailed in Table 1. All injections were performed from pipettes sealed into the ear, in which the cochlear aqueduct acted as the outlet for volume flow. Volume injections into the sealed ear at 1 μL/min are estimated to increase intracochlear pressure by about 2 mmHg, based on measured pressure increases that averaged 3.2 mmHg with injections at 1.5 μL/min into the sealed cochlea (Salt and DeMott 1998). In that study, the injections had negligible influence on the endocochlear potential. Very low frequency pressure changes in the ear are common and even respiratory movements cause fluctuations of ∼0.3 mmHg (Böhmer 1993). In some experiments, cochlear sensitivity changes were monitored during and after dextran injections using compound action potential (CAP) thresholds (see section on cochlear function measurements below).
Sequential Sampling
Fluids sampling was either performed at the LSCC or at the cochlear apex. In each case, at the time of sampling the bone was perforated, or the injection pipette was removed. The emerging fluid accumulated in the silicone cup, isolated from the surrounding tissues. Fluid was collected in hand-held, blunt tipped capillary tubes (VWR 53432-706) manufactured for 5 μL volumes but marked for a nominal 1 μL volume. Each sample took 40 to 60 s to collect. Immediately after collection, the exact volume was determined by measuring sample length in the capillary under a calibrated dissecting microscope. For lateral canal samples, 20 separate 1 μL samples were collected sequentially with time, which were later pooled in pairs for analysis giving 10 × 2 μL samples, 20 μL total. Total perilymph volume is approximately 15 μL in the guinea pig. For samples taken from the cochlear apex, 10 separate 1 μL samples, 10 μL total, were collected sequentially and each analyzed separately. ST perilymph volume is approximately 6 μL in the guinea pig. Therefore in both cases the fluid volume collected substantially exceeded the volume of the compartment under study, with later samples containing CSF that had passed through the cochlea.
Sample Handling and Analysis
Fluid samples from the ear and three samples collected from the injection pipette at the end of the experiment were diluted in 150 μL of artificial perilymph. Reference standards were made by performing five serial 10 X dilutions of the injected solution in artificial perilymph. Diluted fluid samples and equal volumes of standards were transferred to a 96-well plate and read in a Synergy HT plate reader. The Solver capability of Microsoft Excel was used to fit a sigmoid (Hill) function to the fluorescence vs concentration data from the standards which was used to transform fluorescence readings to concentrations. Perilymph concentrations were calculated based on the individual sample volume and the diluent volume. In most cases, measured sample concentration data were normalized with respect to the average measured injection concentration for that experiment. In some cases, such as for simulations, absolute concentrations are shown. Statistical significance was assessed using two-way ANOVA or t tests implemented in Sigmaplot v.14 software.
Simulations
Data were interpreted using a simulation model of the cochlear fluids that is available for download (for Mac or PC) from http://oto.wustl.edu/cochlea/. The model simulates physical processes driving solute movements (diffusion, volume flow, etc.) in up to 15 interconnected compartments representing the fluid and tissue spaces of the cochlea and vestibular systems of the guinea pig. Cross-sectional area vs distance is defined for each compartment derived from 3-D reconstructions of anatomic data. Communications with adjacent compartments and elimination to blood are represented as exchange processes with defined half-times. Simulated dextran applications used the applied concentration measured for the specific experiment or the average for the experimental group. By simulating the volume flows associated with injection and sampling procedures, including the specific volumes of each sample collected, the program was able to replicate a specific experimental protocol, predicting the 10 sample concentrations for sequentially taken samples for a given configuration of parameters. The program does not automatically fit parameters to a specific data set. One challenge of this project was to derive a limited set of model parameters that could account for the experimental data collected under all 10 experimental protocols. This was achieved by fitting each protocol in turn, varying parameters systematically while using the sum of squares of differences between the measured and calculated data sets, or of specific samples in a data set, as index of fit. Derived parameters across all the experimental conditions were averaged and the process repeated until parameters were established that fit all conditions. The process was time-consuming and we do not claim the parameters presented are the best possible fit. Rather, given the inter-animal variation, the parameters provide a reasonable summary of the processes occurring in the ear accounting for the measured results.
Cochlear Function Measurements
In some experiments, cochlear sensitivity during dextran and control injections into the LSCC was monitored using CAP thresholds. Potentials were measured from a Ag/AgCl ball electrode placed at the edge of the round window membrane. Sound stimuli were delivered through a hollow ear bar using an Etymotic ER-10C microphone/speaker system driven by Tucker-Davis System 3 hardware. Stimulus delivery and data acquisition were controlled by custom software. The sound field in each animal was calibrated and CAP responses elicited by 20 tone burst stimuli of both polarities were collected. Thresholds were established using a 10-μV amplitude criterion in an automated procedure that increased stimulus level in 5 dB steps until the response amplitude exceeded the criterion, then decreased it in 5 dB steps until the response was below the criterion. Threshold was established by interpolation between the above and below threshold amplitude values. Thresholds were monitored at four frequencies (16, 8, 4, and 2 kHz), at 2 min intervals for a 2-h period during and following the injection procedure. As the pharmacokinetic measurements could have been compromised by perilymph leaks caused by repeatedly removing fluid from the round window niche, no attempt was made to keep the niche dry, and the sensitivity changes in some animals included a component caused by fluid accumulation.
Results
-
(i)
Injection and sampling experiments
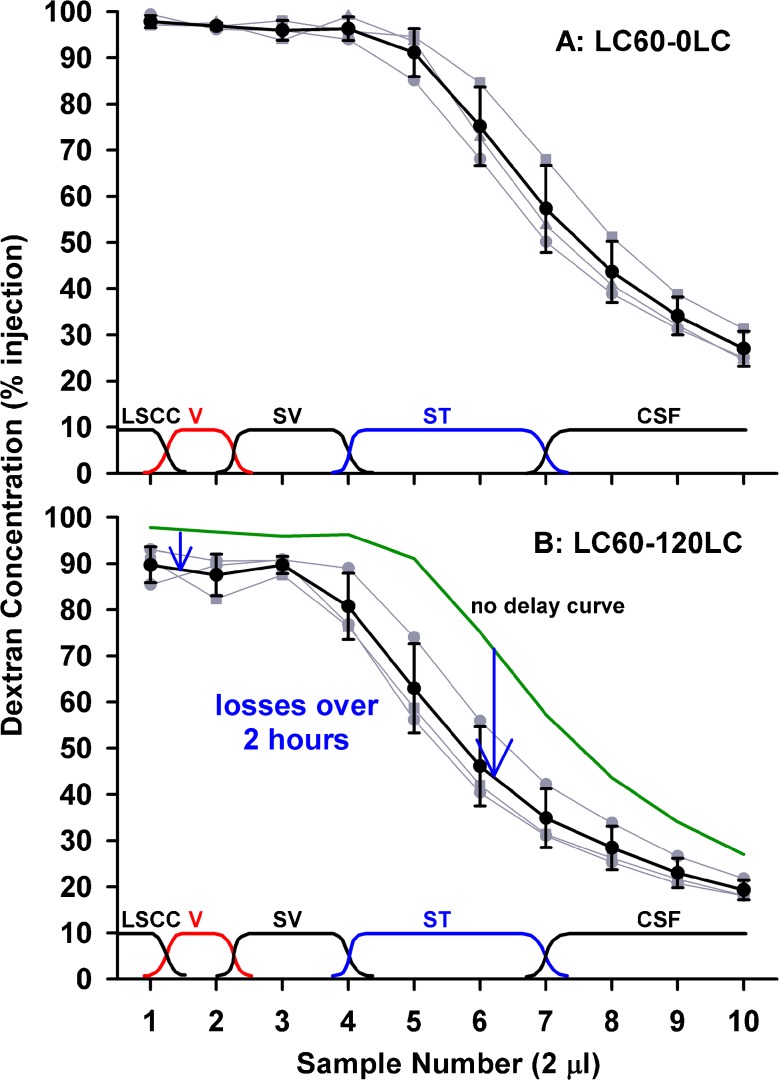
The injection of solution from a pipette sealed into the lateral SCC provides a reliable method to fill most of the perilymphatic spaces with fluid of well-defined composition. Figure 1 shows individual (gray) and mean (black) sequential perilymph sample curves following a 60-min dextran loading procedure, sampled with either no delay (Fig. 1, upper panel) or with 120 min delay between the end of injection and the start of sampling (Fig. 1, lower panel). Samples were nominally 2 μL in volume and the approximate spatial origins of the samples are shown near the bottom of each figure. Inter-animal variation with perilymphatic injections is notably less than with commonly used extracochlear delivery procedures, so that relatively few experiments were needed to define each time course. With sampling after no delay, initial samples (1–5), originating from the lateral SCC, the vestibule, and scala vestibuli, were close to the injected concentration, while later samples (6–7) originating from the middle and basal part of ST showed lower concentrations. Note that the sites of origin of the samples shown on the figures and being used here are derived from an analysis detailed later in the paper. The last samples (8–10) contained CSF that had passed through the perilymphatic space before collection. When samples were collected after a 120-min delay between injection and sampling, systematically lower curves were obtained but the reduction was not uniform. Initial samples (1–5) were 6–9 % lower but the greatest decline was seen at sample 6 which decreased by 29 % in the 2-h period. This suggested that the greatest decline of dextran with time primarily occurred at the mid or basal part of ST.
FIG. 1.
Dextran concentrations of 2 μL samples collected sequentially from the lateral SCC either immediately (upper panel) or 120 min after (lower panel) perilymph loading. Individual experiments are shown gray and mean ± standard deviation curves are shown black. Approximate sites of origin of the samples are indicated at the bottom of each plot. With no delay, initial samples were close to the injected concentration, but later samples declined as CSF entry increasingly contributed to the samples. With 120 min delay, initial samples were lower but samples 5–7 were markedly lower. These data are consistent with the greatest decline of dextran occurring at the cochlear apex or in scala tympani.
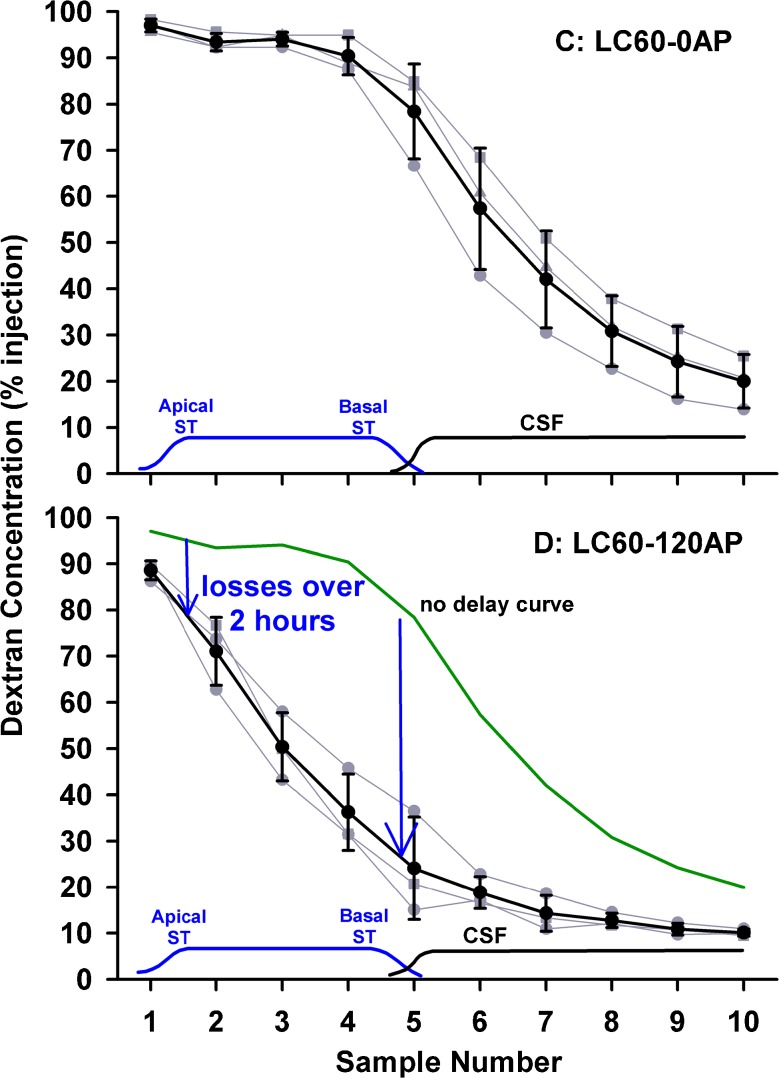
The decline of dextran within ST was examined in more detail by performing the same injection procedure followed by perilymph sampling from the cochlear apex. Under this protocol, samples were nominally 1 μL in volume, i.e., half the volume of samples collected from the lateral SCC. The sample curves for no delay and 120 min delay between injection and sampling are shown in the upper and lower panels of Figure 2, respectively. With no delay, samples 1–4 (i.e., throughout the length of ST) were close to the injected concentration, followed by a progressive decline representing CSF that had passed through the perilymphatic spaces. With a 2-h delay, apical samples, originating from perilymph at the apex, were only reduced 8 %, while samples 4 and 5, originating from the base of ST, were reduced by 54 %. These data confirm that processes occurring in the basal turn of ST dominate the decline in dextran concentration.
FIG. 2.
Dextran concentrations of 1 μL samples collected sequentially from the cochlear apex either immediately (upper panel) or 120 min after (lower panel) perilymph loading. Individual experiments are shown gray and mean ± standard deviation curves are shown black. The approximate origins of the samples are indicated at the bottom of each plot. With no delay, initial samples were close to the injected concentration, but later samples declined as CSF entry increasingly contributed to the samples. With 120 min delay, samples 4 and 5, originating from the basal part of scala tympani, were markedly lower. These data show that the greatest decline of dextran occurs in the basal part of scala tympani.
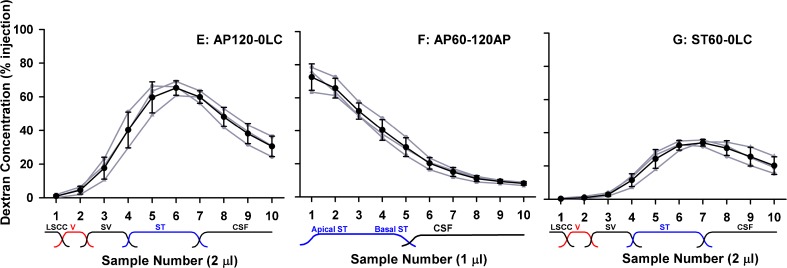
The possibility of local intercommunication between ST and scala vestibuli (SV) was evaluated in experiments in which only ST was loaded with marker by injections into the cochlear apex or into the basal turn of ST. The results of three experimental protocols are shown in Figure 3, including results from a prolonged injection into the cochlear apex followed by sampling from the lateral SCC, injection into the apex, followed by sampling from the apex, and injection into the basal turn of ST followed by lateral SCC sampling, respectively. The two conditions with lateral canal sampling show low concentrations in the initial samples, indicating that distribution from ST to SV and the vestibule (so-called perilymphatic cross-communication) is slow for dextran. Sampling from the apex (Fig. 3, middle) showed an almost identical result to sampling following lateral SCC injection (Fig. 2, lower), again supporting the view that communication between ST and SV for dextran was low.
FIG. 3.
Experimental conditions sensitive to local ST–SV communication. Individual experiments are shown gray and mean ± standard deviation curves are shown black. Left, injection into the cochlear apex for 120 min (loading only ST) followed by sampling from the lateral SCC. Middle, injection into the cochlear apex (loading only ST) followed by sampling from the apex after a 120-min delay. Right, injection into the basal turn of ST (loading only basal regions of ST) followed by sampling from the lateral SCC. Initial samples (1–2) with lateral SCC sampling (left, right) were low, suggesting very limited movement of dextran from ST to SV. Sampling from ST (middle) gave similar results to those when the entire perilymph was loaded (Fig. 2, lower), suggesting dextran losses from ST to the unfilled SV and vestibule were small.
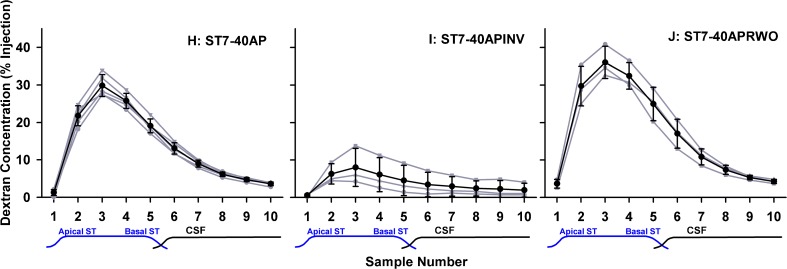
Injections into the basal turn of ST allowed the kinetics of this important region to be evaluated without the variability associated with RW permeability following intratympanic applications. When sampled from the apex 40 min after dextran injection, concentration was highest in the 3rd sample (Fig. 4, left), which differed from intratympanically applied substances where the maximum concentration typically occurred in the 4th or 5th sample (Mynatt et al. 2006; Plontke et al. 2007). This suggested that in the present experiments dextran was located more apically in ST compared to the lower basal region. While this difference was partly accounted for by the basal turn injection site being more apical than the round window, we were also concerned that the density of the dextran solution could play a part. We observed that when we injected 2.5 mM dextran solution into artificial perilymph solution in a beaker in vitro (both solutions at room temperature), the isotonic dextran solution sank considerably faster than did a sodium fluorescein solution. This demonstrated that the 2.5-mM dextran solution was substantially denser than artificial perilymph due to the mass (formula weight 3,000–5,000) of the macromolecules. The possibility therefore existed that the injected dextran solution could be influenced by gravity as it was injected. In the normal orientation (right, operated ear up), a sinking of the dextran solution would correspond to a displacement towards the apex. This effect was confirmed by performing identical ST injection and apical sampling experiments with the animal rotated 180 °, so that the operated ear was lowest. In this orientation, gravity caused the injected solution to fall basally towards the RW and cochlear aqueduct. Apical samples from these experiments were significantly lower (two-way ANOVA, Bonferroni, t statistic 16.35, df 109, P < 0.001), accounted for by a greater amount of the injected solution leaving the cochlea through the cochlear aqueduct (Fig. 4, middle).
FIG. 4.
Results of apical sampling following brief (7.5 min) injections into the basal turn of ST in three experimental conditions. Individual experiments are shown gray and mean ± standard deviation curves are shown black. Left, injection in “normal” orientation with right, operated ear uppermost. Middle, injection with animal rotated 180 °, with right, operated ear lowest. Right, injection with animal in normal orientation but with the round window covered with Tissumend cyanoacrylate adhesive. Both experimental conditions resulted in sample concentrations that were significantly different from the control condition (two-way ANOVA, Bonferroni, df 109, groups I vs H, t statistic 16.35, P < 0.001; groups J vs H, t statistic 6.37, P < 0.001), with 180 ° rotation resulting in significantly lower concentrations and round window occlusion resulting in significantly higher concentrations.
In the final protocol, dextran was injected into the basal turn of ST in ears in which the RW membrane had been occluded with Tissumend, a biologically compatible cyanoacrylate glue. Perilymph concentrations of dextran were significantly higher when the round window membrane was occluded with Tissumend compared to the non-occluded group (Fig. 4, right compared to Fig. 4, left) (two-way ANOVA, Bonferroni, t statistic 6.37, df 109, P < 0.001).
-
(ii)
Interpretation with computer simulations
The goal of the simulations was to establish the minimum set of physical processes that could account for the results from the 10 experimental conditions collected here. The processes needed to account not just for individual experimental conditions but to be incorporated into the simulations for all the experiments, fitting the entire data set with a single, limited set of variables. In the model, solute was always conserved (i.e., it was only moved between compartments and could not be lost or gained) and compartment volumes were assumed to be unchanging over the period of the experiments. In calculations, we used variables representing seven processes, summarized in Table 2, which some were not relevant to every experimental condition as detailed below.
TABLE 2.
Simulation variables used to fit all 10 dextran data sets
| Variables adjusted | Value | |
|---|---|---|
| 1 | CSF entry flow rate | 30 nL/min |
| 2 | Elimination half-time for scala vestibuli, the vestibule, and the semicircular canals | 230 min |
| 3 | Communication half-time from scala tympani to spaces of the spiral ligament, spiral ganglion, organ of Corti, and auditory nerve | 6 min |
| 4 | Communication half-time between spiral ligament and scala vestibuli | 120 min |
| 5 | Scala vestibuli + vestibule volume scaling | 77 % |
| 6 | Fluid volume oscillating across the cochlear aqueduct | 3 nL/s |
| 7 | Fall from scala tympani injection site due to solution density | 2.2 mm |
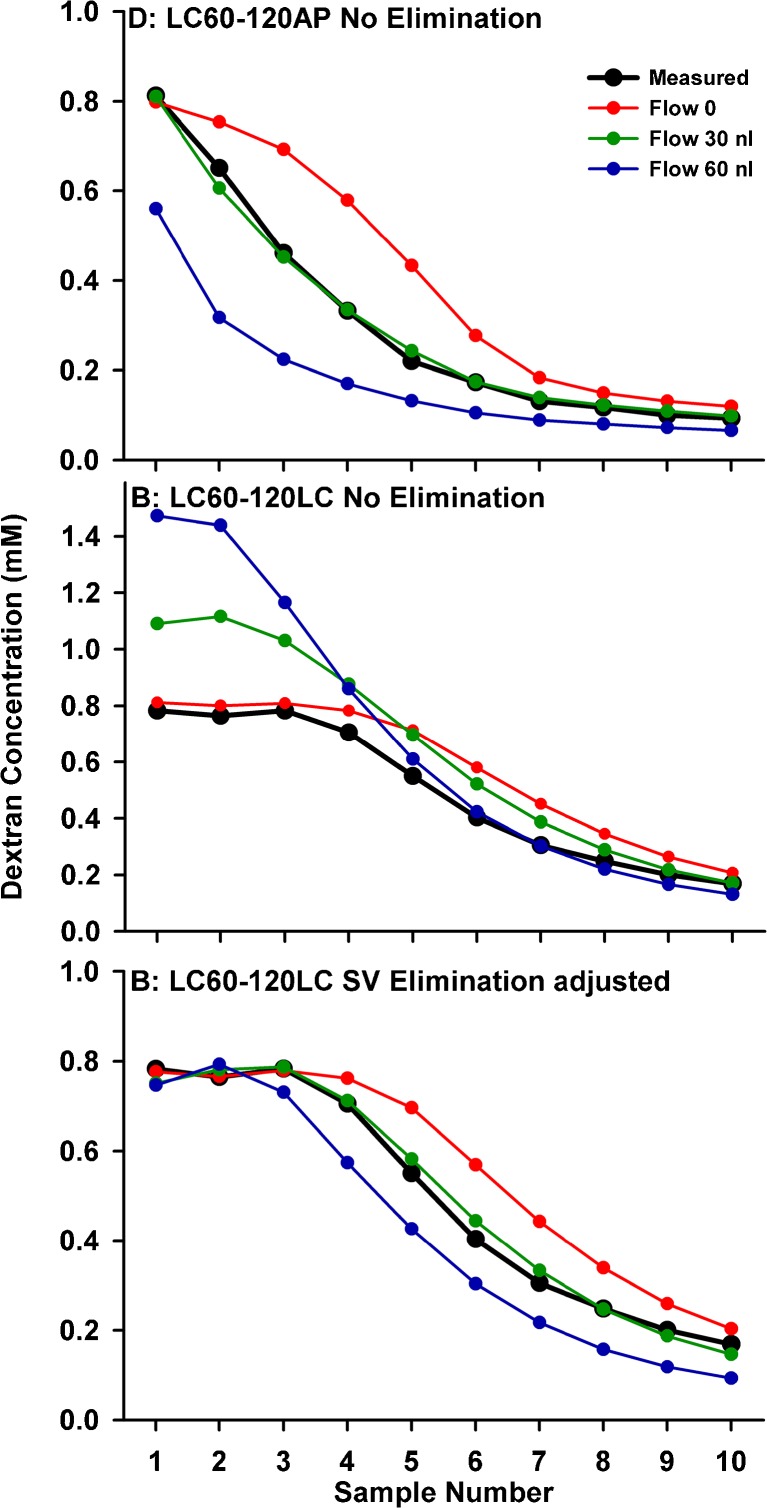
A major contributing factor to the decline of dextran concentration at the basal turn of ST was thought to be CSF entry at the cochlear aqueduct occurring in the delay period between the injection ending and sampling commencing. CSF entry drives fluid apically along ST and will also dilute the dextran concentration in the basal turn. The influence of flow is demonstrated by varying its rate for calculations of a specific experimental condition. Figure 5 (upper) shows simulations fitted to lateral SCC injected, apical sampled data (from Fig. 2) with the rate of CSF entry varied. The change in curve shape as flow was varied allows the inflow rate to be readily established from the data as being close to 30 nL/min. A much more difficult issue to deal with, however, is where this volume goes after it enters the ear, as constant volume has to be maintained. Anatomically, there is no outflow duct comparable to the cochlear aqueduct. In the simulation program, we incorporated numerous algorithms including losses of volume and solute in the vestibule or a loss of volume alone (with solute retained), but none could readily explain the experimental datasets. The algorithm we had most success with is one in which flow slows progressively in the upper part of ST and throughout SV and the vestibule. However, when volume is lost in a distributed, diffuse manner, it also impacts solute concentration. The middle panel of Figure 5 shows the predicted curves and measured samples for lateral SCC sample data (from Fig. 1, lower) for the three rates of flow. As flow rate increases, solute that is driven apically up ST and into SV would accumulate in the regions where volume is lost, thereby increasing concentration. As this is not apparent in the experimental measurements, both volume and solute must be both lost. The most flexible way to incorporate the solute loss was to include it as a separate, independent process, defined as a rate of elimination from SV and the vestibule, as shown in the lower panel of Figure 5. In these simulations, the rate of elimination was adjusted to balance the solute accumulation due to volume loss. The required elimination half-times were 2,000, 240, and 128 min for the flow rates of 0, 30, and 60 nL/min, respectively, to match the concentration amplitudes of the samples originating from SV and the vestibular perilymph.
FIG. 5.
Calculated influence of volume entry at the cochlear aqueduct causing dilution at the base and apical volume flow in scala tympani. Upper, samples from the apex. Measured (black) and calculated (colored) samples for three different flow rates. A rate of ∼30 nL/min best accounts for the measured curve of samples from the apex. Middle, samples from the LSCC. The influence of perilymph flow on LSCC samples is more complex as we need to consider where volume (and associated solute) is lost. Lateral SCC samples are first calculated for a distributed volume loss, with volume flow rate progressively declining through scala vestibuli and the vestibule. If volume was lost but solute was retained, solute concentration increases would be observed as seen here, becoming more pronounced with higher flow rates. Lower, the same distributed volume loss flow algorithm, now with elimination from scala vestibuli and the vestibule with half-times of 2,000, 240, and 128 min for flow rates of 0, 30, and 60 nL/min, respectively. The combination of a distributed volume loss and a distributed loss of solute can account for the measured curves.
In order to better-fit samples from the lateral SCC taken without delay (therefore unaffected by the influences of flow and elimination), we also had to incorporate another factor. In brief, the lateral SCC data were consistent with smaller SV and vestibule volumes than those built into the model, derived from fixed, processed tissues. This problem only affected samples from the lateral canal and not those from the cochlear apex. A better coincidence of model and experimental data were obtained when the SV and vestibule volumes were scaled to 77 % of those measured anatomically. This may be accounted for by position changes of Reissner’s membrane and vestibular membrane boundaries during fixation and processing of the specimens used for anatomic measurements. If the endolymph compartment shrinks in fixation and processing, in vivo volumes of SV and the vestibule would be overestimated.
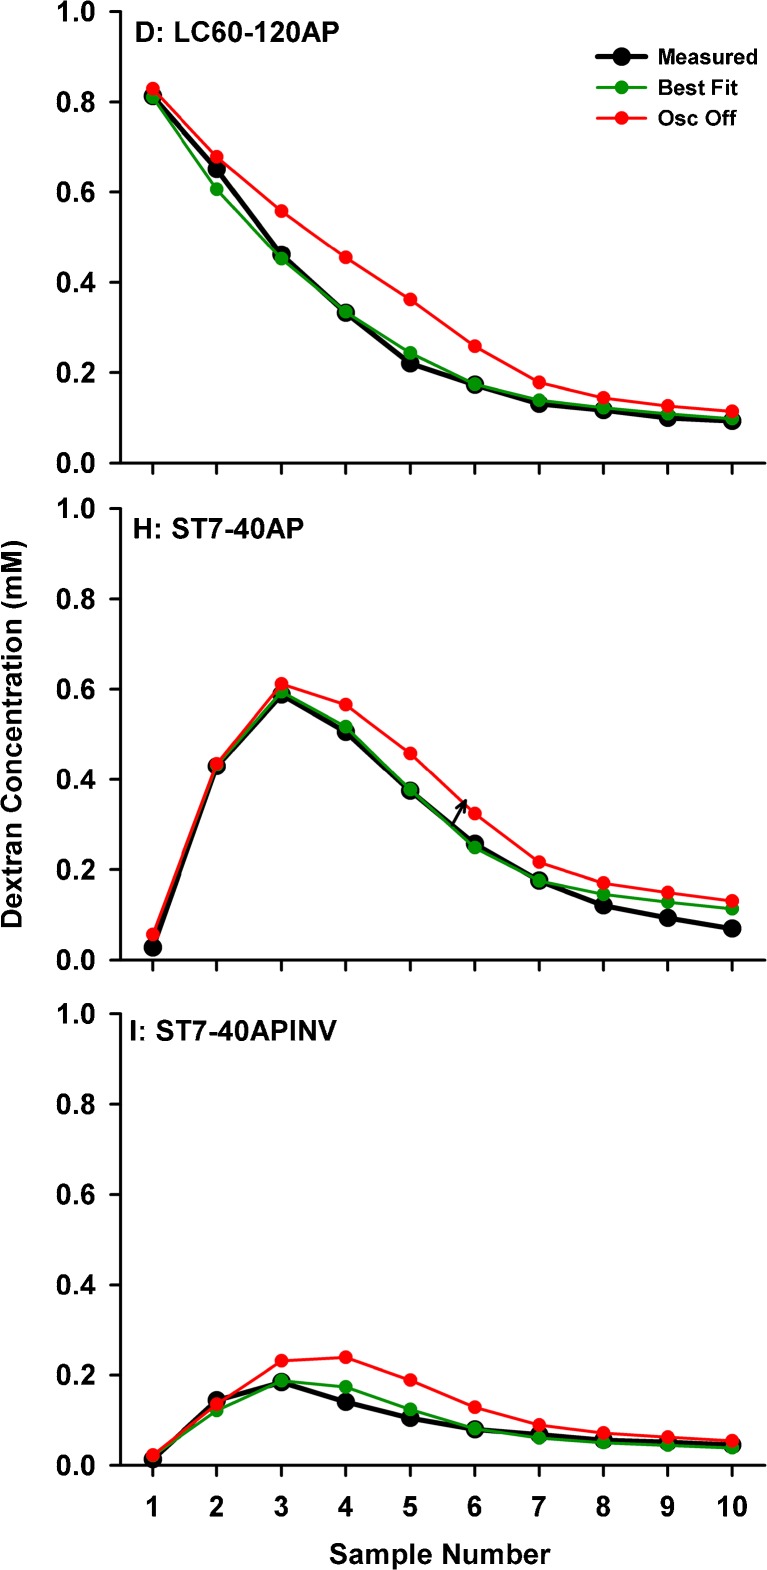
A further factor affecting dextran in the basal turn was revealed by experiments in which Tissumend glue was applied to the RW membrane, where significantly higher dextran levels were observed (Fig. 4, right). This finding was unexpected as in experiments with the RW unoccluded, the niche remained dry so it was not possible for a significant amount of dextran to have leaked to the middle ear through the RW membrane. An alternative explanation was that cyclical CSF pressure changes associated with heartbeat and respiration, in conjunction with the compliant RW membrane, could cause an oscillation, i.e., a reciprocating flow of fluid across the cochlear aqueduct. This oscillation would be reduced if the RW membrane was made non-compliant by the application of cyanoacrylate adhesive. An exchange between perilymph and CSF was incorporated into the simulations as a volume (in nL) exchanged between CSF and perilymph each second. Extremely small amounts of exchange were found to have substantial influence on concentrations in the basal region of ST. The influence of an exchange volume of 3 nL/s is shown for three experimental protocols in Figure 6. All other processes, including CSF volume entry at 30 nL/min, remain active. For a number of injection/sampling protocols, the effects of oscillation, resulting in a loss of solute from the basal region in addition to the dilution resulting from volume entry at the same site, are apparently considerable.
FIG. 6.
Influence of a CSF-perilymph exchange of 3 nL/s caused by pressure-induced oscillations on sample curves measured under four experimental conditions. Upper, apical samples following lateral canal application shows a worse curve shape when oscillation is disabled compared to best fit when oscillation is active. Middle, data and best fit curves for unobstructed (lower curve) and RW obstructed (upper curve) with companion curves for oscillation disabled or enabled, respectively. The later calculated samples are most affected by the manipulation. Lower, the animal-inverted data with and without effects of oscillation enabled. This experimental condition is highly sensitive to the effects of oscillation.
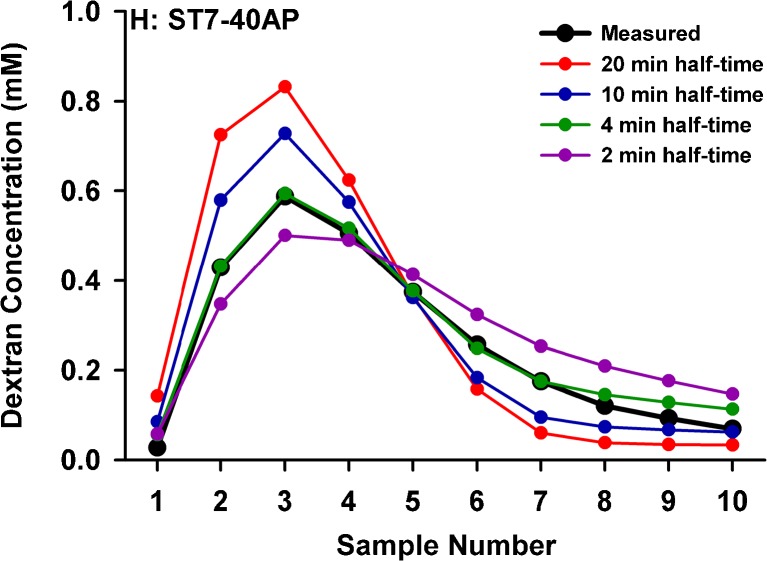
A fourth major factor in the interpretation of sample results was the degree to which ST perilymph communicated with adjacent tissue spaces. This is seen both as perilymph effectively having a larger volume when dextran was locally injected (when dextran is lost to adjacent compartments) and as contributing to the slow decline of sample concentration as CSF passed through ST (as dextran diffuses back from the adjacent compartments into ST driven by concentration gradients). Figure 7 shows simulations of the basal ST injection experiment (from Fig. 4, left) with the rate of communication with adjacent compartments systematically varied. With slow communication (long half-times), concentration of samples 1–4 (originating from perilymph) would be higher, as less is lost to adjacent compartments, but the concentration would fall very quickly as CSF contributed to the samples. With faster communication, more is lost from the scala, resulting in lower concentrations in samples 1–4, and a slower decline occurs in later samples as the dextran in adjacent compartments re-distributes into the CSF passing through the scala. The later samples (from the apex or from the lateral SCC) therefore provide an important measure of the communication between adjacent compartments and demonstrate that the cochlear fluid spaces cannot be considered in isolation.
FIG. 7.
Effect of varying exchange between scala tympani perilymph and adjacent compartments (spiral ligament, organ of Corti, spiral ganglion, and spaces of the auditory nerve) for the mean sample curve from the basal ST injected-apical sampled condition (from Fig. 4). Slow communication with adjacent compartments results in more dextran retained in the scala (higher samples 1–4) followed by a rapid decline to low levels in later samples. As exchange occurs faster, more dextran is lost from the scala and the time course of decline in later samples slows as the dextran in adjacent compartments re-distributes into CSF passing through the scala.
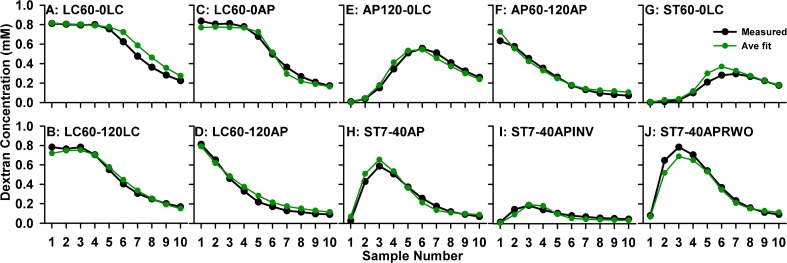
In a repeated exercise of systematically changing variables to improve fit and averaging parameters across experimental conditions, we converged on parameter values that best represented the measurements from the 10 experimental conditions studied. Numeric values for the seven parameters are given in Table 2 and the curves calculated with this parameter set for the 10 experimental protocols are shown in Figure 8. The discrepancies between measured and calculated curves are generally less than the inter-animal variation of the original data. What is most remarkable is the good correspondence between amplitude scaling of measured and calculated curves, shown here as absolute values rather than normalized relative to the injection concentration.
FIG. 8.
Mean sample concentration data from 10 experimental conditions simulated with a single set of parameters defining seven processes as detailed in Table 2. Note that absolute concentrations were calculated and no scaling factors were applied. With the specified parameters, these simulations provide a reasonable representation of dextran distribution in the ear under a variety of experimental conditions, validating the delivery, sampling and analysis procedures.
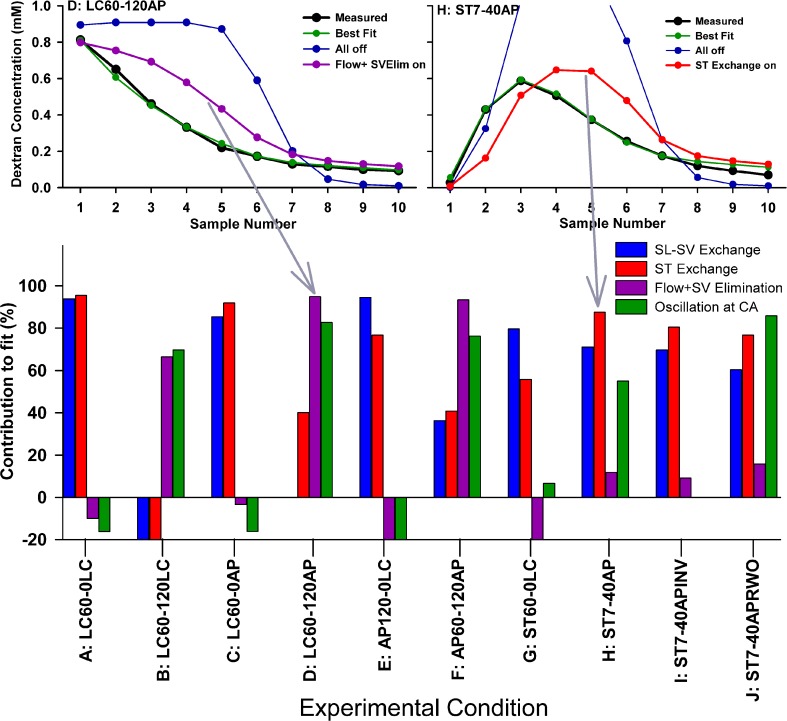
As a measure of which of the main variables of the simulations were most relevant to different experimental protocols, we calculated sample curves with all seven processes in the model disabled (leaving only dextran diffusion remaining), and then enabled each process singly in turn. How closely each resulting curve approached the best fit situation (with all processes enabled) was quantified as the sum of squares of deviations and used as an index of how each parameter contributed to the fit. Two example conditions and a summary of the parameter contributions are shown in Figure 9. In the example conditions, the blue curves show the calculated sample concentrations for diffusion alone and the red curves with specific processes enabled (flow for condition D and ST exchange for condition H). It is apparent that some parameters contribute strongly to the result for some protocols while others do not. For example, CSF entry rate (flow) and oscillation at the cochlear aqueduct are unimportant for the no delay experiments (conditions A and C) but contribute strongly to the fits after 120 min delay experiments (B, D, and F). This analysis gives a measure of which experimental conditions are most sensitive to each process and therefore which protocol is best suited to numerically quantify the specific process. Such an analysis provides a rational basis for which experimental conditions are most relevant to quantify the specific pharmacokinetic processes affecting dextran distribution. Similar considerations may be appropriate in the characterization of pharmacokinetic properties of any applied substance.
-
(iii)
Functional changes
FIG. 9.
Quantification of those parameters most relevant under different experimental conditions. Upper panels, example experimental conditions with calculated sample curves. Best fit is green; curve calculated with all parameters disabled (except diffusion) is blue; curve with a single process enabled is purple at left (Flow + SV elimination) and red at right (exchange between ST and adjacent compartments). Lower panel, calculated contribution of specific processes to how calculated curves fit the data. High numbers indicate the parameter makes a substantial contribution, negative numbers indicate a worse fit. Different experimental conditions vary in their sensitivity to the specific processes used in the simulations.
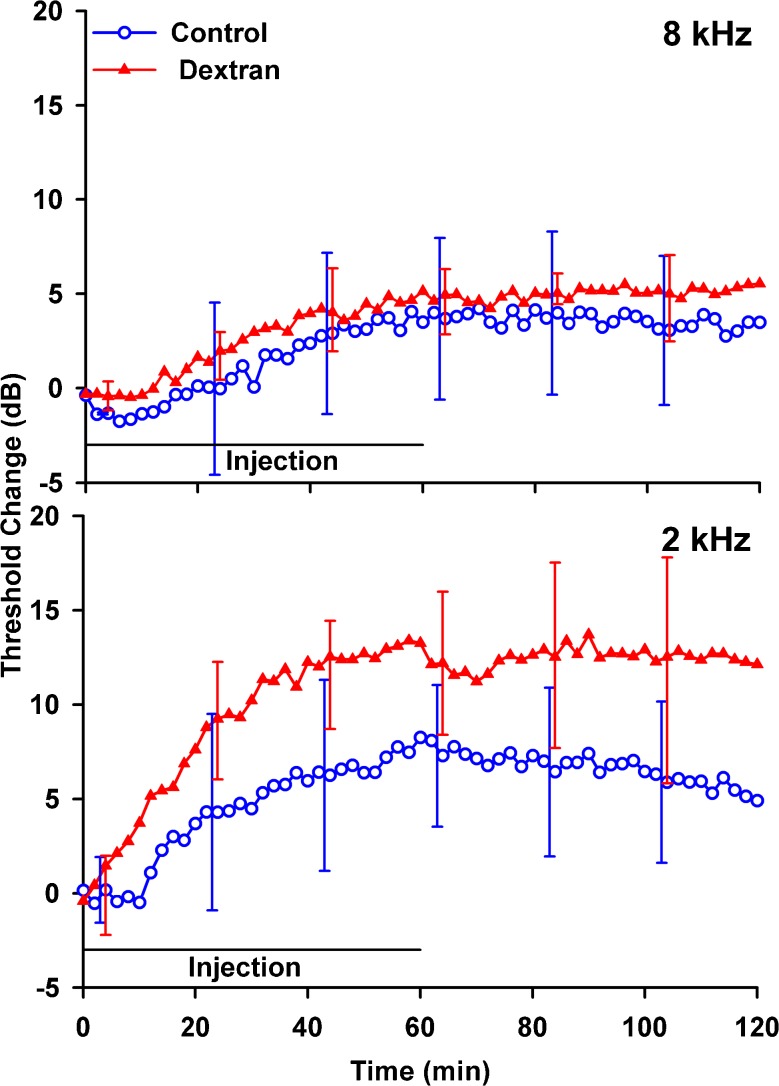
Cochlear sensitivity changes measured at 8 and 2 kHz during and after dextran injections into the LSCC and in artificial perilymph controls are shown in Figure 10. Threshold elevations present in both the control and dextran groups could arise by chemical, mechanical, or temperature changes induced by perfusion or from fluid accumulation in the RW niche. Threshold elevations were greater at 2 kHz for dextran than for artificial perilymph although elevations were similar at 8 kHz. The mean threshold shift averaged over the 30–120-min period was not significantly greater for dextran than controls at either 2 kHz (t test, t = 2.06, df 10, P = 0.066) or 8 kHz (t test, t = 1.151, df 10, P = 0.277). The greater threshold elevations for dextran solution at low frequencies could be related to the mechanical properties of the dextran solution (higher density and possibly a higher viscosity than artificial perilymph) but there could also be a chemical influence of the dextran.
FIG. 10.
Mean changes in CAP thresholds at 8 kHz (upper panel) and 2 kHz (lower panel) for artificial perilymph (control, n = 3) and for 1 mM dextran 4000 in artificial perilymph (n = 7) injected into the lateral SCC. Threshold elevations are greater at 2 kHz for dextran solution, but similar at 8 kHz. Error bars indicate standard deviation.
Discussion
The goal of this work was to better understand how substances are distributed in the ear as a function of distance and time following local applications. Here, we focused on direct injections into perilymph but the same homeostatic processes will also influence drug levels with other delivery methods, such as intratympanic applications. When used with injection methods that maintain the ear in the physiologic, sealed state, FITC-dextran was found to be retained in perilymph better than other substances studied (Salt et al. 2012).
An important finding was that dextran concentration fell most rapidly in samples originating in the basal turn of ST. This is more apparent for dextran than other substances because other sources of loss, such as elimination to blood, are lower. The findings are explained through the interaction of perilymph with CSF by two separate processes. The first is a reduction of dextran concentration caused by dilution from CSF entering the cochlea at a very low rate of flow (∼30 nL/min) when the cochlea is in its normal, sealed state. This volume flow accounts for both the reduction in basal turn concentrations of dextran (by dilution) and a faster movement of dextran apically along ST following basal turn injections. It is also in agreement with many prior studies with intratympanically applied drugs, which required apically directed flow to account for their distribution (Mynatt et al. 2006; Plontke et al. 2007, 2008). This rate of CSF entry is, however, still not sufficient to account for the degree of dextran decline at the base of ST, a decline that was partially reduced when the RW membrane was occluded with Tissumend adhesive. We propose that a second process accounts for some solute loss from the basal turn, specifically a cyclical oscillation (reciprocating flow) of fluid at the cochlear aqueduct, driven by fluctuations of CSF pressure driving motion of the compliant RW membrane. Simulations show that an intermixture of just 3 nL/s (i.e., ∼3 nL with every respiratory-induced pressure pulsation) was sufficient to account for the loss. This amount seems reasonable based on estimates of RW compliance in the guinea pig estimated to be 0.14 nL/Pa (Décory et al. 1990; Wit et al. 2003). Considering that respiratory fluctuations are around 0.3 mmHg (∼40 Pa) (Böhmer 1993), each respiratory cycle is calculated to result in a volume displacement of approximately 5.6 nL. A similar reciprocating flow mechanism has been used as the basis of a drug delivery system for the ear (Chen et al. 2005; Sewell et al. 2009).
The rate of CSF entry into the sealed cochlea of approximately 30 nL/min derived in this study confirms this is an important process that can have a major influence on the pharmacokinetics of some substances in perilymph in the basal turn of ST. Over the course of an hour at this rate, the total volume entry (1.8 μL) amounts to almost one third of ST volume. This rate of entry could contribute to more rapid kinetics of entry or decline for drugs applied locally to the round window. The rapid approach to a steady state seen in some prior studies (e.g., Salt and Ma 2001) was misinterpreted as elimination (clearance) to blood. CSF entry has the greatest influence on substances eliminated very slowly from perilymph (such as dextran) and will have lesser influence on substances that are eliminated more rapidly. Nevertheless, this finding suggests that no substances will be retained in the basal turn of ST for a prolonged period.
The observation of sustained CSF entry into ST of the sealed cochlea raises questions of where does the fluid volume exit and how much drug or solute is lost from perilymph as part of the efflux. Under most circumstances, it can be assumed that perilymph volume remains constant with time. In initial simulations with volume loss distributed over the length of SV, we calculated solute loss corresponding to the concentration at each location of the distributed volume loss. The loss calculated in this manner was too large to account for the measured data, and a better representation of concentrations in SV and the vestibule was obtained with losses of about 20–30 % of this theoretical amount. This suggests that the volume lost from perilymph (balancing the volume of CSF entry) is lost in a manner that only partially carries dextran with it. Rather than calculate solute loss arbitrarily based on volume loss (even though the algorithm for this remains available in the simulation program), we elected to balance solute accumulation due to volume loss with an elimination process with specific half-time, which is independent of flow rate. This is not an ideal solution but allows the data to be replicated with fewest assumptions about the location, properties, and interrelationships of the volume and solute efflux processes. Although difficult to distinguish experimentally, there are many possible mechanisms of perilymph volume efflux including the following:
Fluid losses to the lymphatic system. A lymphatic system in the ear is not well described but passage of labeled cells from the ear to the parotid and superficial ventral cervical lymph nodes has been described (Yimtae et al. 2001). Adams and Merchant (2012) used antibodies that in other organs mark different parts of the lymphatic system and reported the existence of lymphatic vessels in the spiral ligament of the mouse cochlea. The functional significance of a lymphatic system in the cochlea remains unknown.
Volume uptake into endolymph. In classical texts, it was suggested that endolymph was generated by “radial flow” involving volume and water movements across Reissner’s membrane (Naftalin and Harrison 1958; Lawrence et al. 1961). In view of extremely low measured endolymph flow rates (0.36 nL/min mean rate toward the base) (Salt and Thalmann 1989), it is now generally accepted that endolymph is not secreted in volume. Rather, the major ions are recycled between endolymph and perilymph (Steel 1999) with water distributing passively. Homeostasis of cochlear endolymph therefore should not involve water uptake from perilymph amounting to 30 nL/min. The situation is far less clear for the vestibular system, however, and there are no direct measures of fluid flow in the endolymph of vestibular structures. Labeled glycoproteins of the saccular and utricular maculae, which were not found in tectorial membrane, were reported to flow to the endolymphatic sac (Manni and Kuijpers 1987). Any process in the vestibule that involves fluid uptake into endolymph and subsequent transfer to the endolymphatic sac could represent a loss of volume from perilymph and contribute to a volume flow of CSF entering perilymph through the cochlear aqueduct.
Fluid loss to the vascular system. In the cochlea, both venous drainage and perilymph communication with the modiolus primarily occur from ST (Axelsson and Ryan 2001; Shepherd and Colreavy 2004; Rask-Andersen et al. 2006). In contrast, arterioles run in bony channels around SV and communication with the modiolus is more restricted from SV (Shepherd and Colreavy 2004) so it is not apparent how volume loss could occur there. Nevertheless, there are also capillary beds and venous drainage associated with tissues of the vestibule so it is possible that volume loss could occur.
In each of these cases, the flow would not be at a single location and would be distributed over some region of the ear. Measuring and documenting the site(s) of outflow may therefore prove to be challenging.
The technique of taking sequential samples from the LSCC or cochlear apex provides a detailed, quantitative view of drug gradients in the inner ear. Nevertheless, interpretation of these data needs to consider distortions by solute exchanges with adjacent compartments as fluids flow towards the collection site. For the first sample collected, contamination may be minor, but later samples pass through a longer pathway through the perilymphatic space. In the worst case, perilymph originating in the basal turn of ST must pass apically along the entire ST, then basally down SV, and through the vestibule and LSCC before collection. Whether drug is gained or lost during this passage depends on whether drug gradients along the perilymphatic space existed prior to sampling and how fast sample collection occurs. Where the main focus is on ST gradients, sampling from the cochlear apex therefore gives a clearer representation, as the fluid does not have to pass through the vestibular spaces. Dealing with this complexity is aided considerably by the use of simulations to interpret the data. The simulation program takes into account sample volumes and collection rates, calculating exchanges between perilymph and tissue spaces throughout the ear as the fluids move during sample collection. The present studies with dextran have allowed the baseline kinetics of perilymph to be detailed, specifically involving processes that are not substance-specific, but upon which substance-specific processes, such as elimination to blood, exchange with endolymph, active transport, etc. must be superimposed.
The analysis demonstrates that pharmacokinetics of the basal turn of ST with intratympanic drug applications is likely to be far more complex than has hitherto been appreciated. The processes identified here, specifically drug dilution in the basal turn through interactions with CSF, cannot be quantified with accuracy with intratympanic applications, when entry through the RW membrane is variable and unknown, or when elimination of the drug to blood dominates. Drug kinetics in the basal part of scala tympani with local applications can therefore be influenced by at least six processes, specifically: (1) rate of entry through the RW membrane (not studied here); (2) distribution along ST by diffusion; (3) volume entry of CSF through the cochlear aqueduct, causing local dilution of concentration and flow-driven apical movement of the drug; (4) loss of drug from the basal region of ST through exchange with CSF due to an oscillation of fluid across the cochlear aqueduct; (5) distribution into adjacent fluid/tissue compartments, including the spiral ligament, spiral ganglion, and organ of Corti, and from there to other compartments of the ear including the spaces of the auditory nerve, scala media, scala vestibuli, and vestibular spaces; and (6) losses to blood via the vasculature of the adjacent tissue spaces. As the processes underlying cochlear pharmacokinetics become better characterized, it will be possible to optimize local drug application therapies.
Acknowledgments
This work was supported by research grant DC01368 from the National Institute on Deafness and Other Communication Disorders (NIDCD), National Institutes of Health (NIH).
Conflict of Interest
The authors have no conflicts of interest with regard to this study.
References
- Adams J, Merchant S. Cochlear lymphatics. Assoc Res Otolaryngol. 2012;35:159. [Google Scholar]
- Altmann F, Waltner JG. The circulation of the labyrinthine fluids. Ann Oto Rhino Laryngo. 1947;56:684–708. doi: 10.1177/000348944705600312. [DOI] [PubMed] [Google Scholar]
- Altmann F, Waltner JG. Further investigations on the physiology of the labyrinthine fluids. Ann Otol. 1950;59:657–686. doi: 10.1177/000348945005900308. [DOI] [PubMed] [Google Scholar]
- Axelsson A, Ryan AF (2001) Circulation of the inner ear: I. Comparative study of the vascular anatomy of the mammalian cochlea. In: A.F. Jahn, J. Santos-Sacchi (eds) Physiology of the ear. Singular Press, San Diego, pp 301–320
- Böhmer A. Hydrostatic pressure in the inner ear fluid compartments and its effects on inner ear function. Acta Otolaryngol Suppl. 1993;507:3–24. [PubMed] [Google Scholar]
- Chen Z, Kujawa SG, McKenna MJ, Fiering JO, Mark JMJ, Borenstein JT, Swan EL, Sewell WF. Inner ear drug delivery via a reciprocating perfusion system in the guinea pig. J Contrl Rel. 2005;110:1–19. doi: 10.1016/j.jconrel.2005.09.003. [DOI] [PMC free article] [PubMed] [Google Scholar]
- Décory L, Franke RB, Dancer AL. Measurement of the middle ear transfer function in cat, chinchilla and guinea pig. In: Dallos P, Geisler CD, Matthews JW, Ruggero MA, Steele CR, editors. The mechanics and biophysics of hearing. Berlin: Springer; 1990. pp. 270–277. [Google Scholar]
- Ferrary E, Sterkers 0, Saumon O, Tran Ba Huy P, Amiel C. Facilitated transfer of glucose from blood into perilymph in the rat cochlea. Am J Physiol. 1987;253:F59–F65. doi: 10.1152/ajprenal.1987.253.1.F59. [DOI] [PubMed] [Google Scholar]
- Gisselsson L. The passage of fluorescein sodium to the labyrinthine fluids. Acta Oto!aryngol (Stockh) 1949;37:268–275. doi: 10.3109/00016484909120244. [DOI] [PubMed] [Google Scholar]
- Hara A, Salt AN, Thalmann R. Perilymph composition in scala tympani of the cochlea: influence of cerebrospinal fluid. Hear Res. 1989;42:265–272. doi: 10.1016/0378-5955(89)90150-0. [DOI] [PubMed] [Google Scholar]
- Hirose K, Hartsock JJ, Johnson S, Santi P, Salt AN. Systemic lipopolysaccharide compromises the blood-labyrinth barrier and increases entry of serum fluorescein into the perilymph. J Assoc Res Otolaryngol. 2014;15:707–719. doi: 10.1007/s10162-014-0476-6. [DOI] [PMC free article] [PubMed] [Google Scholar]
- Kaupp H, Giebel W. Distribution of marked perilymph to the subarachnoid space. Arch Otorhinolaryngal. 1980;229:245–253. doi: 10.1007/BF02565527. [DOI] [PubMed] [Google Scholar]
- Kimura RS, Schuknecht HF, Ota CY. Blockage of the cochlear aqueduct. Acta Otolaryngol (Stockh) 1974;77:1–12. doi: 10.3109/00016487409124591. [DOI] [PubMed] [Google Scholar]
- Lawrence M, Wolks D, Litton WB. Circulation of the inner ear fluids. Ann Otol. 1961;70:753–776. doi: 10.1177/000348946107000310. [DOI] [PubMed] [Google Scholar]
- Manni JJ, Kuijpers W. Longitudinal flow of macromolecules in the endolymphatic space of the rat. An autoradiographical study. Hear Res. 1987;26:229–237. doi: 10.1016/0378-5955(87)90059-1. [DOI] [PubMed] [Google Scholar]
- Mynatt R, Hale SA, Gill RM, Plontke SKR, Salt AN. Demonstration of a longitudinal concentration gradient along scala tympani by sequential sampling of perilymph from the cochlear apex. J Assoc Res Otolaryngol. 2006;7:182–193. doi: 10.1007/s10162-006-0034-y. [DOI] [PMC free article] [PubMed] [Google Scholar]
- Naftalin L, Harrison MS. Circulation of labyrinthine fluids. J Laryngol. 1958;72:118–136. doi: 10.1017/S0022215100053731. [DOI] [PubMed] [Google Scholar]
- Ohyama K, Salt AN, Thalmann R. Volume flow rate of perilymph in the guinea pig cochlea. Hearing Res. 1988;35(119):130. doi: 10.1016/0378-5955(88)90111-6. [DOI] [PubMed] [Google Scholar]
- Plontke SK, Mynatt R, Gill RM, Salt AN. Concentration gradient along scala tympani following the local application of gentamicin to the round window membrane. Laryngoscope. 2007;117:1191–1198. doi: 10.1097/MLG.0b013e318058a06b. [DOI] [PMC free article] [PubMed] [Google Scholar]
- Plontke SK, Biegner T, Kammerer B, Delabar U, Salt AN. Dexamethasone concentration gradients along scala tympani after application to the round window membrane. Otol Neurotol. 2008;29:401–406. doi: 10.1097/MAO.0b013e318161aaae. [DOI] [PMC free article] [PubMed] [Google Scholar]
- Rask-Andersen H, Schrott-Fischer A, Pfaller K, Glueckert R. Perilymph/modiolar communication routes in the human cochlea. Ear Hear. 2006;27:457–465. doi: 10.1097/01.aud.0000233864.32183.81. [DOI] [PubMed] [Google Scholar]
- Salt AN, DeMott JE. Longitudinal endolymph movements induced by perilymphatic injections. Hear Res. 1998;123:137–147. doi: 10.1016/S0378-5955(98)00106-3. [DOI] [PubMed] [Google Scholar]
- Salt AN, Ma Y. Quantification of solute entry into cochlear perilymph through the round window membrane. Hear Res. 2001;154:88–97. doi: 10.1016/S0378-5955(01)00223-4. [DOI] [PubMed] [Google Scholar]
- Salt AN, Thalmann R (1989) Rate of longitudinal flow of cochlear endolymph. In: Nadol JB (ed) Ménière’s disease. Kugler, Amsterdam, pp. 69 73
- Salt AN, Kellner C, Hale S. Contamination of perilymph sampled from the basal cochlear turn with cerebrospinal fluid. Hear Res. 2003;182:24–33. doi: 10.1016/S0378-5955(03)00137-0. [DOI] [PubMed] [Google Scholar]
- Salt AN, Hartsock JJ, Gill RM, Piu F, Plontke SK. Perilymph pharmacokinetics of markers and dexamethasone applied and sampled at the lateral semi-circular canal. J Assoc Res Otolaryngol. 2012;13(6):771–783. doi: 10.1007/s10162-012-0347-y. [DOI] [PMC free article] [PubMed] [Google Scholar]
- Sewell WF, Borenstein JT, Chen Z, Fiering J, Handzel O, Holmboe M, Kim ES, Kujawa SG, McKenna MJ, Mescher MM, Murphy B, Swan EE, Peppi M, Tao S. Development of a microfluidics-based intracochlear drug delivery device. Audiol Neurootol. 2009;14:411–422. doi: 10.1159/000241898. [DOI] [PMC free article] [PubMed] [Google Scholar]
- Shepherd RK, Colreavy MP. Surface microstructure of the perilymphatic space: implications for cochlear implants and cell- or drug-based therapies. Arch Otolaryngol Head Neck Surg. 2004;130:518–523. doi: 10.1001/archotol.130.5.518. [DOI] [PubMed] [Google Scholar]
- Steel KP. Perspectives: biomedicine. The benefits of recycling. Science. 1999;285:1363–1364. doi: 10.1126/science.285.5432.1363. [DOI] [PubMed] [Google Scholar]
- Wit HP, Feijen RA, Albers FW. Cochlear aqueduct flow resistance is not constant during evoked inner ear pressure change in the guinea pig. Hear Res. 2003;175:190–199. doi: 10.1016/S0378-5955(02)00738-4. [DOI] [PubMed] [Google Scholar]
- Yimtae K, Song H, Billings P, Harris JP, Keithley EM. Connection between the inner ear and the lymphatic system. Laryngoscope. 2001;111:1631–1635. doi: 10.1097/00005537-200109000-00026. [DOI] [PubMed] [Google Scholar]


