

Abstract
Failure to maintain organelle genome stability has been linked to numerous phenotypes, including variegation and cytosolic male sterility (CMS) in plants, as well as cancer and neurodegenerative diseases in mammals. Here we describe a next-generation sequencing approach that precisely maps and characterizes organelle DNA rearrangements in a single genome-wide experiment. In addition to displaying global portraits of genomic instability, it surprisingly unveiled an abundance of short-range rearrangements in Arabidopsis thaliana and human organelles. Among these, short-range U-turn-like inversions reach 25% of total rearrangements in wild-type Arabidopsis plastids and 60% in human mitochondria. Furthermore, we show that replication stress correlates with the accumulation of this type of rearrangement, suggesting that U-turn-like rearrangements could be the outcome of a replication-dependent mechanism. We also show that U-turn-like rearrangements are mostly generated using microhomologies and are repressed in plastids by Whirly proteins WHY1 and WHY3. A synergistic interaction is also observed between the genes for the plastid DNA recombinase RECA1 and those encoding plastid Whirly proteins, and the triple mutant why1why3reca1 accumulates almost 60 times the WT levels of U-turn-like rearrangements. We thus propose that the process leading to U-turn-like rearrangements may constitute a RecA-independent mechanism to restart stalled forks. Our results reveal that short-range rearrangements, and especially U-turn-like rearrangements, are a major factor of genomic instability in organelles, and this raises the question of whether they could have been underestimated in diseases associated with mitochondrial dysfunction.
The endosymbiosis events at the origin of mitochondria and plastids have been a key step in the appearance of eukaryotic cells. During evolution, most of the genes present in the genome of the endosymbionts have been lost or transferred to the nucleus, resulting in organelles with small, dense genomes that almost exclusively encode essential genes. There is therefore a strong selective pressure for the maintenance of genome stability in organelles (Wolfe et al. 1987). In plants, Arabidopsis thaliana has emerged as a useful model to study organelle genome rearrangements. Several actors involved in the maintenance of Arabidopsis plastid and mitochondrion genomes have been identified, among which are the Whirly proteins, a family of single-stranded DNA-binding proteins that guard organelles against genomic rearrangements (Maréchal et al. 2009; Cappadocia et al. 2010). It has been proposed that these proteins stabilize single-stranded DNA and guide it through conservative repair mechanisms such as homologous recombination (Maréchal et al. 2009; Cappadocia et al. 2010). Whirly proteins are found in all plant organelles and, in Arabidopsis, WHY1 and WHY3 are targeted to the plastids, while WHY2 is targeted to the mitochondria (Krause et al. 2005). The RecA family of DNA-binding proteins also maintains organelle genome stability through their central role in homologous recombination. In Arabidopsis, three RecA proteins are found in organelles, with RECA1 targeted to the chloroplast, RECA3 to the mitochondrion, and RECA2 targeted to both organelles (Shedge et al. 2007). These proteins were shown to be involved in DNA double-strand break (DSB) repair and, in plastids, to maintain the structure of the genome (Rowan et al. 2010; Miller-Messmer et al. 2012). Prokaryote RecA proteins were also shown to be essential for fork reversal, a mechanism that allows the accurate restart of paused replication forks, thereby promoting fork progression in conditions of replication stress (Seigneur et al. 2000; Robu et al. 2001; Costes and Lambert 2012).
Replication represents a major challenge to plastid and mitochondrion genome stability. For example, it was shown that the mutation of the type I polymerase POLIB in Arabidopsis causes replication stress at early developmental stages and increases the amount of DSBs upon genotoxic stress treatment (Parent et al. 2011). Interestingly, mutation of the mammalian mitochondrial DNA polymerase gamma has also been linked to replication stress and DSBs (Vermulst et al. 2008; Ameur et al. 2011). Replication-dependent DSBs are known to arise when a fork collapses or encounters a nick in the matrix DNA (Zeman and Cimprich 2014). These DSBs can subsequently be repaired by homologous recombination or by error-prone mechanisms such as microhomology-mediated recombination (MHMR) and nonhomologous end-joining (NHEJ) (Lundin et al. 2002; Lee et al. 2007; Hastings et al. 2009). Replication-dependent genomic instability is, however, not solely induced by DSB repair mechanisms (Zeman and Cimprich 2014). Indeed, stalled forks have recently been shown to produce DSB-independent fusions of nearby inverted-repeats, which lead to the formation of palindromic chromosomes (Mizuno et al. 2009; Paek et al. 2009). The mechanisms by which these fusions take place remain a subject of debate, and three distinct possibilities have been proposed: faulty template switching, tandem inversion duplications, and replication U-turns (Mizuno et al. 2009, 2013; Paek et al. 2009; Kugelberg et al. 2010; Seier et al. 2012).
To date, our understanding of how organisms deal with replication-associated genomic instability has mostly been obtained using reporter systems. A drawback of these systems is that they are impractical for the study of organelle genomes. To overcome this limitation, we developed a next-generation sequencing approach which allows the characterization of organelle DNA instability at a genome-wide level while providing information about the mechanism underlying each rearrangement formation.
Results
Short-range rearrangements are abundant in organelle genomes
We first evaluated overall plastid DNA (ptDNA) rearrangements in the Arabidopsis thaliana ecotype Col-0. To obtain a global and quantitative portrait of ptDNA instability, a heatmap representation was employed in which all rearrangements are reported at the intersection of the two genomic coordinates that correspond to each side of the rearrangement junction. This analysis shows that many rearrangements occur apparently randomly in this plastid genome (Fig. 1A; Supplemental Table S1). It also reveals an overrepresentation of short-range rearrangements (<1000 bp), as indicated by the higher intensity of the heatmap diagonal (Fig. 1A,D). To validate our approach, the same analysis was repeated with the Arabidopsis thaliana ecotypes Ts-1 (Tossa de Mar) and Ws-2 (Wassilewskija) (Weigel and Mott 2009). Results indicate that the overall pattern and relative level of plastid DNA rearrangements are strikingly similar between ecotypes (Supplemental Fig. S1; Supplemental Tables S2, S3).
Figure 1.

Global portrait of organelle genome rearrangements in Arabidopsis and humans. Heatmaps depict each rearrangement as the intersection of the two genomic positions corresponding to the nucleotide on each side of the junction. (A) Rearrangement breakpoint positions of Arabidopsis thaliana (Col-0) plastids. Each tile represents a region spanning 1 kb along each axis. Tile intensity represents the number of rearrangements per 10,000 plastid genomes. All rearrangements mapping to the plastid large inverted repeats (IRs) were only assigned to the first IR. The plastid large single-copy region (LSC), the first IR, and the small-single copy region (SSC) are depicted as a long gray bar, a red bar, and a short gray bar, respectively. (B) Rearrangement breakpoint positions of wild-type Arabidopsis thaliana (Col-0) mitochondria. Each tile represents a region spanning 10 kb along each axis. Tile intensity represents the number of rearrangements per 100 mitochondrion genomes. (C) Rearrangement breakpoint positions of a representative sample for human brain (ERX385572) and liver (ERX385578) mitochondria. Each tile represents a region spanning 1 kb along each axis. Tile intensity represents the number of rearrangements per 10,000 mitochondrion genomes. (D) Proportion of short-range (breakpoint positions <1000 bp apart) and long-range (breakpoint positions at least 1000 bp apart) rearrangements of Arabidopsis thaliana (Col-0) plastid, mitochondrion, and of the mean of the four samples for brain and liver mitochondria. (Ara.) Arabidopsis, (mito.) mitochondrion.
To verify if mitochondria exhibit a similar pattern of genomic instability, we generated a heatmap for Arabidopsis thaliana (Col-0) mitochondrial genome rearrangements. Interestingly, the vast majority of rearrangements also occur at short range in this organelle (Fig. 1B,D; Supplemental Table S4). To our knowledge, this is the first time that such a high level of short-range rearrangements is reported in organelle genomes, which raises the question of whether these could also be abundant in animal mitochondria. To test this hypothesis, we subjected publicly available data sets from human brain and liver to the same analysis. This revealed a similar pattern of short-range genomic instability, reaching 86% and 84% of total rearrangements in brain and liver cells, respectively (Fig. 1C,D; Supplemental Tables S5–S12). In contrast, analysis of genomic instability in E. coli reveals a much less striking prominence of short-range rearrangements (Supplemental Tables S13–S16), indicating that the detection of high levels of these rearrangements in organelles does not occur systematically in our approach. Globally, these results indicate that short-range rearrangements are a major factor of genomic instability in both plant and animal organelles.
Microhomology and non-microhomology repair happen at similar rates in wild-type organelles
To get insights into the mechanisms involved in the formation of the DNA rearrangements in organelles, we further analyzed the reads corresponding to rearranged genome molecules. Because these reads are always composed of two alignments mapping distinct regions of the genome, two types of DNA rearrangements can easily be discriminated: those that possess a microhomology at their junction, most likely formed by MHMR, and those without microhomology, reminiscent of NHEJ repair (Fig. 2A). This analysis revealed that, in wild-type Col-0 (WT) plastids and mitochondria, 55% and 64%, respectively, of genome rearrangements detected arose from microhomology-dependent pathways with microhomologies of 5 bp or more (Fig. 2B). Similarly, rearrangements dependent on microhomologies represent 64% and 67% of total genomic instability in human brain and liver mitochondria, respectively (Fig. 2B).
Figure 2.
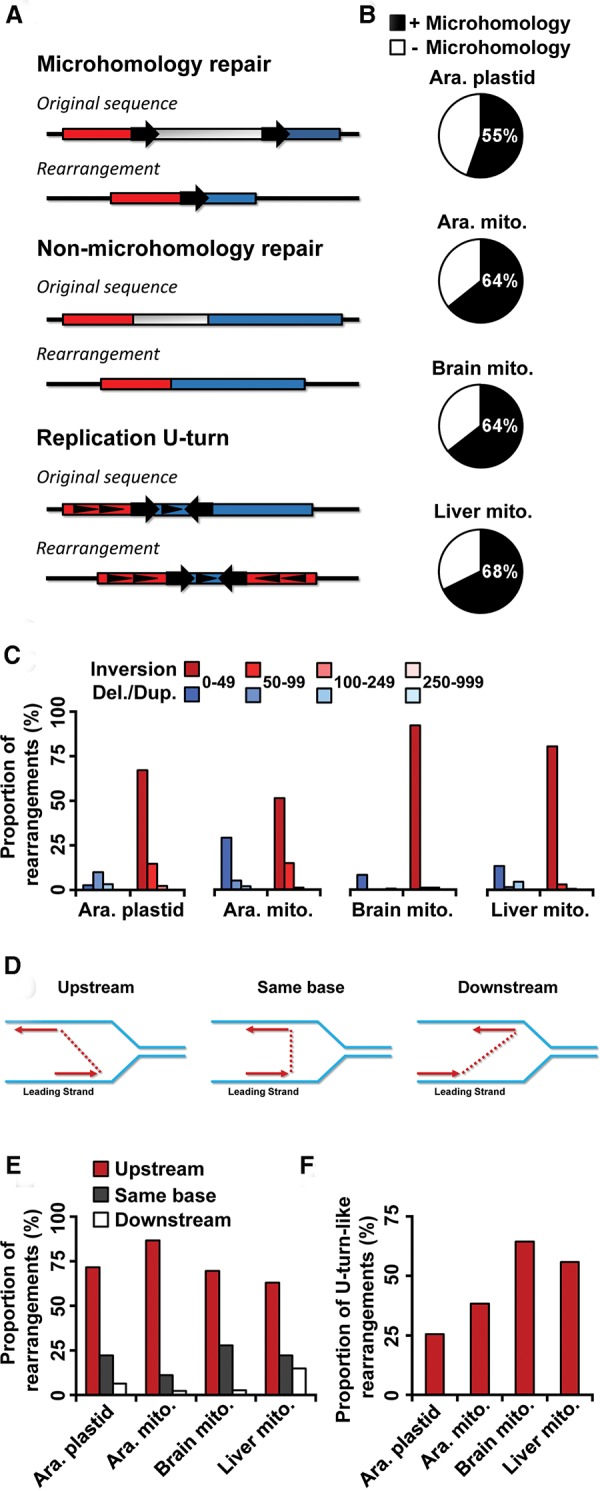
Analysis of organelle genome rearrangements in Arabidopsis and humans. (A) Depiction of the types of rearrangement junctions observed by next-generation sequencing. Large arrows represent microhomologies and their orientation. Small triangles represent relative strand directions. (B) Proportion of rearrangements identified displaying a microhomology (≥5 bp) at their junction in each organelle. The mean of the four samples for brain and liver mitochondria is presented. (C) Proportion of short-range deletions/duplications and inversions (<1000 bp) displaying a gap of the indicated length. The y-axis represents the percentage of each type of rearrangement relative to its class size (gap length). A representative sample is shown for human brain (ERX385572) and liver (ERX385578) mitochondria. (D) Schematic representation of short-range inversions displaying a junction upstream, at the same base, or downstream on the opposite strand. The matrix strands are shown in blue, and the nascent strands in red, with the junction gap shown as a dotted line. (E) Proportion of short-range inversions (<50 bp) displaying a junction upstream, at the same base, or downstream on the opposite strand in each organelle genome. A representative sample is shown for human brain (ERX385572) and liver (ERX385578) mitochondria. (F) Proportion of total rearrangements corresponding to short-range inversions (<50 bp, U-turn-like rearrangements) in each organelle genome. The mean of the four samples for brain and liver mitochondria is presented. (Ara.) Arabidopsis, (mito.) mitochondrion, (del.) deletion, (dup.) duplication.
U-turn-like rearrangements are ubiquitous among organelle short-range rearrangements
The fact that short-range rearrangements represent a large part of the total junctions identified in organelle genomes suggests that these rearrangements could arise through a specific mechanism taking place at nearby microhomologies. Analysis of rearrangement junctions at the base pair level offers the key advantage of allowing the characterization of these mechanisms. We therefore measured the proportion of rearrangements involving inversions among the short-range rearrangements (<1000 bp) according to their gap length in comparison to other types of rearrangements (duplications and deletions) in Arabidopsis and human organelles. This revealed that inversions occurring over distances smaller than 50 bp are largely overrepresented (Fig. 2C). This type of genomic instability seems to be of particular importance in organelles since it represents ∼26% and 38% of total rearrangements in Arabidopsis plastids and mitochondria, respectively (Fig. 2F). This proportion is even higher in human mitochondria, reaching 64% and 56% of the total brain and liver genomic instability, respectively (Fig. 2F). A closer look at the junctions of these inversions indicates that they mainly occur upstream of the junction breakpoint, on the opposite strand (Fig. 2D–E). Interestingly, although often imperfect, ∼85% of these short-range inversions present a microhomology at their junction in plastids. The overall characteristics of the DNA junctions observed in these short range inversions can best be explained by a model in which replication executes a U-turn upstream on the opposite strand (Fig. 2D). It also suggests that the inversions take place on the opposite strand between the 5′ end of the lagging strand and the site where the DNA is unwound in the replication fork.
Whirly proteins protect the plastid genome from MHMR but not from NHEJ
The organelle DNA polymerase POLIB and Whirly proteins have previously been shown to protect plastid genomes against long-range deletions and duplications mediated by microhomologies. To verify whether these proteins do also offer a protection against short-range DNA rearrangements, we further characterized the Arabidopsis mutant lines why1why3 and polIb by sequencing. We also included in our analysis the mutant line reca1-1 (hereafter called reca1), which is mutated for plastid RECA1 (Supplemental Fig. S2). While only a small increase in ptDNA rearrangements is observed in polIb and reca1 as compared to the Col-0 parent line, a much higher level of genomic instability is observed in the why1why3 line (Fig. 3A,B; Supplemental Tables S17–S19). Interestingly, the heatmap diagonal region of all three mutant lines also shows a much higher intensity than the rest of the genome (Fig. 3A). It thus seems that short-range rearrangements also constitute an important part of the total ptDNA instability in these lines and that their occurrence is increased when genes involved in DNA metabolism are mutated. To get insights into the mechanisms involved in the formation of these rearrangements, we determined the prevalence of microhomology usage for each line. While ∼0.12 DNA rearrangements per genome arose from microhomologies in WT plants, this increased to 0.8 microhomology-dependent rearrangements per genome in why1why3 (Fig. 3B). This shift toward microhomology usage in why1why3 is also confirmed by the analysis of the lengths of the microhomologies leading to rearrangements. Indeed, while microhomology-mediated rearrangements in WT, reca1, and polIb plants are in large part produced by microhomologies of 5 to 9 bp, those generated from microhomologies of 10 to 14 bp are the most prevalent in the Whirly mutant (Fig. 3C). In contrast, the level of DNA rearrangements generated independently of microhomologies is similar in all four lines (Fig. 3B), suggesting that Whirly proteins mainly suppress the appearance of microhomology-dependent rearrangements and do not affect microhomology-independent pathways. The polIb, reca1, and why1why3 mutations, however, have little effect on the accumulation of U-turn-like rearrangements (inversions occurring over distances smaller than 50 bp), which only slightly increase in all three mutant lines (Fig. 3D).
Figure 3.
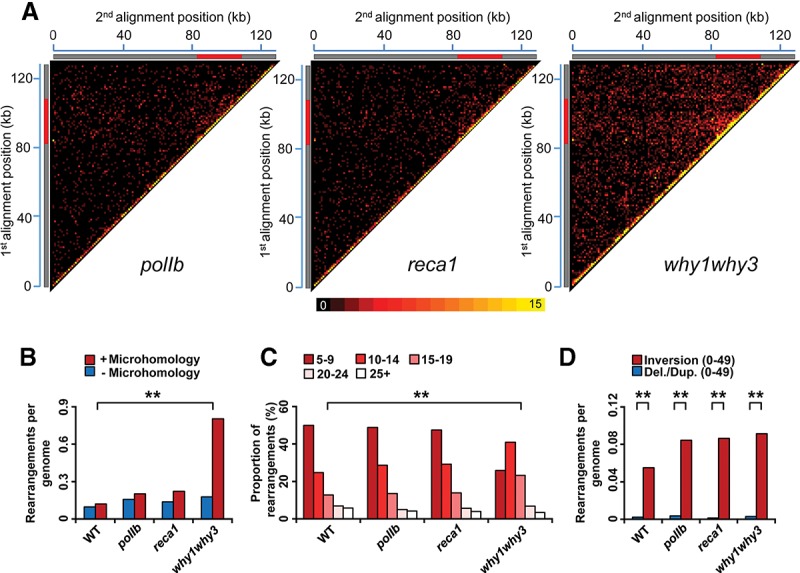
Global portrait of plastid genome rearrangements in Arabidopsis mutant lines polIb, reca1, and why1why3. (A) Plastid rearrangement breakpoint positions of the indicated Arabidopsis mutant lines. Heatmaps depict each rearrangement as the intersection of the two genomic positions corresponding to the nucleotide on each side of the junction. Each tile represents a region spanning 1 kb along each axis. Tile intensity represents the number of rearrangements per 10,000 plastid genomes. All rearrangements mapping to the plastid large inverted repeats (IRs) were only assigned to the first IR. The plastid large single-copy region (LSC), the first IR, and the small-single copy region (SSC) are depicted as a long gray bar, a red bar, and a short gray bar, respectively. (B) Normalized amount of rearrangements per plastid genome displaying a microhomology (≥5 bp) (red) or not displaying a microhomology (blue) at their junction for each of the indicated mutant lines. (C) Proportion of total plastid rearrangements displaying a microhomology of given lengths, in bases, in each mutant line. The y-axis represents the percentage of usage of each microhomology length. (D) Normalized amount of rearrangements corresponding to short-range inversions (<50 bp, U-turn-like rearrangements, red) and short-range deletions/duplications (<50 bp, blue) in each mutant line. Data were normalized on the total number of plastid genome reads. (Del.) deletion, (dup.) duplication. Two asterisks indicate a significant difference with P-value < 0.00001 using a χ2 test.
Whirly proteins, POLIB, and RECA1 all act to maintain stability in the plastid genome
Genome maintenance is a tightly controlled process in which many proteins act in concert to repress the accumulation of DNA rearrangements. Consequently, the mutation of a single gene may not be sufficient to significantly destabilize the genome. We verified whether POLIB, RECA1, and plastid Whirly genes have additive or synergistic effects by combining mutations for these genes in Arabidopsis. While the phenotype of a reca1polIb line is indistinguishable from that of WT plants (Fig. 4A), why1why3polIb is characterized by a severe growth retardation phenotype, in addition to yellow variegation (Fig. 4A; Parent et al. 2011; Lepage et al. 2013). why1why3reca1 triple mutants show severe growth retardation as well and display white variegation and leaf distortion (Fig. 4A; Supplemental Fig. S3A). Also, embryo lethality is observed in why1why3reca1, with 59% of seeds being unable to germinate (Supplemental Fig. S3B). The quadruple mutant why1why3polIbreca1 could not be isolated from the progeny of why1why3−/− polIb+/−reca1+/− plants, nor from why1why3−/−polIb−/−reca1+/− plants (Stouffer's Z test, P-value < 0.05), suggesting that high levels of plastid genome instability lead to embryo lethality. While the overall pattern of ptDNA rearrangements in reca1polIb was similar to that of WT plants, an important increase was observed in both why1why3polIb and why1why3reca1 (Fig. 4B; Supplemental Tables S20–S22). Furthermore, a hotspot for rearrangements is present in the heatmap of these two triple mutants, at the intersection of regions 86–101 kilobases (kb) and 68–100 kb. In contrast, the IR region from 101–108 kb, which encodes both plastid ribosomal RNAs, displays lower levels of instability.
Figure 4.
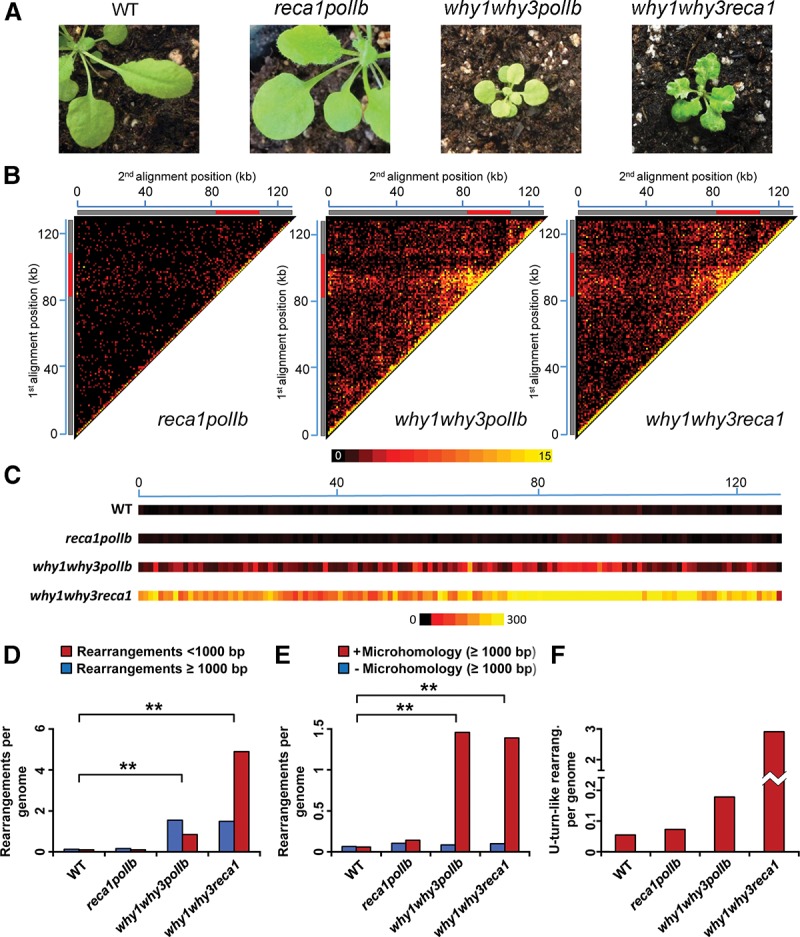
Global portrait of plastid genome rearrangements in Arabidopsis mutant lines reca1polIb, why1why3polIb, and why1why3reca1. (A) Representative photographs of 21-d-old WT, reca1polIb, why1why3polIb, and why1why3reca1 Arabidopsis mutant plants. (B) Plastid rearrangement breakpoint positions of the indicated Arabidopsis mutant lines. Heatmaps depict each rearrangement as the intersection of the two genomic positions corresponding to the nucleotide on each side of the junction. Each tile represents a region spanning 1 kb along each axis. Tile intensity represents the number of rearrangements per 10,000 plastid genomes. All rearrangements mapping to the plastid large inverted repeats (IRs) were only assigned to the first IR. The plastid large single-copy region (LSC), the first IR, and the small-single copy region (SSC) are depicted as a long gray bar, a red bar, and a short gray bar, respectively. (C) Short-range (<1000 bp) plastid rearrangement breakpoint positions of the indicated Arabidopsis mutant lines. Each heatmap tile represents a region spanning 1 kb along the genome and the number of rearrangements per 10,000 plastid genomes. All rearrangements mapping to the plastid large inverted repeats (IRs) were only assigned to the first IR. (D) Normalized amount of short-range (<1000 bp) and long-range (≥1000 bp) rearrangements per plastid genome for each of the indicated mutant lines. (E) Normalized amount of long-range rearrangements (≥1000 bp) per plastid genome displaying a microhomology (≥5 bp) (red) or not displaying a microhomology (blue) at their junction for each of the indicated mutant lines. (F) Normalized amount of rearrangements corresponding to short-range inversions (<50 bp, U-turn-like rearrangements) in each mutant line. Data were normalized on the total number of plastid genome reads. Two asterisks indicate a significant difference with P-value < 0.00001 using a χ2 test.
Comparison of ptDNA rearrangements between why1why3polIb and why1why3reca1 indicates that their amounts of long-range rearrangements (≥1000 bp), arising with or without the use of microhomologies, are strikingly similar (Fig. 4D,E). This suggests that these types of rearrangements are unlikely to be responsible for the difference in phenotypes observed between the two lines. In contrast, rearrangements having occurred between regions separated by <1 kb were much more abundant in why1why3reca1 than in why1why3polIb (Fig. 4C,D). why1why3reca1 plastids also contain a 60-fold increase in U-turn-like rearrangements compared to WT plastids (Fig. 4F), which corresponds to ∼60% of all short-range rearrangements present in this line. These results suggest that Whirly proteins and RECA1 both act to suppress the appearance of U-turn-like rearrangements in plastids. In addition, this high level of U-turn-like rearrangements could account for the severe phenotype observed in why1why3reca1 plants (Fig. 4A).
U-turn-like rearrangements are associated with replication stress
The characteristics of the U-turn-like rearrangements identified above suggest that they might arise during replication and that their formation could therefore be linked to replication stress. To test this hypothesis, we verified if a replication stress could be observed in why1why3polIb and why1why3reca1. Replication stress is defined here as the slowing of replication fork progression during DNA synthesis (Zeman and Cimprich 2014) which, in next-generation sequencing data, has been associated with a progressive, directional decrease in DNA copy number along the genome (Slager et al. 2014). We therefore compared ptDNA coverage curves for each mutant line to the WT. Results indicate that the coverage in WT plants has a similar pattern to those previously reported in the literature for plastid genomes (Wu et al. 2012; Ferrarini et al. 2013) and to that of all single and double mutant lines used in this study (Supplemental Fig. S4). However, the pattern for ptDNA coverage appears quite different in why1why3polIb and why1why3reca1 (Fig. 5A). Regression analysis within the large single-copy region (LSC, 0–84 kb) of why1why3polIb reveals a steeper slope than in the WT (Fig. 5B), suggesting that replication is affected in this mutant line and is unidirectional along the LSC, going from 84 kb toward the beginning of the genome. However, yet another pattern is observed in why1why3reca1, with two slopes converging in the middle of the LSC in a manner consistent with bidirectional replication (Fig. 5B). Both of these patterns were also confirmed using quantitative PCR (Supplemental Fig. S5). These results therefore suggest that the polIb and reca1 mutations, when combined with the why1why3 mutations, affect replication differently. Nevertheless, the steeper slopes in the LSC observed for why1why3polIb and why1why3reca1 suggest a replication stress, which could be at the origin of the increase in short-range inversions observed in the plastid genome of both of these mutant lines (Fig. 4F). Interestingly, the essential role of RecA in replication fork reversal and restart was previously shown in bacteria and could account for the replication stress observed in why1why3reca1. This result thus supports a role for RECA1 in plastid DNA replication.
Figure 5.
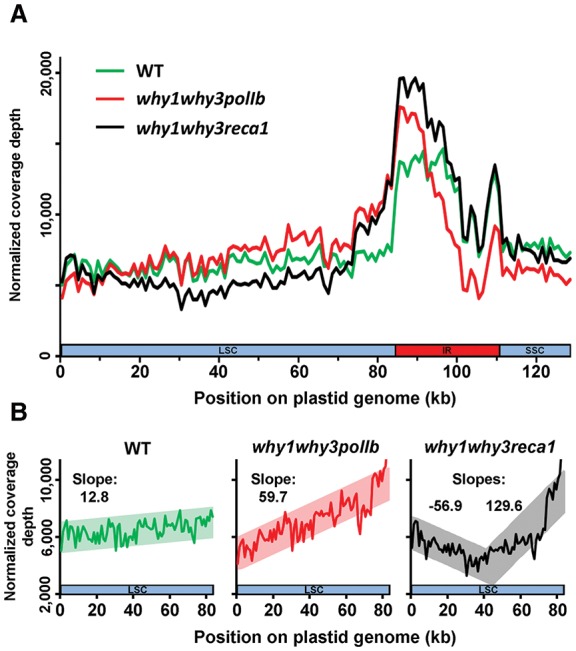
Plastid DNA sequencing coverage curves for Arabidopsis lines WT, why1why3polIb, and why1why3reca1. (A) Plastid sequencing coverage of pools of 14-d-old Arabidopsis seedlings of the indicated genotypes. Positions were rounded down to 1 kb. All reads mapping to the plastid large inverted repeats (IRs) were only assigned to the first IR. The plastid large single-copy region (LSC), the first IR, and the small-single copy region (SSC) are depicted as a long blue bar, a red bar, and a short blue bar, respectively. The y-axis represents the number of reads per 1,000,000 total plastid reads. (B) Regression analysis of the plastid LSC sequencing coverage of WT, why1why3polIb, why1why3reca1 seedlings. Positions were rounded down to 1 kb. The y-axis represents the number of reads per 1,000,000 total plastid reads.
Since replication stress is generally associated with incomplete replication of chromosomes, pulse-field gel electrophoresis (PFGE) was used to visualize the distribution of plastid genomic molecules in the previous mutant lines. This confirmed an earlier study which demonstrated that, in contrast to the WT, no monomeric form of the chloroplast genome is observed in reca1 mutant plants (Rowan et al. 2010). Similar to reca1, disappearance of the monomeric form is observed in why1why3polIb and why1why3reca1 (Supplemental Fig. S6). However, a smear of subgenomic molecules, likely associated with abortive rounds of replication, is instead observed in these mutants, supporting the hypothesis that the elevated levels of U-turn-like rearrangements in these lines could be the consequence of an ongoing replication stress. Note that subgenomic molecules are also observed in the why1why3 mutant, suggesting that Whirly proteins are also important for replication.
Discussion
By sequencing DNA rearrangement junctions, we have been able to obtain a genome-wide portrait of DNA instability in the genomes of organelles and of a prokaryote. Unlike paired-end sequencing approaches used to detect rearrangements, our method is not affected by the distance over which the rearrangements occur. It therefore provides a view of rearrangements occurring both at short-range and long-range, while also allowing some characterization of the DNA repair mechanisms used (Supplemental Figs. S7, S8). Indeed, it revealed that in Arabidopsis and human organelles, both microhomology-dependent and -independent pathways constitute an important driving force of genome variation, with pathways using microhomologies being used slightly more often (Fig. 2B). Although illegitimate recombination has been known to occur in organelles (Small et al. 1987; Ogihara et al. 1988), there was no evidence that microhomology-independent repair, such as NHEJ, accounted for such a substantial proportion of organelle DNA rearrangements. Our approach also unveiled an unexpected pattern of genomic instability in organelles of both Arabidopsis and humans, with a strong propensity to generate rearrangements between closely spaced regions of the genome. Since DNA rearrangements are often associated with errors occurring during DNA repair (Lundin et al. 2002; Lee et al. 2007; Hastings et al. 2009), the high occurrence of short-range rearrangements suggests that, in organelle genomes, inaccurate DNA repair takes place predominantly in the vicinity of the damaged DNA.
Our findings also reveal that, in organelles, a previously unreported but frequent error-prone mechanism exists that most likely contributes to the restart of stalled replication forks. Indeed, we observed that U-turn-like rearrangements are particularly abundant among short-range DNA rearrangements in both Arabidopsis and human organelles. The finding that an apparent DNA replication stress correlates with the appearance of U-turn-like rearrangements in plastids suggests that they are initiated in a replication-dependent manner. Paused forks are unstable structures often formed in conditions of replication stress, which leads us to hypothesize that they act as a template for U-turn-like rearrangements. The tendency of these U-turn-like rearrangements to occur upstream and the presence of short inverted repeats at most of their junctions suggest that a small inverted repeat in the 3′ end of the nascent strand would misanneal to its complement upstream on the opposite strand and lead to inaccurate fork restart (Fig. 6).
Figure 6.
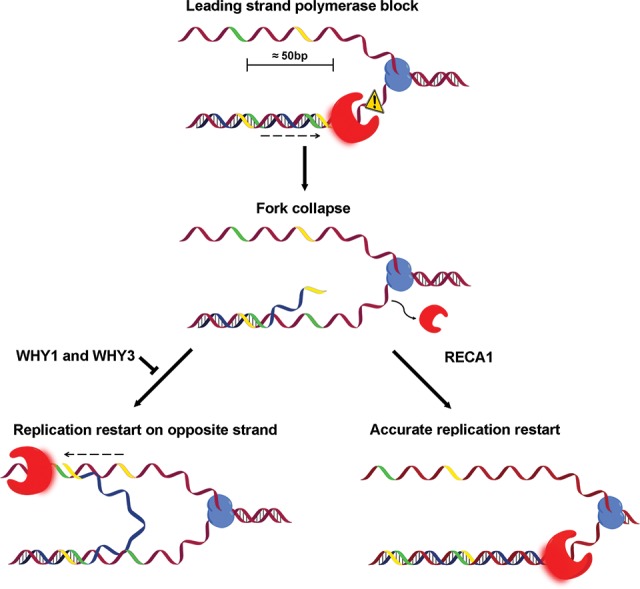
Model of microhomology-mediated U-turn-like inversions. The red shape represents the DNA polymerase and the blue shape represents the DNA helicase. Yellow and green strands represent inverted microhomologies. Impediments to replication fork progression might force the leading strand polymerase to pause and eventually unload. In the presence of RecA, the impediment may be bypassed to restart replication accurately. In the absence of RecA and Whirly proteins, a microhomology located at the 3′ end of the nascent strand can anneal to its complementary inverted repeat on the opposite strand and restart the replication fork on the wrong strand. The dotted arrow represents a multistep process.
The fact that microhomologies favor U-turn-like rearrangements suggests that WHY1 and WHY3, which limit the accumulation of microhomology-dependent rearrangements, prevent this form of instability by repressing the misannealling of closely spaced microhomologies. Also, the observation that single mutations of RECA1 and POLIB have no visible impact on U-turn-like rearrangements but cause major changes only when combined with the mutations of WHY1 and WHY3 indicate the synergistic interaction between these genes and the Whirly genes. In the absence of Whirly proteins, replication stress could explain an increase in U-turn-like rearrangements, as observed in why1why3polIb. In contrast, we postulate that replication stress alone does not likely account for the much larger increase observed in why1why3reca1. We propose instead that RECA1 is involved in a conservative repair pathway that directly competes with replication U-turns. Interestingly, the recombinase RecA has been shown to be essential in bacteria to efficiently bypass lesions and restart replication by promoting replication fork reversal (Seigneur et al. 2000; Robu et al. 2001; Costes and Lambert 2012). It can thus be hypothesized that RECA1 also promotes lesion bypass and accurate fork restart in plastids, thereby limiting the accumulation of U-turn-like rearrangements. The severe phenotype observed in the why1why3reca1 mutant also indicates that U-turn-like rearrangements have deleterious effects and that their occurrence must be limited by multiple checkpoints.
Taken together, our results suggest a model for the generation of U-turn-like rearrangements in which progression of the leading strand polymerase is arrested during replication as a consequence of replication stress (Fig. 6). If the fork remains paused and eventually collapses, mechanisms such as RecA-dependent fork-reversal can accurately restart replication. In the absence of RECA1 and Whirly proteins, forks can restart inaccurately by the misannealing of a small inverted repeat in the 3′ end of the nascent strand to its complement upstream on the opposite strand. Replication would then be reinitiated on the opposite strand until it either displaces the lagging strand or is ligated to its 5′ end, resulting in the formation of a palindromic chromosome. Although this mechanism generates genomic rearrangements, it might serve as an alternative mechanism to restart replication forks. Whirly proteins would avert these rearrangements by binding to the single-stranded DNA and thus preventing misannealing of small inverted repeats.
Overall, our approach reveals that short-range rearrangements, and especially U-turn-like inversions, have been largely underestimated in organelle genomes. In this study, we report that high levels of U-turn-like rearrangements correlate with the appearance of the severe phenotype observed in why1why3reca1 and to its 59% seed lethality. Since this type of genomic instability also constitutes the majority of the DNA rearrangements occurring in human mitochondria, it warrants further investigation into its link to the development of some of poorly understood mitochondrial disorders. Mitochondrial genome instability has indeed been observed in many clinical disorders including Parkinson's disease (Bender et al. 2006; Kraytsberg et al. 2006), inclusion body myositis (Moslemi et al. 1997), and cancer (Ju et al. 2014). In this regard, it will be interesting to evaluate if particular patterns of mitochondrial genomic instability are observed in the context of these disorders. Genomic rearrangements associated with inversions in the human nuclear genome have also been linked to leukemia, autism, and intellectual disability (Pui et al. 1992; Hermetz et al. 2014). It would therefore also be interesting to determine whether such rearrangements also occur through a U-turn-like mechanism and lead to the onset of such phenotypes.
Methods
Plant material and growth conditions
Arabidopsis thaliana (ecotype Columbia-0) mutant lines reca1-2 (SALK_072979) (Rowan et al. 2010), polIb-1 (SALK_134274), why1why3, and why1why3polIb-1 were reported previously (Maréchal et al. 2009; Parent et al. 2011). The reca1-1 (SALK_057982) mutant line was isolated from heterozygous seeds obtained from ABRC (Alonso et al. 2003). Seeds were sown on soil, vernalized for 3 d at 4°C, and grown under laboratory normal light (100 mmol m–2 s–1) at 22°C on a 16-h-day/8-h-dark cycle. Representative photographs were taken at 21 d. To determine statistical significance of why1why3polIbreca1 lethality, χ2 tests were performed on progeny of why1why3−/−polIb+/−reca1-1+/− and why1why3−/−polIb−/−reca1-1+/− plants. χ2 P-values were then combined using Stouffer's Z test (Whitlock 2005).
DNA isolation and DNA-seq
For Col-0, polIb, reca1, why1why3, reca1polIb, why1why3polIb, and why1why3reca1, total DNA was isolated from ≈400 mg pools of 14-d-old Arabidopsis plants using the cetyl trimethyl-ammonium DNA extraction protocol (Weigel and Glazebrook 2002). DNA was fragmented to ≈200–500 bp using S-Series Covaris according to Illumina's specifications. Libraries were prepared using the TruSeq DNA library preparation kit (Illumina) according to the manufacturer's instructions. Efficient library generation was then assessed using a Bioanalyzer platform (Agilent), and an Illumina MiSeq-QC run was performed. Sequencing was performed using an Illumina HiSeq 2000 using TruSeq SBS v3 chemistry at the Institute for Research in Immunology and Cancer's Genomics Platform (Université de Montréal). Cluster density was targeted at around 600–800 kilo-clusters mm–2.
Publicly available Illumina whole-genome sequencing data sets
NCBI SRA accession numbers for paired-end Illumina whole-genome sequencing data sets for Arabidopsis ecotypes Ts-1 and Ws-2 are, respectively, SRX145018 and SRX145037 (submitted by the Salk Institute for Biological Studies). SRA accession numbers for paired-end Illumina whole-genome sequencing data sets for four human brain samples and four liver samples are, respectively, ERX385572, ERX385573, ERX385574, ERX385575, and ERX385576, ERX385577, ERX385578, ERX385579 (submitted by the Institute for Molecular Bioscience, The University of Queensland). SRA accession numbers for paired-end Illumina whole-genome sequencing data sets for E. coli are SRX154301, SRX154337, SRX154338, and SRX154342 (submitted by Indiana University).
Enrichment for reads with potential junctions
The Galaxy online software suite was used to develop a workflow that enriches reads spanning potential junctions from paired-end Illumina data sets (Supplemental Fig. S7; Goecks et al. 2010). As part of the workflow, quality filtering was performed to keep pairs for which both reads measure at least 40 bases, have an average quality of at least 20, and display no more than 50 bases outside of the quality range (Blankenberg et al. 2010). Using Burrows-Wheeler Aligner (BWA) (Li and Durbin 2009), both reads from each pair were mapped individually against the whole reference genome (GRCh38 with alternate loci for Homo sapiens and Galaxy built-in reference genomes Arabidopsis_thaliana_TAIR10 for Arabidopsis thaliana and eschColi_K12 for E. coli) to remove pairs of reads that do not contain a junction. This also allows the removal of nuclear plastid DNA sequences (NUPTs) and nuclear mitochondrial DNA sequences (NUMTs) that would otherwise be flagged as rearrangements. The alignment was performed without using a subsequence as a seed, and parameters were set to a maximum edit distance of 7, a maximum number of gap opens of 1, a maximum number of gap extensions of 3, a mismatch penalty of 3, a gap open penalty of 11, and a gap extension penalty of 4. Pairs with at least one unmapped read were then selected, and the first 25 bases of both reads were mapped against the desired organelle genome (GenBank: AP000423.1 for Arabidopsis plastid, GenBank: Y08501.2 for Arabidopsis mitochondria, NCBI: NC_012920.1 for human mitochondria, and Galaxy built-in reference genome eschColi_K12 for E. coli) using Bowtie for Illumina with default parameters (Langmead et al. 2009). Aligning the 25 first bases of both reads is critical, as rearrangement junctions would prevent the alignment of the whole rearranged read. The distance between each alignment position of a pair was then computed, and pairs containing an unmapped read were discarded. Only pairs that fulfill one of the following conditions were then kept: (1) Each read of a pair is mapped in opposite orientation; (2) each read of a pair is mapped in the same orientation with a distance of at least 3 bases. Finally, pairs were filtered to discard those that correspond to DNA fragments spanning junctions created by the different isoforms of the plastid genome or the circular nature of organelle DNA. Workflow statistics are listed in Supplemental Tables S23–S28. Enriched reads spanning potential junctions are provided in Supplemental Data File 1 for all lines and organisms used in this study.
Analysis of rearranged reads
Sequences of reads containing a potential junction were aligned against the organelle genome (Positions 1 to 128214 of GenBank: AP000423.1 for Arabidopsis plastid, GenBank: Y08501.2 and JF729201.1 for Arabidopsis mitochondria, NCBI: NC_012920.1 for human mitochondria, and NCBI: NC_000913.2 for E. coli) using BLAST+ (Camacho et al. 2009) and the following parameters: “blastn -query potential_junctions.fasta -db organelle_genome.fasta -out output.txt -word_size 10 -max_target_seqs 2 -evalue 0.0001 -outfmt 6.” Only reads with two alignments were kept for further analysis. Among the reads that output two alignments, the longest alignment was subtracted from the length of the read, and reads with values of 5 and less were discarded. BLAST+ outputs for rearrangement reads are provided in Supplemental Data File 2 for all lines and organisms used in this study. To ensure that errors in wild-type plastid genome annotations do not generate false-positive rearrangements, the genomic sequence was confirmed using BLAST+ for each locus at which rearrangements are more abundant than 5% of the average coverage. The reference locus sequence was used as the subject sequence to align the total reads of the samples. When rearrangements were found to be in homoplasmy, these rearrangements were considered as false positives and were discarded. For Arabidopsis Col-0 mitochondria, two genome annotations exist (GenBank: Y08501.2 and JF729201.1). To remove false positives, only reads considered as rearrangements on both annotations were kept. The following algorithms were then used to analyze the rearrangement junctions according to the alignment position output by BLAST+.
Distance measurement algorithm evaluates the difference between the reference genome positions of the 3′ end of the first alignment and the 5′ end of the second alignment. Overlap of alignments algorithm corresponds to the subtraction of the total read length from the sum of the lengths of both alignments. Rearrangements with an overlap of at least 5 bases are considered to have occurred through the use of microhomology, while the rest are assigned to the “No Microhomology” group. This high cut-off was used to ensure the stringency of microhomology calling. Inversion algorithm corresponds to rearrangements for which the reference genome positions from the 5′ end to the 3′ end are in ascending order for one alignment and in descending order for the other. All remaining rearrangements are treated as deletions or duplications. U-turn-like rearrangements are defined as those that present an inversion with a distance parameter of <50 bases. Downstream, same base, and upstream U-turn-like rearrangements are determined by the position on the reference genome of the 5′ end of the second alignment in relation to the 3′ end and direction of the first alignment. The polarity of U-turn-like rearrangements identified in R2 reads has been inverted. Local mapping for read pairs associated with a single rearrangement were selected and aligned on the Arabidopsis thaliana (TAIR10) genome using the Golden Helix GenomeBrowse visualization tool (Version 2.0.7). Representative results for a duplication, a deletion, and an inversion are presented in Supplemental Figure S9.
To evaluate the proportion of U-turn-like rearrangements that occurred through the use of imperfect microhomologies, reads corresponding to this type of genomic rearrangement were aligned against the plastid genome using BLAST+ and the following parameters: “blastn -query U-Turns.fasta -db plastid_genome.fasta -out output.txt -word_size 10 -max_target_seqs 2 -evalue 0.002 -outfmt 6 –penalty -1 –gap open 0 –gap extend 2.” The previous algorithms were then used to evaluate the proportion of rearrangements harboring a microhomology at the junction.
The combination of the previous workflow to enrich reads with potential junctions and these algorithms achieved 64.0% sensitivity for detection of reads containing junctions and 97.5% specificity for accurate rearrangement type calling. For sensitivity, 200 randomly chosen reads from the potential junctions obtained following the Galaxy workflow for the plastid DNA were blind-tested individually to assess if they correspond to a rearrangement or not. For specificity, 480 randomly chosen rearrangements analyzed by the algorithm were analyzed for accurate rearrangement type calling. For both sensitivity and specificity, the online BLAST interface (http://blast.st-va.ncbi.nlm.nih.gov/Blast.cgi) was used with the lowest stringency settings.
Plastid sequencing coverage analysis
Pairs with both reads fully aligned against the reference genome using BWA during enrichment for potential junctions were filtered to keep only those mapping the plastid genome. Positions of each read were rounded down to the nearest kb and all reads mapping to the plastid large inverted repeats (IRs) were only assigned to the first IR. The number of reads mapping each 1 kb-range was measured and normalized relative to 1,000,000 plastid reads.
Pulse-field gel electrophoresis (PFGE) analysis of the plastid genome
Chloroplasts were isolated from 21-d-old Arabidopsis plants as described previously (Little 1997). Isolated chloroplasts were resuspended in homogenization buffer and then mixed 1:1 with 45°C 1% low-melting point agarose in TE buffer and allowed to fix at 4°C. Isolated chloroplasts concentrations were adjusted according to a low-cycle amplification of a DNA fragment of the hypothetical protein RF2 (YCF2) with the following primers: YCF2FOR: GATCTCTGAGAGCTGTTTCCG; YCF2REV: TGTTTCGCCTCTTACTCGGAG. Agarose plugs were then soaked overnight at 50°C in lysis buffer (0.45 M EDTA pH 8.0, 1% [w/v] sarkosyl, 1 mg/mL proteinase K) and washed in storage solution (0.45 M EDTA pH 8.0, 1% [w/v] sarkosyl). Migration was performed in 1.5% agarose gel in 0.5× TBE buffer for 46 h at 12°C using a Bio-Rad CHEF-DR III system. Pulse switch times were set to 120 sec at 5 V/cm using a 120° angle. The gel was then soaked successively in 0.5× TBE buffer supplemented with 1 µg/mL RNase A for 2 h at room temperature, in 0.5× TBE buffer supplemented with 5 µg/mL ethidium bromide for 30 min, and finally in 0.5× TBE buffer to wash the gel. Southern hybridization was then performed as described previously (Maréchal et al. 2009) using a chloroplast probe amplified using the following primers: 49741FOR: CCTTACGTAAAGGCCACCCTA; 54551REV: TGGGACGCATAACCGGATATG.
Quantitative PCR analysis of ptDNA levels
Total DNA was isolated from 14-d-old Arabidopsis Col-0, why1why3polIb, and why1why3reca1 plants using the cetyl trimethyl-ammonium DNA extraction protocol (Weigel and Glazebrook 2002). Primers used for qPCR were calibrated to ensure the amplification of a unique PCR product and efficiency between 1.90 and 2.05. Every reaction was carried out on biological and technical triplicates relative to the amplification of nuclear DNA. Primers sequences are as follows: 7660FOR: TGATCCAGGACGTAATCCGGGAC; 7802REV: CGAATCCCTCTCTTTCCCCTTCTCC; 45345FOR: TTGGCAATTCCTCAGGGGCAG; 45525REV: TTGACTATTCCTCAAGCGCGCC; 81312FOR: AGCTACCCAATACTCAGGGGATCC; 81460REV: AAATAGAAGCAGGGCGACGCG; nucDNA-FOR: GTTGAAGCCTCCGTTCCCTGCTA; nucDNA-REV: CTCTTCCACCGTGCATGGCTTGT. The Power SYBR Green PCR Master Mix (Applied Biosystems) was used according to the manufacturer's instructions. qPCR experiments and analysis were carried out using a LightCycler 480 (Roche) and the LightCycler 480 software version 1.5, respectively.
Quantitative PCR analysis of RECA1 expression in reca1 mutants
Quantitative PCR analysis of RECA1 expression was performed as described previously for 21-d-old plants (Lepage et al. 2013). Every reaction was carried out on biological and technical triplicates relative to the amplification of beta tubulin. Primers used for qRT-PCR were calibrated to ensure the amplification of a unique PCR product and efficiency between 1.90 and 2.05. Primers sequences are as follows: RECA1FOR: GGTGGAGGCCTACCAAAGGG; RECA1REV: GGTGGAGGCCTACCAAAGGG; BetaTubFOR: TCGTTGGGAGGAGGCACAGGT; BetaTubREV: GCTGAGTTTGAGGGTACGGAAGCAG. The Power SYBR Green PCR Master Mix (Applied Biosystems) was used according to the manufacturer's instructions. qPCR experiments and analysis were carried out using a LightCycler 480 (Roche) and the LightCycler 480 software version 1.5, respectively.
Data access
All newly generated sequencing data have been submitted to the NCBI Sequence Read Archive (SRA; http://www.ncbi.nlm.nih.gov/sra) under accession number SRP051208 (Col-0: SRX883065, polIb: SRX813508, reca1: SRX883066, why1why3: SRX883067, reca1polIb: SRX883068, why1why3polIb: SRX883069, why1why3reca1: SRX883070). The Galaxy workflow is freely available on Galaxy's Published Workflows section under the title “Rearrangement Junction Detection.”
Supplementary Material
Acknowledgments
We thank M. Arteau, M. Valach, and the Galaxy Team for assistance with the DNA-seq, PFGE, and data processing, respectively. We also thank T. Vincent for his help in isolating mutant lines. This work was supported by scholarships from the Natural Sciences and Engineering Research Council of Canada (NSERC) to É.L., É.Z., and S.T.B., from the Fonds de Recherche du Québec–Nature et Technologies to S.T.B., and grants from NSERC to N.B.
Author contributions: É.Z. isolated plant DNA for sequencing and performed the PFGE and qPCR experiments. É.Z., É.L., and S.T.B. developed the bioinformatics approach. É.Z., É.L., S.T.B., S.T., and N.B. analyzed and interpreted the data. É.Z., É.L., S.T.B., and N.B. wrote the manuscript.
Footnotes
[Supplemental material is available for this article.]
Article published online before print. Article, supplemental material, and publication date are at http://www.genome.org/cgi/doi/10.1101/gr.188573.114.
References
- Alonso JM, Stepanova AN, Leisse TJ, Kim CJ, Chen H, Shinn P, Stevenson DK, Zimmerman J, Barajas P, Cheuk R, et al. 2003. Genome-wide insertional mutagenesis of Arabidopsis thaliana. Science 301: 653–657. [DOI] [PubMed] [Google Scholar]
- Ameur A, Stewart JB, Freyer C, Hagstrom E, Ingman M, Larsson NG, Gyllensten U. 2011. Ultra-deep sequencing of mouse mitochondrial DNA: mutational patterns and their origins. PLoS Genet 7: e1002028. [DOI] [PMC free article] [PubMed] [Google Scholar]
- Bender A, Krishnan KJ, Morris CM, Taylor GA, Reeve AK, Perry RH, Jaros E, Hersheson JS, Betts J, Klopstock T, et al. 2006. High levels of mitochondrial DNA deletions in substantia nigra neurons in aging and Parkinson disease. Nat Genet 38: 515–517. [DOI] [PubMed] [Google Scholar]
- Blankenberg D, Gordon A, Von Kuster G, Coraor N, Taylor J, Nekrutenko A, Galaxy T. 2010. Manipulation of FASTQ data with Galaxy. Bioinformatics 26: 1783–1785. [DOI] [PMC free article] [PubMed] [Google Scholar]
- Camacho C, Coulouris G, Avagyan V, Ma N, Papadopoulos J, Bealer K, Madden TL. 2009. BLAST+: architecture and applications. BMC Bioinformatics 10: 421. [DOI] [PMC free article] [PubMed] [Google Scholar]
- Cappadocia L, Maréchal A, Parent JS, Lepage E, Sygusch J, Brisson N. 2010. Crystal structures of DNA-Whirly complexes and their role in Arabidopsis organelle genome repair. Plant Cell 22: 1849–1867. [DOI] [PMC free article] [PubMed] [Google Scholar]
- Costes A, Lambert SA. 2012. Homologous recombination as a replication fork escort: fork-protection and recovery. Biomolecules 3: 39–71. [DOI] [PMC free article] [PubMed] [Google Scholar]
- Ferrarini M, Moretto M, Ward JA, Surbanovski N, Stevanovic V, Giongo L, Viola R, Cavalieri D, Velasco R, Cestaro A, et al. 2013. An evaluation of the PacBio RS platform for sequencing and de novo assembly of a chloroplast genome. BMC Genomics 14: 670. [DOI] [PMC free article] [PubMed] [Google Scholar]
- Goecks J, Nekrutenko A, Taylor J, Galaxy T. 2010. Galaxy: a comprehensive approach for supporting accessible, reproducible, and transparent computational research in the life sciences. Genome Biol 11: R86. [DOI] [PMC free article] [PubMed] [Google Scholar]
- Hastings PJ, Ira G, Lupski JR. 2009. A microhomology-mediated break-induced replication model for the origin of human copy number variation. PLoS Genet 5: e1000327. [DOI] [PMC free article] [PubMed] [Google Scholar]
- Hermetz KE, Newman S, Conneely KN, Martin CL, Ballif BC, Shaffer LG, Cody JD, Rudd MK. 2014. Large inverted duplications in the human genome form via a fold-back mechanism. PLoS Genet 10: e1004139. [DOI] [PMC free article] [PubMed] [Google Scholar]
- Ju YS, Alexandrov LB, Gerstung M, Martincorena I, Nik-Zainal S, Ramakrishna M, Davies HR, Papaemmanuil E, Gundem G, Shlien A, et al. 2014. Origins and functional consequences of somatic mitochondrial DNA mutations in human cancer. eLife 3: e02935. [DOI] [PMC free article] [PubMed] [Google Scholar]
- Krause K, Kilbienski I, Mulisch M, Rodiger A, Schafer A, Krupinska K. 2005. DNA-binding proteins of the Whirly family in Arabidopsis thaliana are targeted to the organelles. FEBS Lett 579: 3707–3712. [DOI] [PubMed] [Google Scholar]
- Kraytsberg Y, Kudryavtseva E, McKee AC, Geula C, Kowall NW, Khrapko K. 2006. Mitochondrial DNA deletions are abundant and cause functional impairment in aged human substantia nigra neurons. Nat Genet 38: 518–520. [DOI] [PubMed] [Google Scholar]
- Kugelberg E, Kofoid E, Andersson DI, Lu Y, Mellor J, Roth FP, Roth JR. 2010. The tandem inversion duplication in Salmonella enterica: selection drives unstable precursors to final mutation types. Genetics 185: 65–80. [DOI] [PMC free article] [PubMed] [Google Scholar]
- Langmead B, Trapnell C, Pop M, Salzberg SL. 2009. Ultrafast and memory-efficient alignment of short DNA sequences to the human genome. Genome Biol 10: R25. [DOI] [PMC free article] [PubMed] [Google Scholar]
- Lee JA, Carvalho CM, Lupski JR. 2007. A DNA replication mechanism for generating nonrecurrent rearrangements associated with genomic disorders. Cell 131: 1235–1247. [DOI] [PubMed] [Google Scholar]
- Lepage E, Zampini E, Brisson N. 2013. Plastid genome instability leads to reactive oxygen species production and plastid-to-nucleus retrograde signaling in Arabidopsis. Plant Physiol 163: 867–881. [DOI] [PMC free article] [PubMed] [Google Scholar]
- Li H, Durbin R. 2009. Fast and accurate short read alignment with Burrows-Wheeler transform. Bioinformatics 25: 1754–1760. [DOI] [PMC free article] [PubMed] [Google Scholar]
- Little SE. 1997. Large- or small-scale isolation of chloroplasts using the Avanti® J series of high performance centrifuges. Beckman Instruments, Inc, Fullerton, CA. [Google Scholar]
- Lundin C, Erixon K, Arnaudeau C, Schultz N, Jenssen D, Meuth M, Helleday T. 2002. Different roles for nonhomologous end joining and homologous recombination following replication arrest in mammalian cells. Mol Cell Biol 22: 5869–5878. [DOI] [PMC free article] [PubMed] [Google Scholar]
- Maréchal A, Parent JS, Veronneau-Lafortune F, Joyeux A, Lang BF, Brisson N. 2009. Whirly proteins maintain plastid genome stability in Arabidopsis. Proc Natl Acad Sci 106: 14693–14698. [DOI] [PMC free article] [PubMed] [Google Scholar]
- Miller-Messmer M, Kuhn K, Bichara M, Le Ret M, Imbault P, Gualberto JM. 2012. RecA-dependent DNA repair results in increased heteroplasmy of the Arabidopsis mitochondrial genome. Plant Physiol 159: 211–226. [DOI] [PMC free article] [PubMed] [Google Scholar]
- Mizuno K, Lambert S, Baldacci G, Murray JM, Carr AM. 2009. Nearby inverted repeats fuse to generate acentric and dicentric palindromic chromosomes by a replication template exchange mechanism. Genes Dev 23: 2876–2886. [DOI] [PMC free article] [PubMed] [Google Scholar]
- Mizuno K, Miyabe I, Schalbetter SA, Carr AM, Murray JM. 2013. Recombination-restarted replication makes inverted chromosome fusions at inverted repeats. Nature 493: 246–249. [DOI] [PMC free article] [PubMed] [Google Scholar]
- Moslemi AR, Lindberg C, Oldfors A. 1997. Analysis of multiple mitochondrial DNA deletions in inclusion body myositis. Hum Mutat 10: 381–386. [DOI] [PubMed] [Google Scholar]
- Ogihara Y, Terachi T, Sasakuma T. 1988. Intramolecular recombination of chloroplast genome mediated by short direct-repeat sequences in wheat species. Proc Natl Acad Sci 85: 8573–8577. [DOI] [PMC free article] [PubMed] [Google Scholar]
- Paek AL, Kaochar S, Jones H, Elezaby A, Shanks L, Weinert T. 2009. Fusion of nearby inverted repeats by a replication-based mechanism leads to formation of dicentric and acentric chromosomes that cause genome instability in budding yeast. Genes Dev 23: 2861–2875. [DOI] [PMC free article] [PubMed] [Google Scholar]
- Parent JS, Lepage E, Brisson N. 2011. Divergent roles for the two PolI-like organelle DNA polymerases of Arabidopsis. Plant Physiol 156: 254–262. [DOI] [PMC free article] [PubMed] [Google Scholar]
- Pui CH, Carroll AJ, Raimondi SC, Schell MJ, Head DR, Shuster JJ, Crist WM, Borowitz MJ, Link MP, Behm FG, et al. 1992. Isochromosomes in childhood acute lymphoblastic leukemia: a collaborative study of 83 cases. Blood 79: 2384–2391. [PubMed] [Google Scholar]
- Robu ME, Inman RB, Cox MM. 2001. RecA protein promotes the regression of stalled replication forks in vitro. Proc Natl Acad Sci 98: 8211–8218. [DOI] [PMC free article] [PubMed] [Google Scholar]
- Rowan BA, Oldenburg DJ, Bendich AJ. 2010. RecA maintains the integrity of chloroplast DNA molecules in Arabidopsis. J Exp Bot 61: 2575–2588. [DOI] [PMC free article] [PubMed] [Google Scholar]
- Seier T, Zilberberg G, Zeiger DM, Lovett ST. 2012. Azidothymidine and other chain terminators are mutagenic for template-switch-generated genetic mutations. Proc Natl Acad Sci 109: 6171–6174. [DOI] [PMC free article] [PubMed] [Google Scholar]
- Seigneur M, Ehrlich SD, Michel B. 2000. RuvABC-dependent double-strand breaks in dnaBts mutants require recA. Mol Microbiol 38: 565–574. [DOI] [PubMed] [Google Scholar]
- Shedge V, Arrieta-Montiel M, Christensen AC, Mackenzie SA. 2007. Plant mitochondrial recombination surveillance requires unusual RecA and MutS homologs. Plant Cell 19: 1251–1264. [DOI] [PMC free article] [PubMed] [Google Scholar]
- Slager J, Kjos M, Attaiech L, Veening JW. 2014. Antibiotic-induced replication stress triggers bacterial competence by increasing gene dosage near the origin. Cell 157: 395–406. [DOI] [PubMed] [Google Scholar]
- Small ID, Isaac PG, Leaver CJ. 1987. Stoichiometric differences in DNA molecules containing the atpA gene suggest mechanisms for the generation of mitochondrial genome diversity in maize. EMBO J 6: 865–869. [DOI] [PMC free article] [PubMed] [Google Scholar]
- Vermulst M, Wanagat J, Kujoth GC, Bielas JH, Rabinovitch PS, Prolla TA, Loeb LA. 2008. DNA deletions and clonal mutations drive premature aging in mitochondrial mutator mice. Nat Genet 40: 392–394. [DOI] [PubMed] [Google Scholar]
- Weigel D, Glazebrook J. 2002. Arabidopsis: a laboratory manual. Cold Spring Harbor Laboratory Press, Cold Spring Harbor, NY. [Google Scholar]
- Weigel D, Mott R. 2009. The 1001 genomes project for Arabidopsis thaliana. Genome Biol 10: 107. [DOI] [PMC free article] [PubMed] [Google Scholar]
- Whitlock MC. 2005. Combining probability from independent tests: the weighted Z-method is superior to Fisher's approach. J Evol Biol 18: 1368–1373. [DOI] [PubMed] [Google Scholar]
- Wolfe KH, Li WH, Sharp PM. 1987. Rates of nucleotide substitution vary greatly among plant mitochondrial, chloroplast, and nuclear DNAs. Proc Natl Acad Sci 84: 9054–9058. [DOI] [PMC free article] [PubMed] [Google Scholar]
- Wu J, Liu B, Cheng F, Ramchiary N, Choi SR, Lim YP, Wang XW. 2012. Sequencing of chloroplast genome using whole cellular DNA and solexa sequencing technology. Front Plant Sci 3: 243. [DOI] [PMC free article] [PubMed] [Google Scholar]
- Zeman MK, Cimprich KA. 2014. Causes and consequences of replication stress. Nat Cell Biol 16: 2–9. [DOI] [PMC free article] [PubMed] [Google Scholar]
Associated Data
This section collects any data citations, data availability statements, or supplementary materials included in this article.