

Abstract
Saccharomyces cerevisiae, a well-established model for species as diverse as humans and pathogenic fungi, is more recently a model for population and quantitative genetics. S. cerevisiae is found in multiple environments—one of which is the human body—as an opportunistic pathogen. To aid in the understanding of the S. cerevisiae population and quantitative genetics, as well as its emergence as an opportunistic pathogen, we sequenced, de novo assembled, and extensively manually edited and annotated the genomes of 93 S. cerevisiae strains from multiple geographic and environmental origins, including many clinical origin strains. These 93 S. cerevisiae strains, the genomes of which are near-reference quality, together with seven previously sequenced strains, constitute a novel genetic resource, the “100-genomes” strains. Our sequencing coverage, high-quality assemblies, and annotation provide unprecedented opportunities for detailed interrogation of complex genomic loci, examples of which we demonstrate. We found most phenotypic variation to be quantitative and identified population, genotype, and phenotype associations. Importantly, we identified clinical origin associations. For example, we found that an introgressed PDR5 was present exclusively in clinical origin mosaic group strains; that the mosaic group was significantly enriched for clinical origin strains; and that clinical origin strains were much more copper resistant, suggesting that copper resistance contributes to fitness in the human host. The 100-genomes strains are a novel, multipurpose resource to advance the study of S. cerevisiae population genetics, quantitative genetics, and the emergence of an opportunistic pathogen.
Research on Saccharomyces cerevisiae, the most extensively characterized model eukaryote, has historically focused on a very small number of strains, or genetic backgrounds. In particular, most research has focused on the laboratory strain S288c, the first eukaryotic genome to be completely sequenced, assembled, and annotated (Goffeau et al. 1996) and thus the reference S. cerevisiae genome (Engel et al. 2014). However, as with all species, there is more to S. cerevisiae than one strain. For example, array analyses (Muller and McCusker 2009b, 2011; Schacherer et al. 2009; Muller et al. 2011; Dunn et al. 2012), low coverage sequencing (Liti et al. 2009), and higher coverage sequencing (Wei et al. 2007; Doniger et al. 2008; Dowell et al. 2010; Skelly et al. 2013; Bergstrom et al. 2014) of a limited number of additional S. cerevisiae strains identified extensive sequence variation. Studies of S. cerevisiae genetic variation and its influence on phenotypic variation have been limited by the modest number of high quality, complete, assembled, and annotated genome sequences. To address these limitations, we describe here the sequencing, and subsequent de novo, high quality, and extensively manually edited assembly and annotation of the genomes of 93 S. cerevisiae strains of multiple geographic and environmental origins.
In addition to isolation from traditional, often human-associated environments (Mortimer and Johnston 1986; Mortimer and Polsinelli 1999; Sniegowski et al. 2002; Cromie et al. 2013), S. cerevisiae is isolated clinically, consistent with its being an emerging opportunistic pathogen (Murphy and Kavanagh 1999; Ponton et al. 2000; Silva et al. 2004; Enache-Angoulvant and Hennequin 2005; Munoz et al. 2005; McCusker 2006; Skovgaard 2007; Pfaller and Diekema 2010; Miceli et al. 2011; Chitasombat et al. 2012). Because a reasonable hypothesis is that human environment-associated S. cerevisiae give rise to clinical S. cerevisiae, we compare 57 nonclinical, mostly human environment-associated strains with 43 clinical strains to gain insight into the emergence of S. cerevisiae as an opportunistic pathogen.
These 93 highly accurate, assembled, and annotated genome sequences, together with the genome sequences of S288c (Goffeau et al. 1996), YJM789 (Wei et al. 2007), RM11-1a (RM11 2004), SK1 (Nishant et al. 2010), Σ1278b (Dowell et al. 2010), YPS163 (Doniger et al. 2008), and M22 (Doniger et al. 2008), constitute a novel, multipurpose genetic resource, the “100-genomes” strains. In addition to describing the sequences of the 93 genomes, we describe for the 100-genomes strains their population structure, multiple types of polymorphisms, chromosome rearrangements, aneuploidy, specific phenotypes, genotype-phenotype associations, as well as phenotypic differentiation between strains varying in population ancestry and in nonclinical vs. clinical origin.
Results
The 100-genomes strains—derivation, genome sequencing, assembly, and annotation
The 100-genomes strains and their parental isolates with geographic and environmental origins are shown in Supplemental Table S1. Definitions of S. cerevisiae “isolates” and “strains,” the derivation of strains, and the many advantages of strains over isolates are more fully described in the Supplemental Material. Briefly, isolates, which are isolated from different environments, vary in ploidy (Muller and McCusker 2009a) and are frequently heterozygous across much of their genomes (McCusker et al. 1994; Muller and McCusker 2009a; Esberg et al. 2011). Many isolates do not sporulate, and many isolates that do sporulate produce no or very few viable spores (McCusker et al. 1994; Muller and McCusker 2009a). Thus, for many isolates, genome assembly/annotation as well as many types of genetic analysis would be highly problematic. Therefore, rather than isolates, we focus on segregants of sporulation-positive isolates (one segregant per isolate), which we define as strains. Strains greatly simplify genome assembly/annotation and association analysis. The 100-genomes strains were placed into five populations and one mosaic group, as described below. Strains from both natural (e.g., fruit; n = 57) and clinical (i.e., human body sites; n = 43) environments were chosen to provide insight into the emergence of S. cerevisiae as an opportunistic pathogen, as described below.
Genome sequencing, assembly, and annotation of 93 strains are fully described in the Supplemental Material. Briefly, based on 101 base pair paired-end reads, we produced the 93 de novo, high quality genome assemblies from 22- to 650-fold sequencing coverage per strain (average = 183.6-fold; median = 117.4-fold sequencing coverage) (Supplemental Table S2). To insure that the sequences generated corresponded to the initial strains, validation was performed using PCR primer pairs (Supplemental Table S3) to assess restriction fragment length polymorphisms. In the 93 genomes, we identified small numbers of ambiguous sites (N's, ambiguity codons) and unassembled loci, mostly unassembled repetitive telomeric/subtelomeric sequences (Supplemental Table S2). Only a small fraction of the total errors (0.2%–0.6% per genome) occur in protein-coding genes, with the remainder occurring in microsatellite sequences, misassembly of nearly identical repeat sequences, as well as repetitive telomeric/subtelomeric sequences. Approximately 17–114 kb of sequences per genome, consisting primarily of telomeric and subtelomeric repeat sequences, are not included in the assemblies. Thus, with the exception of incompletely assembled repetitive subtelomeric regions, our 93 de novo assemblies approach the quality of the reference S288c genome.
Genetic assessment of chromosome colinearity/rearrangements in the 100-genomes strains
Due to the limitations of short-read sequencing, chromosomes could not be assembled across multicopy sequences. To determine whether the chromosomes of the 100-genomes strains were colinear (excluding subtelomeric regions lacking essential genes) with or contained chromosome rearrangements relative to the reference S288c genome, we genetically assessed chromosome colinearity/rearrangements (Supplemental Material). Briefly, we crossed haploid spores of all 100 strains with a haploid S288c background strain, sporulated the diploids, dissected tetrads, and assessed spore viabilities and spore viability patterns (Supplemental Table S4). The high spore viabilities observed in 79 of the 100 crosses (79.7%–97.4%) are consistent with all of the chromosomes of these 79 strains being colinear (excluding subtelomeric regions lacking essential genes) with the S288c reference. In contrast, both the low spore viabilities (5.5%–71.3%) and the diagnostic spore viability patterns observed in the remaining 21 of the 100 crosses are consistent with these 21 strains having chromosome rearrangement(s) relative to the S288c reference (Supplemental Material). For 13 of these 21 strains, both the percent spore viabilities (51.6%–71.3%) and the diagnostic spore viability patterns observed in crosses were consistent with reciprocal translocations with essential genes distal to only one translocation breakpoint. In 12 of these 13 strains, we identified a chromosome 8–16 reciprocal translocation with an ECM34-SSU1 breakpoint (Supplemental Material; Supplemental Table S4; Perez-Ortin et al. 2002); there are essential genes distal to SSU1 but not ECM34.
Genome sequence data defines multiple types of genetic variation
We utilized the assembled genomes of the 93 strains to annotate multiple types of sequence variation; identify aneuploidy; identify GO, population, and clinical origin associations; and compile specific sets of sequence variants (Supplemental Material; Supplemental Table S5–S13). Based on sequence read depths, 86 of the 93 strains are euploid and seven strains (7.5%) are aneuploid, with gains of part of a chromosome or for entire chromosomes (Supplemental Fig. S1). YJM326 contains a segmental duplication (i.e., partially aneuploid) for chromosome 7L (1–411 kb), with no polymorphisms between copies of the segmentally duplicated genes. The remaining six strains are aneuploid for one or multiple whole chromosomes, with no heterozygous polymorphisms on the aneuploid chromosomes.
Supplemental Table S8 summarizes single nucleotide polymorphisms (SNPs) and insertions-deletions (indels). The average numbers of SNPs and indels relative to S288c are 78,184 and 7840, respectively. We examined 4522, intron- and indel-free, single copy, protein-encoding genes for open reading frames (ORFs) length polymorphisms arising from frameshift and/or premature stop codon polymorphisms (Supplemental Material; Supplemental Table S12). Five hundred and seventy-six genes had ORF length polymorphisms; of these, in 57 genes the S288c ORF length was a minority allele or private allele. Thirty-five genes with frameshift and/or length polymorphisms were annotated as essential. Relative to the reference S288c genome, we determined that 61 genes were absent from some of the 93 strains, and 219 genes, including many novel genes, were present in some of the 93 strains.
We analyzed 32 genes that have been previously identified as having phenotypically relevant polymorphisms. For six of these 32 genes (NCS2, AQY1, AQY2, RSF1, RME1, TAO3), in addition to the previously identified, phenotypically relevant polymorphisms, other likely inactivating polymorphisms (i.e., frameshift, premature stop, deletions) were identified in some strains (Supplemental Material; Supplemental Table S13). In contrast, many others of these previously identified, phenotypically relevant polymorphisms are found in very few strains or were private to one strain. In particular, previously identified, phenotypically relevant polymorphisms in MKT1, SSD1, MIP1, AMN1, FLO8, HAP1, BUL2, and SAL1 are private to the frequently used, long-term laboratory domesticated S288c and/or its close relative W303 (Supplemental Material).
We searched the 93 genomes for highly diverged regions with low (70%–95%) sequence similarity to the syntenic region of the reference S288c genome and found many examples of highly diverged syntenic (putatively introgressed) genes (Supplemental Material). Most chromosomal regions are highly similar (99%–100% identity) to each other and to S288c (for example, see Supplemental Fig. S2A). However, we identified 141 syntenic, highly diverged regions, which ranged in length from 1 kb to 28 kb and contained from one to 16 protein-coding genes, with 70%–95% sequence identity to the corresponding S288c sequences. These 141 syntenic, highly diverged regions contained 401 protein-coding gene sequences, the genomic locations of which are distributed across the genome (Supplemental Table S5). Of the 401 highly diverged genes, 83 genes had low (70%–95%) similarity to sequenced Saccharomyces species, suggesting introgression from one or more unsequenced species of Saccharomyces. The remaining 318 highly diverged genes had high (>96% identity) similarity to the syntenic region of S. paradoxus, consistent with S. paradoxus introgression (for example, see Supplemental Fig. S2B). The size of an introgression often varied between strains (Supplemental Fig. S3), consistent with size reduction by recombination.
While 90 of the 93 strains had 1–26 introgressed genes relative to S288c, three strains (YJM1078, YJM1252, and YJM248) had 214–244 introgressed genes (Supplemental Table S5). For these three strains, most of the introgressed genes are shared and have high sequence similarity to S. paradoxus, suggesting that these strains derived from a single, recent inter-specific hybridization event. One hundred twenty-four introgressed genes were in only one of the 93 strains; 260 introgressed genes were in 2–8 strains; and 17 introgressed genes were in 12–87 strains. In the case of YHL008C, the S288c-like sequence was in only seven of the 100 strains (Supplemental Fig. S2C). In the case of ZRT1, polymorphisms in which have been previously described (Engle and Fay 2013), the S288c-like sequence was in only 20 of the 100 strains (Supplemental Fig. S2D).
Using the Saccharomyces Genome Database Gene Ontology Term Finder, we assessed the Gene Ontology (GO) of the introgressed genes (Supplemental Table S6). Among the introgressed genes, the frequency of eight loci differed significantly between populations (Fisher's exact test, Bonferroni correction; populations defined using structure results as described in Supplemental Material), and between strains of clinical and nonclinical origin for an additional locus (Fisher's exact test, Bonferroni correction, no population structure correction) (Supplemental Table S7). In particular, the 14 strains with introgressed PDR5, all of which are in the mosaic group (Fig. 1), are of clinical origin (P = 0.0120).
Figure 1.

Putative introgressed PDR5 gene. (A) Neighbor-joining tree of the PDR5 ORF from 100 S. cerevisiae strains and sibling species with bootstrap values shows two clusters of this sequence. The group 1 cluster containing the putative introgressed PDR5 consists of 14 strains that are both clinical in origin and in the mosaic population. The group 2 cluster consists of sequences from 86 strains including S288c. (B) Comparison of DNA and protein sequences between YJM1133 (with putative introgressed PDR5) and S288c. The tick marks indicate polymorphisms.
ENA and CUP1 tandem copy number variation, sequence variation, and recombination
Our data allowed us to precisely determine copy number of multicopy genes, including the P-type ATPase Li+/Na+ pump-encoding ENA gene, which has been previously determined in very few strains (Haro et al. 1991; Wieland et al. 1995; Daran-Lapujade et al. 2009). Based on sequence coverage relative to flanking single-copy sequences, we determined that ENA copy number in the 93 strains ranged from one copy (45 strains) to 14 copies (Supplemental Table S14). Of 49 multicopy ENA strains, including S288c, all had the same size ENA repeat (3893 bp). Similar to previous lower sequence coverage studies of smaller numbers of strains (Doniger et al. 2008; Warringer et al. 2011), all 49 multicopy ENA strains had recombinant (portions of ENA6 with one of three types of S. paradoxus ENA genes) ENA genotypes (Fig. 2; Supplemental Fig. S4; Supplemental Tables S5, S14). Similar to a previous five-strain study (Doniger et al. 2008; Warringer et al. 2011), S. paradoxus sequence similarity in these 49 strains extended to the proximal ARO3-EHD3-KRS1 genes (Fig. 2; Supplemental Fig. S5, S6). In contrast, in the 45 single-copy ENA strains, most of the ENA genes had high sequence similarity to ENA6 (Daran-Lapujade et al. 2009), and the contiguous ARO3-EHD3-KRS1-ENA genes had, to varying extents, low S. paradoxus sequence similarity. Based on our full assemblies and extensive annotation of the region, we identified extensive recombination between introgressed S. paradoxus and S. cerevisiae sequences in ENA and proximal genes (Fig. 2; Supplemental Tables S5, S14).
Figure 2.
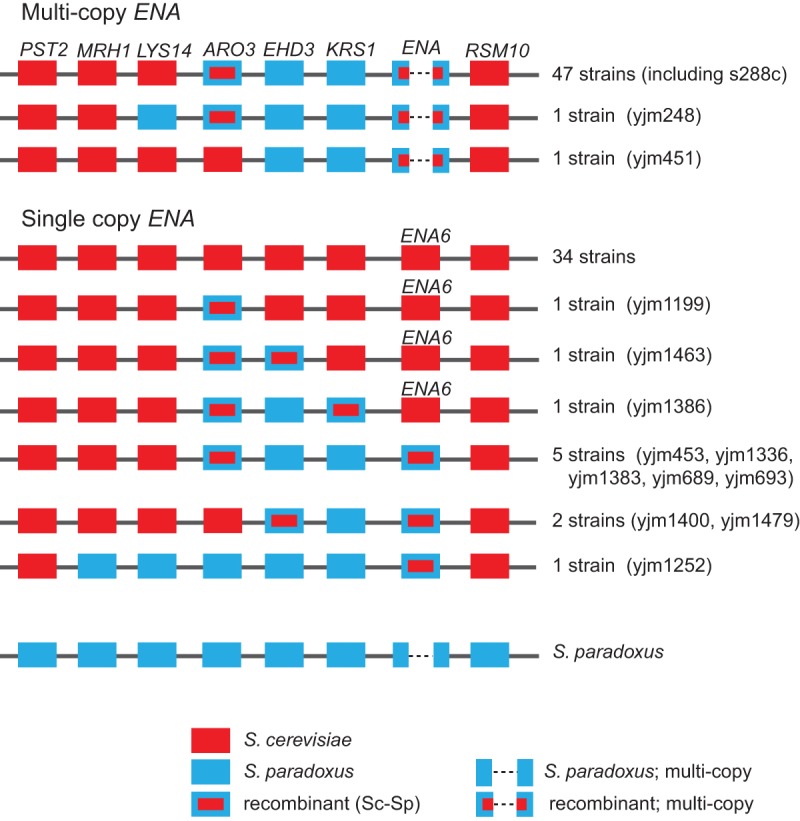
Structure of an introgressed cluster of ORFs. The reference strains S288c and 46 other strains have introgressed two ORFs (EHD3 and KRS1) from S. paradoxus, while the other two ORFs (ARO3 and ENA) are recombinant types. There are 34 strains with no S. paradoxus type sequences in this region, while one strain (YJM1252) has the most number of ORFs that are introgressed from S. paradoxus. The remaining strains have different combinations of introgressed and recombinant ORFs as shown.
Similarly, CUP1 copy number has been precisely determined in very few strains (Fogel and Welch 1982; Hamer et al. 1985; Zhao et al. 2014). Based on CUP1 sequence coverage relative to flanking single-copy sequences, CUP1 copy number in the 93 strains varied from one copy (28 strains) to 18 copies (Supplemental Table S15). In the 66 strains, including S288c, with ≥2 copies of CUP1, five different (i.e., breakpoints and repeat lengths) types of CUP1 repeats were identified (Supplemental Table S15). In the 66 strains with ≥2 copies of CUP1, 57 strains had one type of CUP1 repeat and nine strains had two types of CUP1 repeats (Supplemental Table S15), the latter being consistent with recombination between different types of CUP1 repeats.
Population structure and principal component analysis
We used model-based clustering, as implemented in structure (Pritchard et al. 2000), to analyze the population structure of the 100-genomes strains (Fig. 3). Similar to previous studies (Liti et al. 2009; Schacherer et al. 2009), some strains had ancestry corresponding largely to a single population, while other strains were admixed “mosaics” with ancestry from two or more populations (Fig. 3). Five of the populations, and the mosaic group, correspond to those previously reported (Liti et al. 2009), and we use the same names. The sixth population, contributing partial ancestry predominantly to mosaic strains in our data set, was not identified by Liti et al. (2009) but corresponds well with the two human-associated populations identified by Cromie et al. (2013). Specifically, we observed strong correlation (Pearson correlation 0.737, Spearman rank correlation 0.783) between fractional ancestry of our sixth population and summed fractional ancestry of both human-associated populations identified by Cromie et al. (2013). Thus, as per Cromie et al. (2013), we refer to this sixth population as human-associated.
Figure 3.
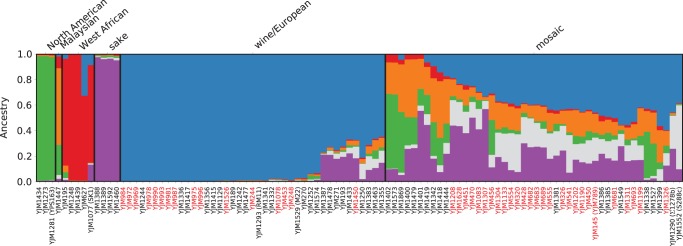
Population structure of the 100-genomes S. cerevisiae strains. Population structure inferred for 100 S. cerevisiae strains using the program structure (Pritchard et al. 2000). Each strain is represented by a single vertical line, which depicts fractional population ancestry from each of K = 6 subpopulations denoted by colors: green (North American), orange (Malaysian), red (West African), purple (sake), blue (wine/European), and gray (human-associated). Black boxes delineate the six strain populations. A threshold of 60% ancestry from any single population was used to construct groupings, except for mosaic strains that have <60% ancestry from any of the other five populations. Strain names in black and red indicate nonclinical and clinical environmental origin strains, respectively.
Supplemental Figure S7 imposes population structure assignments on a map of collection locations, where known, for the isolates from which the 100-genomes strains were derived. As reported by Cromie et al. (2013), strain diversity is primarily driven by geography and human-associated admixture. Of the 100-genomes strains, the largest group of strains with ancestry from a single population is the wine/European population (N = 41). The majority of the remaining strains (N = 46) are mosaics; for mosaics, the wine/European population contributed the largest total portion of ancestry (mean 34%), with slightly less ancestry contributed by the sake, Malaysian, human-associated, and North American populations (mean 22%–11%) and little West African population ancestry (mean 2%). Based on sequences extracted from each of the 16 chromosomes of each strain (total = 218 kb; 124 protein-coding genes) (Supplemental Material; Supplemental Table S16), principal component analysis of the sequence identity values (Supplemental Fig. S8), and a phylogeny (Fig. 4) using the SNPs in the 218-kb region, show the clustering of the six populations identified in the population structure analysis and clusters of clinically and nonclinically derived strains. Of the 100-genomes strains, 43 are clinically derived, all of which fell into either the wine/European (N = 16) population or the mosaic group (N = 27). Clinically derived strains constituted 59% of the mosaic group (P = 0.00233, Fisher's exact test).
Figure 4.

Phylogeny of 94 S. cerevisiae strains. Neighbor-joining tree of 93 S. cerevisiae strains plus S288c using 218 kb (total) of sequence (excluding introgressions and large indels) gathered from all 16 chromosomes.
Genotype-phenotype associations in the 100 strains
We measured 49 phenotypes in the 100-genomes strains (Supplemental Material). Phenotypic variability was pervasive and in most cases quantitative (Supplemental Table S17; Supplemental Fig. S9). We carried out genotype-phenotype association mapping to identify loci contributing to this phenotypic variation. For this analysis, we focused on common variation (minor allele frequency ≥5%) and tested ∼158,000 biallelic SNPs and indels; the presence/absence of 28 genes annotated in the reference S288c strain but missing from other members of the 100-genomes strains; 32 introgressed loci; 108 genes missing from or not annotated in S288c; and 150 genes with frameshift or premature termination codon polymorphisms. Of the many genotype-phenotype associations (Supplemental Table S18), we focus below on five genotype associations with P-values lower than an approximate Bonferroni threshold of P < 4 × 10⁻⁷ that also have clear biological connections to the phenotypes. With the exception of Warringer et al. (2011), the cited studies are not population genetic analyses and are cited to demonstrate gene-phenotype biological connections.
First, growth on 6 mM sulfite was associated (P < 10−14) with many SNPs at SSU1 and ECM34, genes implicated in a sulfite resistance-conferring chromosome 8–16 translocation (Perez-Ortin et al. 2002). The ECM34-SSU1 translocation, which is in 12 strains (Supplemental Material; Supplemental Table S4) and explains ∼70% of the 6 mM sulfite growth variation (R2 = 0.71), also showed association (P = 6.3 × 10⁻²⁸) (Fig. 5; Supplemental Table S18).
Figure 5.

Sulfite resistance phenotypes of the 100-genomes S. cerevisiae strains. Colony area as a measure of sulfite resistance (3 mM: gray bars; 6 mM: black bars). Strains are arranged by population structure. Strains with the ECM34-SSU1 translocation show higher sulfite resistance than those without the translocation.
Second, consistent with previous work (Haro et al. 1991; Martinez et al. 1991; Wieland et al. 1995; Daran-Lapujade et al. 2009; Warringer et al. 2011), we found lithium resistance association with both SNPs (P = 7.4 × 10⁻⁸) and copy number (P = 5.0 × 10⁻¹⁰) of the P-type ATPase Li+/Na+ pump-encoding ENA gene (Supplemental Table S18). ENA explains ∼40% (R2 = 0.40) of the lithium resistance variation.
Third, consistent with previous work (Fogel and Welch 1982; Hamer et al. 1985; Fogel et al. 1988; Warringer et al. 2011), we found association between CUP1 copy number (Supplemental Table S18) and copper resistance (0.1 mM, P = 1.9 × 10⁻¹⁷). Consistent with CUP1 having undergone five independent amplification events, no linked polymorphisms associated with CUP1 copy number. In 97 strains with known CUP1 gene copy number (the 93 strains plus YJM1077 and YJM1281, shown by PCR to have one copy of CUP1; YJM789 [seven copies of CUP1] [Zhao et al. 2014]; and YJM1552 [14 copies of CUP1 in the S288c background] [Zhao et al. 2014]) (Supplemental Table S15), CUP1 gene copy number explained ∼50% of variation in copper resistance (R2 = 0.52) (Fig. 6).
Figure 6.
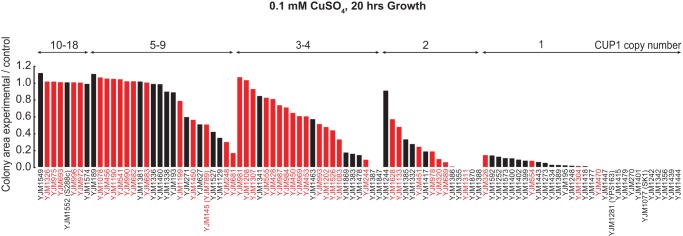
Copper resistance phenotypes of the 100-genomes S. cerevisiae strains. Colony area as a measure of copper resistance in 96 S. cerevisiae strains at 0.1 mM CuSO4 concentration. Strains are arranged according to the CUP1 copy number, then to colony size. Increase in CUP1 copy number increases resistance to copper, although there are also CUP1 copy number-independent contributions. Red bars denote clinical strains and black bars denote nonclinical strains.
Fourth, consistent with previous work (Winzeler et al. 1998; Wei et al. 2007; Guan et al. 2010), we found association between the multidrug transporter PDR5 and resistance to the translation inhibitor cycloheximide and to the clinically used ergosterol synthesis inhibitor ketoconazole. In contrast with Guan et al. (2010), we did not detect association between PDR5 and amphotericin B resistance. However, in agreement with Guan et al. (2010), we observed association (P = 5.3 × 10⁻⁹) between the introgressed PDR5 and 10 mM ketoconazole sensitivity, with this locus explaining one-third of growth variation between strains (R2 = 0.33). Moreover, we found a strong association (P = 4.2 × 10⁻¹²) between the introgressed PDR5 and 0.25 mM cycloheximide sensitivity (Fig. 7; Supplemental Table S18), with this locus explaining almost half of the variation between strains (R2 = 0.46).
Figure 7.
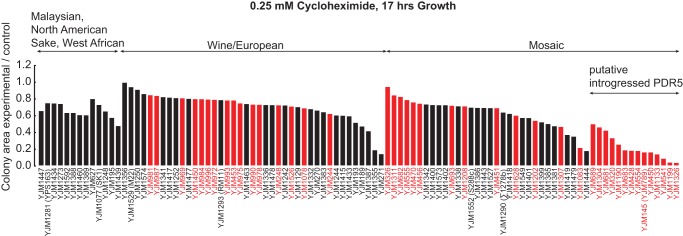
Cycloheximide resistance phenotypes of the 100-genomes S. cerevisiae strains. Colony area as a measure of cycloheximide resistance in 100 S. cerevisiae strains at 0.25 mM cycloheximide concentration. Strains are arranged according to the population structure, then to the presence/absence of the putatively introgressed PDR5, then to colony size. Strains having the putatively introgressed PDR5 are more sensitive to cycloheximide. Red bars denote clinical strains and black bars denote nonclinical strains.
Finally, for growth in medium lacking pyridoxine, we identified association with four SNPs in and surrounding the gene SNZ1, the sole copy of SNZ required for pyridoxine biosynthesis (Rodriguez-Navarro et al. 2002). The SNP with the strongest association (G53A; P = 6.8 × 10⁻¹⁴) results in an amino acid substitution (G18D) in SNZ1. We identified the G18D substitution as likely to have a strong effect on protein function using computational predictions (Choi et al. 2012), with the G18D substitution ranked as most likely to be deleterious out of 22 nonsynonymous variants in SNZ1 present among the 100 strains. The G53A SNP explains >40% of variation between strains in growth on media lacking pyridoxine (R2 = 0.44). This is the first report that natural variation in SNZ1 underlies phenotypic variation among natural yeast strains.
Phenotypic differentiation between strains varying in population ancestry
In 99 of the 100-genomes strains (excluding the single Malaysian population strain), we tested for phenotypic differences associated with strains with different population ancestries. Of 49 phenotypes, eight showed significant differences between populations (Table 1). On medium lacking pantothenate, wine/European population strains had lower mean growth (80.1% relative to control) compared to all other populations (mean ranging from 88.1% for mosaic group strains to 100% for sake population strains). Similar to Warringer et al. (2011), on medium containing LiCl, wine/European population strains had higher mean growth (73.2% relative to control) compared to all other populations (mean ranging from 4.6% for West African population strains to 62.6% for sake population strains). For growth at low and high temperatures in different media, we observed significant phenotypic differences between populations (Table 1).
Table 1.
Significant phenotypic differences between strains of different population ancestries or clinical/nonclinical origin
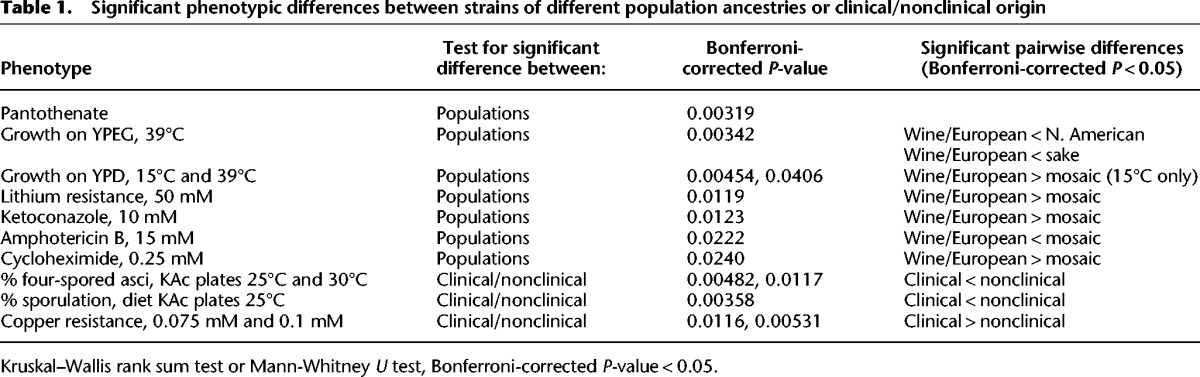
Lastly, we found significant differences between populations in resistance to ketoconazole, cycloheximide, and amphotericin B that are largely driven by pairwise significant differences between the well-sampled wine/European population and mosaic group strains. Relative to mosaic group strains, wine/European population strains had significantly higher resistance to cycloheximide (mean 71.5% vs. 51.1%) and significantly lower resistance to amphotericin B (mean 54.7% vs. 72.5%). For cycloheximide and ketoconazole sensitivity, the introgressed PDR5, which is found only in mosaic group strains (Fig. 7), accounts for the bulk of the phenotypic difference between populations; any additional contribution of population is not significant for cycloheximide and only marginally significant for ketoconazole (ANOVA, P = 0.046). Consistent with the lack of association between amphotericin B resistance and PDR5 (see above), and after accounting for any PDR5 contribution, population contributes significantly to amphotericin B resistance (ANOVA, P = 0.0041) (Table 1).
Phenotypic differentiation between strains of nonclinical vs. clinical origin
We identified two significant phenotypic differences between strains of clinical and nonclinical origin. First, we found that clinical origin strains sporulate at significantly reduced frequencies in three of six tested conditions (Table 1). Second, we found that clinical origin strains are significantly more copper resistant than nonclinical strains (mean 62.1% vs. 31.5% in 0.1 mM CuSO4) (Table 1). As expected given the association between copper resistance and CUP1 copy number, clinical strains had significantly more copies of CUP1 than nonclinical strains (median 4.0 vs. 2.0; Mann-Whitney U test, P = 0.00023). However, in addition to the CUP1 copy number contribution, clinical origin contributes significantly to the copper resistance phenotype (ANOVA, P = 0.0023) (Fig. 6).
Discussion
S. cerevisiae isolates vs. the 100-genomes strains—genome assembly, annotation, and use
We more fully define S. cerevisiae isolates and strains and describe the many advantages of strains over isolates in the Supplemental Material. Briefly, many S. cerevisiae isolates are sporulation-deficient and many sporulation-proficient isolates produce few or no viable spores; while useful for population genetic analysis, such S. cerevisiae isolates are poorly suited for classical and quantitative genetic analyses. In addition, many isolates are heterozygous across most of their genomes, which would greatly complicate genome assembly and annotation, as well as association studies. However, for those isolates that sporulate and produce viable spores, the resulting haploid and self-diploidized segregants are strains; the lack of heterozygosities in strains greatly simplifies genome assembly and annotation, which for our 93 strains approaches the quality of the reference S288c genome.
Natural selection acts on the phenotype of the isolate. For self-diploidized isolates, and isolates with few heterozygous polymorphisms, a single segregant (strain) identifies all, or almost all, of the genotypic and phenotypic diversity of the parental isolate. For multiply heterozygous isolates, a single segregant (strain) identifies a significant portion of the genotypic and phenotypic diversity of the parental isolate. In-depth phenotypic profiling of isolates and comparisons with multiple segregants (strains) from each isolate will be necessary for a more thorough understanding of the degree to which strain-level variation reflects selection on isolates. However, the significant genotypic and phenotypic associations of strains with populations and clinical/nonclinical origin likely reflect, in part, differences in selection on the parental isolates.
Chromosomal rearrangements, aneuploidy, and introgression
We find that the reference S288c genome structure is the most common in the 100-genomes strains (79 of 100 strains), although a significant fraction (21 of 100) of strains show evidence of chromosomal rearrangements. In the 93 strains, aneuploidy is less frequent (7.5%; 7 of 93) than chromosomal rearrangements, but our observed rate of aneuploidy may underestimate the true rate in environmental isolates due to our strain selection criteria. Both chromosomal rearrangements and aneuploidy should be considered in population and quantitative genetic studies, which is easily achieved with the 100-genomes strains.
We identified 401 putatively introgressed genes found in at least one of the 93 strains (Supplemental Table S5). The majority of these genes are likely derived from introgression with S. paradoxus, but a significant fraction (∼20%) of candidate introgressed genes appear to be derived from one or more as yet unsequenced species of Saccharomyces. We conclude that introgressed genes are common in S. cerevisiae and, in at least two cases (ENA, PDR5), have major phenotypic effects.
ENA copy number variation, introgression, and Li+ resistance in the 100-genomes strains
Relative to Warringer et al. (2011), we determined to a much higher degree of precision the numbers of the P-type ATPase Li+/Na+ pump-encoding ENA gene. In 49 strains with ≥2 tandem copies of ENA, we identified one type of ENA-containing repeat, consistent with one ENA amplification event. Similar to Warringer et al. (2011), we observed ENA association with Li+ resistance. Similar to previous studies (Doniger et al. 2008; Warringer et al. 2011), we observed introgression of S. paradoxus ENA and proximal sequences. However, relative to previous studies (Doniger et al. 2008; Warringer et al. 2011), our sequence coverage, assemblies, detailed annotation, and larger numbers of strains better identified extensive recombination between S. cerevisiae and S. paradoxus sequences in this region and identified two large classes of strains. First, there was an S288c-like class, consisting of 47 strains with recombinant ARO3, S. paradoxus-derived EHD3-KRS1, and recombinant, multicopy ENA. Second, there was a non-S288c-like class, consisting of 34 strains with ARO3-EHD3-KRS1 having low sequence similarity to S. paradoxus and single-copy ENA6 (Daran-Lapujade et al. 2009). We propose that the non-S288c-like class represents the ancestral S. cerevisiae sequences and that the S288c-like class represents S. paradoxus introgression.
CUP1 copy number variation, types of CUP1 repeats, and copper resistance in the 100-genomes strains
Relative to Warringer et al. (2011), we determined to a much higher degree of precision the numbers of the copper metallothionien-encoding gene CUP1. In 66 strains with ≥2 tandem copies of CUP1, we identified five types of CUP1 repeats (Supplemental Table S15), consistent with independent amplification events. Also consistent with five independent CUP1 amplification events, there was very little CUP1 sequence heterogeneity and no CUP1-linked SNPs associated with CUP1 copy number or with copper resistance. We hypothesize that independent CUP1 gene amplification events, and increased copper resistance, have been selected by the agricultural use of fungicidal copper salts (Borkow and Gabbay 2005; Holb 2009; Mackie et al. 2012) in natural S. cerevisiae environments.
Similar to Warringer et al. (2011), we observed CUP1 copy number association with copper resistance and that CUP1 copy number was responsible for ∼50% of copper resistance. However, in contrast to the two types of CUP1 repeats identified by Warringer et al. (2011), we identified five types of CUP1 repeats. Also in contrast to Warringer et al. (2011), we did not observe population association with either the type of CUP1 repeat or copper resistance. The different CUP1-related results of Warringer et al. (2011) and this study are due in part to sequence coverage differences (one- to fourfold [Liti et al. 2009] vs. 22- to 650-fold), and consequently improved assembly and annotation of genomes, as well as numbers of strains; other factors are discussed below.
Genotype-phenotype associations in the 100-genomes strains
In contrast to previous association studies in yeast, which have been limited in scope (Muller et al. 2011; Connelly and Akey 2012; Diao and Chen 2012) or dependent on additional linkage-based evidence for quantitative trait loci (Warringer et al. 2011), we sought to carry out an unbiased, genome-wide search for quantitative trait loci underlying diverse phenotypes. We considered this analysis to be exploratory in nature, since 100 strains constitute a limited sample size for association mapping. In simulations based on sequenced genomes, we found that the power to detect loci of large effect (>35%) is relatively high (>80% at uncorrected P < 1 × 10⁻⁷) (Supplemental Material). Due to the challenges of establishing a single significance threshold, uncorrected P-values were reported and we focused on loci likely to be true positives; that is, loci with clear mechanisms of action suggested from previous literature and with P-values much lower than an approximate Bonferroni level of P < 4 × 10⁻⁷.
For multiple phenotypes, we found few or no associations with P-values lower than an approximate Bonferroni threshold of P < 4 × 10⁻⁷ (Supplemental Table S18). For some other phenotypes (e.g., inositol and thiamine auxotrophy), we found many associations close to the approximate Bonferroni threshold of P < 4 × 10⁻⁷ but none with associations with much lower P-values (e.g., minimum P-value > 1 × 10⁻¹⁰); in all of these cases, the associations had very wide peaks (up to 100 kb) and/or lacked genes with clear biological connections to phenotype (Supplemental Table S18). These results illustrate the challenges of performing association mapping in a small, structured sample and suggest that variation in these phenotypes may not be governed by individual loci of large effect size. However, despite these challenges, we identified five robust genotype-phenotype associations: ECM34-SSU1 (SNPs, translocation) for sulfite resistance; ENA (copy number, SNPs) for Li+ resistance; CUP1 (copy number) for copper resistance; PDR5 (introgression) for cycloheximide and ketoconazole resistance; and a nonsynonymous SNP in SNZ1 for pyridoxine auxotrophy. Therefore, the 100-genomes strains can be used to perform unbiased, genome-wide searches for quantitative trait loci.
Population-phenotype associations in the 100-genomes strains
In contrast to Warringer et al. (2011), we identified relatively few phenotype associations with populations (Table 1), the reasons for which are biological and technical. First, our larger sample size (38 vs. 100 strains) likely includes more phenotypic outlier strains, with consequently increased intra-population phenotype variability and decreased population-phenotype association. Second, the two studies used different phenotyping methods (growth curves vs. colony size) and phenotype replication (n = 2 vs. n = 8 or 24). Third, we tested for an overall effect of population on each phenotype, which is underpowered for phenotypes specific to populations with small sample sizes (sake, North American, and West African), and used a relatively conservative nonparametric test and multiple testing corrections.
100-genomes strains’ insight into S. cerevisiae as an emerging opportunistic pathogen
S. cerevisiae is a human colonizer and pathogen. As Pfaller and Diekema (2010) state, “S. cerevisiae is a common colonizer of mucosal surfaces and part of the normal flora of the GI tract, the respiratory tract, and the vagina (Salonen et al. 2000). It accounts for 27% of clinical isolates of non-Candida, non-Cryptococcus yeasts in North America (Pfaller et al. 2007, 2009).” As a likely consequence of being a common colonizer, S. cerevisiae also causes infections, the incidence of which has increased (Enache-Angoulvant and Hennequin 2005; Pfaller and Diekema 2010). Like some of its relatives among the more commonly clinically observed Candida species, S. cerevisiae can be recovered from nonsterile (mucosal) and sterile (e.g., blood) body sites of both immune-deficient and immune-competent patients. S. cerevisiae and Candida infections have similar predisposing patient factors, such as immune deficiency, antibiotic treatment, and intravascular catheters (Enache-Angoulvant and Hennequin 2005; Pfaller and Diekema 2010; Miceli et al. 2011; Chitasombat et al. 2012). S. cerevisiae invasive infections and invasive candidiasis are clinically indistinguishable (Enache-Angoulvant and Hennequin 2005; Pfaller and Diekema 2010). Patient colonization by environmental S. cerevisiae can be oral, person-to-person, and nosocomial (Zerva et al. 1996; Salonen et al. 2000; Hennequin et al. 2001; Olver et al. 2002; Clemons et al. 2010). Finally, S. cerevisiae infections cause significant mortality (Pfaller and Diekema 2010; Chitasombat et al. 2012). Thus, S. cerevisiae is an emerging and often serious opportunistic pathogen (Murphy and Kavanagh 1999; Ponton et al. 2000; Silva et al. 2004; Enache-Angoulvant and Hennequin 2005; McCusker 2006; Pfaller and Diekema 2010; Miceli et al. 2011; Chitasombat et al. 2012).
While S. cerevisiae can be isolated from non-human-associated environments (e.g., Wang et al. 2012), nonclinical but human environment-associated S. cerevisiae (e.g., food, drink) are the most likely source of clinical S. cerevisiae. For this reason, comparison of non-human-associated environment S. cerevisiae with clinical S. cerevisiae likely would be uninformative and/or misleading as to S. cerevisiae becoming an opportunistic pathogen. Therefore, we compared 57 nonclinical, mostly human environment-associated strains with 43 clinical strains to gain insight into the emergence of S. cerevisiae as an opportunistic pathogen.
Although host factors clearly exist for S. cerevisiae infections (Enache-Angoulvant and Hennequin 2005; Pfaller and Diekema 2010; Miceli et al. 2011; Chitasombat et al. 2012), it seems likely that S. cerevisiae genotype and phenotype also play key roles in human colonization and subsequent infection. Consistent with the importance of S. cerevisiae genotype for human colonization/infection, environmental and clinical S. cerevisiae strains are genotypically distinct. First, clinically derived strains comprised 59% of the mosaic strains (P = 0.00233, Fisher's exact test). Clinical S. cerevisiae isolates tend to be multiply heterozygous (Muller and McCusker 2009a; Magwene et al. 2011), consistent with outcrossing between different S. cerevisiae populations and the clinical origin-mosaic group association. Similarly, in the human pathogens Toxoplasma gondii and Cryptococcus gattii, outcrossing between different populations results in progeny with mosaic genomes that have increased transmission, dissemination, and/or virulence phenotypes (Grigg and Suzuki 2003; Minot et al. 2012; Voelz et al. 2013). Therefore, the clinical origin-mosaic group association suggests that outcrossing between different S. cerevisiae populations leads to new allelic combinations that facilitate adaptation to novel niches (Magwene 2014), in this case increased transmission, dissemination, and/or fitness of S. cerevisiae in human host environments. Second, we found TCB2, BIO5, and PDR5 genotype-clinical origin associations (Supplemental Table S7). Finally, clinical origin strains have significantly higher numbers of the copper metallothionien-encoding gene CUP1 (median 4.0 vs. 2.0; Mann-Whitney U test, P = 0.00054).
Consistent with the importance of S. cerevisiae phenotype for human colonization/infection, environmental and clinical S. cerevisiae are also phenotypically distinct. First, there are significant differences in the virulence phenotypes of S. cerevisiae clinical and nonclinical isolates (Clemons et al. 1994). Second, in three of six tested conditions, the sporulation phenotypes of clinical origin strains are significantly reduced (Table 1), consistent with increased S. cerevisiae fitness in human host environments having an unexpected cost. Finally, the copper resistance of clinical origin strains is significantly higher (Table 1). In addition to clinical strains having higher CUP1 copy numbers than nonclinical strains, there is also a significant CUP1 copy number-independent, clinical origin-dependent contribution to copper resistance (ANOVA, P = 0.0023) (Fig. 6). Interestingly, copper resistance is necessary for the virulence of multiple species of bacteria (Hodgkinson and Petris 2012; Samanovic et al. 2012; Neyrolles et al. 2013) and the opportunistic pathogenic yeast Cryptococcus neoformans (Ding et al. 2013), likely due to macrophages using copper to kill pathogens. Our finding that S. cerevisiae copper resistance associates with clinical origin suggests that copper resistance is similarly relevant to S. cerevisiae survival in human hosts. S. cerevisiae copper resistance has likely been selected by the common and historically long-term use of copper salts as agricultural fungicides (Borkow and Gabbay 2005; Holb 2009; Mackie et al. 2012) in natural S. cerevisiae environments. Thus, environmentally selected copper resistance likely contributes to the emergence of S. cerevisiae as an opportunistic pathogen.
Conclusion
Combined with seven previously sequenced S. cerevisiae genomes, our 93 highly accurate, de novo assembled, extensively manually edited/annotated, and near-reference genome quality sequences constitute the 100-genomes strains. We placed the 100-genomes strains into five populations and a mosaic group, with most of the clinical origin strains being in the mosaic group. We identified abundant genetic variation in the 100-genomes strains. For many genetic variants, we identified significant GO, population, and clinical origin associations. Our phenotypic characterization of the 100-genomes strains identified significant genotype-, population-, and clinical origin-phenotype associations. In particular, the higher copper resistance of clinical origin strains provides novel insights into the emergence of S. cerevisiae as an opportunistic pathogen. In addition to population, genotype, phenotype, and clinical origin association studies, the 100-genomes strains can be used for classical genetic studies, which have previously been limited to laboratory strains, and for quantitative genetic studies. Thus, the 100-genomes strains are a novel, valuable, multipurpose genetic resource.
Methods
Strains
Supplemental Table S1 lists the 93 S. cerevisiae strains sequenced in this study and seven strains that are isogenic with strains sequenced in other studies (Goffeau et al. 1996; RM11 2004; Wei et al. 2007; Doniger et al. 2008; Dowell et al. 2010; Nishant et al. 2010). All sequence-based analyses in this study are on the genomes of the 93 sequenced strains, as well as the reference S288c genome; all phenotypic and association analyses include all 100 strains, unless otherwise noted. The rationales for the 93 homozygous diploid strains (instead of their parental isolates), strain choices, the methods used to generate the 100 homozygous diploid S. cerevisiae strains, and the diverse geographic and environmental origins of the 100-genomes strains are described in detail in the Supplemental Material. The 100-genomes and other strains listed in Supplemental Table S1 are available from the Fungal Genetics Stock Center (McCluskey et al. 2010).
Genome sequencing and analysis
Genome sequencing, assembly, editing, and annotation, as well as identification of novel genes, introgression events, aneuploidy, genomic rearrangements, and genetic assessment of chromosome colinearity were carried out as described in the Supplemental Material. Briefly, DNA from the 93 strains was sequenced (Illumina HiSeq 2000, paired-end reads of 101 × 101 bases, average insert size of 300 bases). ABySS (v1.3.4) was used to assemble read pairs. BLAST (Altschul et al. 1990) was used to assemble contigs into chromosomes using synteny with S288c. The assembled chromosomes were aligned to S288c chromosomes using LAGAN (Brudno et al. 2003) to extrapolate the coordinates of the annotated sequences, and a table file was created using a Perl script. The table file was then utilized by the NCBI tool tbl2asn (http://www.ncbi.nlm.nih.gov/genbank/tbl2asn2/) to annotate each chromosome of each strain.
Highly conserved regions from each chromosome, totaling to 218 kb and including 124 protein-coding genes and intergenic regions, were extracted. SNP and indel polymorphisms relative to S288c were identified using LAGAN (Brudno et al. 2003) and Perl (see Supplemental Table S16). Phylogenetic analysis of the 218-kb regions was carried out using ClustalW v2.1 (Larkin et al. 2007), and principal component analysis was carried out using the pairwise sequence identity across all strains employing the prcomp function in the R package (R Core Team 2014). Introgression analysis is based on homology (75%–96% identity with S288c; 98%–99% identity with one of the sibling species) using the program ssearch36 (Smith and Waterman 1981) and BLAST (Altschul et al. 1990).
Phenotyping of the 100-genomes strains
We determined multiple phenotypes of the 100-genomes strains (Supplemental Table S17). Low-throughput phenotypes included sporulation (six conditions), flocculation, and biofilm formation. High-throughout phenotypes (i.e., robotic handling of strains, quantitative image analysis) included growth at different temperatures, requirements for individual vitamins, and resistance to multiple inhibitors. For high-throughput phenotypes, liquid-grown yeast strains were transferred (BM5 robot, S&P Robotics Inc.) onto rectangular agar plates (Greiner Bio-One, Cat. No 781186) at a density of 1536 dots per plate. To minimize colony position effects (i.e., plate edge vs. internal area; colony neighborhood), for each tested strain, 24 replicates were plated as 6 × 4 blocks, and only the eight colonies internal to each block were scored. Plates were incubated for 1–3 d and imaged every 24 h using the BM5 robot digital camera. Colony areas (i.e., phenotypes) were quantified using ImageJ 1.47v (http://imagej.nih.gov/ij/index.html) and Patch Detector Plus plug-in (University of Graz Microscopy Facility website: http://microscopy.uni-graz.at/index.php?item=new1). Thus, for each strain, we calculated the ratio of the median colony area (obtained in eight internal colony replicates) observed on experimental phenotype-tester plates to the median colony area (obtained in eight internal colony replicates) observed on control plates. These ratios were used to quantify and compare the phenotypes among individual strains. For phenotype rationales and detailed phenotyping methods descriptions, see Supplemental Material.
Population structure analysis and association testing
To examine population structure and conduct association tests in the 100 genomes, we called genetic variants using short reads and a common reference genome (S288c, SGD release 64). Briefly, short reads were aligned to the yeast reference genome using BWA version 0.7.4 (Li and Durbin 2009). For previously sequenced genomes, we performed in silico shredding of the genome sequence to simulate short reads (Supplemental Material). Freebayes 0.9.9 (Garrison and Marth 2012) was used to obtain SNP and indel calls. structure version 2.3.4 (Pritchard et al. 2000) was used to infer population structure and assign individual strains to populations, with a burn-in period of at least 200,000 iterations and a minimum of 1,000,000 iterations of MCMC post-burn-in (Supplemental Material).
Genome-wide association mapping is feasible in S. cerevisiae but requires population structure corrections (Connelly and Akey 2012; Diao and Chen 2012). To conduct marker-trait association tests, we tested for association at all variation with a minor allele frequency of at least 5%, using the program GEMMA version 0.94beta, which is a mixed model approach that corrects for sample relatedness and population stratification (Zhou and Stephens 2012). To examine the power and false positive rate for tests of genotype-phenotype association, we used our actual genotype data and simulated phenotype data for causal alleles with a range of effect sizes (Supplemental Material). Simulations revealed that despite our analysis having the power to detect loci of large effect, false positives could arise even at very low significance thresholds (Supplemental Material; Supplemental Fig. S11).
Data access
The genome sequence data from this study have been submitted to GenBank (http://www.ncbi.nlm.nih.gov/genbank). The accession numbers are listed in Supplemental Table S19. All strains used in this study have been deposited to the Fungal Genetic Stock Center (http://www.fgsc.net). The strain names are listed in Supplemental Table S1.
Supplementary Material
Acknowledgments
This work was funded by NIH grant R01 GM098287 (awarded to J.H.M., F.S.D., P.M.M., and E.A.S.). P.K.S. was supported as a fellow of the Tri-Institutional Molecular Mycology and Pathogenesis Training Program (MMPTP) supported by NIH/NIAID T32 award AI052080-11. We thank the multiple culture collection curators and many colleagues who provided the S. cerevisiae isolates (Supplemental Table S1) used to generate the strains sequenced in this work. We also thank J. Heitman, S. Jinks-Robertson, and T. Petes for their helpful comments. Finally, we thank David Goldstein and Kevin Shianna for advice and work in generating the raw Illumina sequence data; C. Pastoor for his sporulation phenotyping of some strains; as well as Mark DeLong and Josh Granek for helpful discussions on this work.
Author contributions: P.K.S.: genome assembly/annotation/analyses, principal component analysis, writing; D.A.S.: population structure, associations, writing; S.G.K.: DNA preparation, genotyping, all nonsporulation phenotypes; G.M.: sporulation phenotypes; E.A.S.: population structure, associations; P.M.M.: population structure, associations; F.S.D.: genome assembly/annotation/analyses; J.H.M.: strain construction, genetic assessment of chromosome colinearity, writing.
Footnotes
[Supplemental material is available for this article.]
Article published online before print. Article, supplemental material, and publication date are at http://www.genome.org/cgi/doi/10.1101/gr.185538.114.
References
- Altschul SF, Gish W, Miller W, Myers EW, Lipman DJ. 1990. Basic local alignment search tool. J Mol Biol 215: 403–410. [DOI] [PubMed] [Google Scholar]
- Bergstrom A, Simpson JT, Salinas F, Barre B, Parts L, Zia A, Nguyen Ba AN, Moses AM, Louis EJ, Mustonen V, et al. 2014. A high-definition view of functional genetic variation from natural yeast genomes. Mol Biol Evol 31: 872–888. [DOI] [PMC free article] [PubMed] [Google Scholar]
- Borkow G, Gabbay J. 2005. Copper as a biocidal tool. Curr Med Chem 12: 2163–2175. [DOI] [PubMed] [Google Scholar]
- Brudno M, Do CB, Cooper GM, Kim MF, Davydov E, Program NCS, Green ED, Sidow A, Batzoglou S. 2003. LAGAN and Multi-LAGAN: efficient tools for large-scale multiple alignment of genomic DNA. Genome Res 13: 721–731. [DOI] [PMC free article] [PubMed] [Google Scholar]
- Chitasombat MN, Kofteridis DP, Jiang Y, Tarrand J, Lewis RE, Kontoyiannis DP. 2012. Rare opportunistic (non-Candida, non-Cryptococcus) yeast bloodstream infections in patients with cancer. J Infect 64: 68–75. [DOI] [PMC free article] [PubMed] [Google Scholar]
- Choi Y, Sims GE, Murphy S, Miller JR, Chan AP. 2012. Predicting the functional effect of amino acid substitutions and indels. PLoS One 7: e46688. [DOI] [PMC free article] [PubMed] [Google Scholar]
- Clemons KV, McCusker JH, Davis RW, Stevens DA. 1994. Comparative pathogenesis of clinical and nonclinical isolates of Saccharomyces cerevisiae. J Infect Dis 169: 859–867. [DOI] [PubMed] [Google Scholar]
- Clemons KV, Salonen JH, Issakainen J, Nikoskelainen J, McCullough MJ, Jorge JJ, Stevens DA. 2010. Molecular epidemiology of Saccharomyces cerevisiae in an immunocompromised host unit. Diagn Microbiol Infect Dis 68: 220–227. [DOI] [PubMed] [Google Scholar]
- Connelly CF, Akey JM. 2012. On the prospects of whole-genome association mapping in Saccharomyces cerevisiae. Genetics 191: 1345–1353. [DOI] [PMC free article] [PubMed] [Google Scholar]
- Cromie GA, Hyma KE, Ludlow CL, Garmendia-Torres C, Gilbert TL, May P, Huang AA, Dudley AM, Fay JC. 2013. Genomic sequence diversity and population structure of Saccharomyces cerevisiae assessed by RAD-seq. G3 (Bethesda) 3: 2163–2171. [DOI] [PMC free article] [PubMed] [Google Scholar]
- Daran-Lapujade P, Daran JM, Luttik MA, Almering MJ, Pronk JT, Kotter P. 2009. An atypical PMR2 locus is responsible for hypersensitivity to sodium and lithium cations in the laboratory strain Saccharomyces cerevisiae CEN.PK113-7D. FEMS Yeast Res 9: 789–792. [DOI] [PubMed] [Google Scholar]
- Diao L, Chen KC. 2012. Local ancestry corrects for population structure in Saccharomyces cerevisiae genome-wide association studies. Genetics 192: 1503–1511. [DOI] [PMC free article] [PubMed] [Google Scholar]
- Ding C, Festa RA, Chen YL, Espart A, Palacios O, Espin J, Capdevila M, Atrian S, Heitman J, Thiele DJ. 2013. Cryptococcus neoformans copper detoxification machinery is critical for fungal virulence. Cell Host Microbe 13: 265–276. [DOI] [PMC free article] [PubMed] [Google Scholar]
- Doniger SW, Kim HS, Swain D, Corcuera D, Williams M, Yang SP, Fay JC. 2008. A catalog of neutral and deleterious polymorphism in yeast. PLoS Genet 4: e1000183. [DOI] [PMC free article] [PubMed] [Google Scholar]
- Dowell RD, Ryan O, Jansen A, Cheung D, Agarwala S, Danford T, Bernstein DA, Rolfe PA, Heisler LE, Chin B, et al. 2010. Genotype to phenotype: a complex problem. Science 328: 469. [DOI] [PMC free article] [PubMed] [Google Scholar]
- Dunn B, Richter C, Kvitek DJ, Pugh T, Sherlock G. 2012. Analysis of the Saccharomyces cerevisiae pan-genome reveals a pool of copy number variants distributed in diverse yeast strains from differing industrial environments. Genome Res 22: 908–924. [DOI] [PMC free article] [PubMed] [Google Scholar]
- Enache-Angoulvant A, Hennequin C. 2005. Invasive Saccharomyces infection: a comprehensive review. Clin Infect Dis 41: 1559–1568. [DOI] [PubMed] [Google Scholar]
- Engel SR, Dietrich FS, Fisk DG, Binkley G, Balakrishnan R, Costanzo MC, Dwight SS, Hitz BC, Karra K, Nash RS, et al. 2014. The reference genome sequence of Saccharomyces cerevisiae: then and now. G3 (Bethesda) 4: 389–398. [DOI] [PMC free article] [PubMed] [Google Scholar]
- Engle EK, Fay JC. 2013. ZRT1 harbors an excess of nonsynonymous polymorphism and shows evidence of balancing selection in Saccharomyces cerevisiae. G3 (Bethesda) 3: 665–673. [DOI] [PMC free article] [PubMed] [Google Scholar]
- Esberg A, Muller LA, McCusker JH. 2011. Genomic structure of and genome-wide recombination in the Saccharomyces cerevisiae S288C progenitor isolate EM93. PLoS One 6: e25211. [DOI] [PMC free article] [PubMed] [Google Scholar]
- Fogel S, Welch JW. 1982. Tandem gene amplification mediates copper resistance in yeast. Proc Natl Acad Sci 79: 5342–5346. [DOI] [PMC free article] [PubMed] [Google Scholar]
- Fogel S, Welch JW, Maloney DH. 1988. The molecular genetics of copper resistance in Saccharomyces cerevisiae—a paradigm for non-conventional yeasts. J Basic Microbiol 28: 147–160. [DOI] [PubMed] [Google Scholar]
- Garrison E, Marth G. 2012. Haplotype-based variant detection from short-read sequencing. arXiv 1207.3907. [Google Scholar]
- Goffeau A, Barrell BG, Bussey H, Davis RW, Dujon B, Feldmann H, Galibert F, Hoheisel JD, Jacq C, Johnston M, et al. 1996. Life with 6000 genes. Science 274: 563–567. [DOI] [PubMed] [Google Scholar]
- Grigg ME, Suzuki Y. 2003. Sexual recombination and clonal evolution of virulence in Toxoplasma. Microbes Infect 5: 685–690. [DOI] [PubMed] [Google Scholar]
- Guan W, Jiang H, Guo X, Mancera E, Xu L, Li Y, Steinmetz L, Gu Z. 2010. Antagonistic changes in sensitivity to antifungal drugs by mutations of an important ABC transporter gene in a fungal pathogen. PLoS One 5: e11309. [DOI] [PMC free article] [PubMed] [Google Scholar]
- Hamer DH, Thiele DJ, Lemontt JE. 1985. Function and autoregulation of yeast copperthionein. Science 228: 685–690. [DOI] [PubMed] [Google Scholar]
- Haro R, Garciadeblas B, Rodriguez-Navarro A. 1991. A novel P-type ATPase from yeast involved in sodium transport. FEBS Lett 291: 189–191. [DOI] [PubMed] [Google Scholar]
- Hennequin C, Thierry A, Richard GF, Lecointre G, Nguyen HV, Gaillardin C, Dujon B. 2001. Microsatellite typing as a new tool for identification of Saccharomyces cerevisiae strains. J Clin Microbiol 39: 551–559. [DOI] [PMC free article] [PubMed] [Google Scholar]
- Hodgkinson V, Petris MJ. 2012. Copper homeostasis at the host-pathogen interface. J Biol Chem 287: 13549–13555. [DOI] [PMC free article] [PubMed] [Google Scholar]
- Holb IJ. 2009. Fungal disease management in environmentally friendly apple production—a review In Climate change, intercropping, pest control and beneficial microorganisms (ed. Lichtfouse E), pp. 219–292 Springer, NY. [Google Scholar]
- Larkin MA, Blackshields G, Brown NP, Chenna R, McGettigan PA, McWilliam H, Valentin F, Wallace IM, Wilm A, Lopez R, et al. 2007. Clustal W and Clustal X version 2.0. Bioinformatics 23: 2947–2948. [DOI] [PubMed] [Google Scholar]
- Li H, Durbin R. 2009. Fast and accurate short read alignment with Burrows-Wheeler transform. Bioinformatics 25: 1754–1760. [DOI] [PMC free article] [PubMed] [Google Scholar]
- Liti G, Carter DM, Moses AM, Warringer J, Parts L, James SA, Davey RP, Roberts IN, Burt A, Koufopanou V, et al. 2009. Population genomics of domestic and wild yeasts. Nature 458: 337–341. [DOI] [PMC free article] [PubMed] [Google Scholar]
- Mackie KA, Muller T, Kandeler E. 2012. Remediation of copper in vineyards--a mini review. Environ Pollut 167: 16–26. [DOI] [PubMed] [Google Scholar]
- Magwene PM. 2014. Revisiting Mortimer's Genome Renewal Hypothesis: heterozygosity, homothallism, and the potential for adaptation in yeast. Adv Exp Med Biol 781: 37–48. [DOI] [PMC free article] [PubMed] [Google Scholar]
- Magwene PM, Kayikci O, Granek JA, Reininga JM, Scholl Z, Murray D. 2011. Outcrossing, mitotic recombination, and life-history trade-offs shape genome evolution in Saccharomyces cerevisiae. Proc Natl Acad Sci 108: 1987–1992. [DOI] [PMC free article] [PubMed] [Google Scholar]
- Martinez R, Latreille MT, Mirande M. 1991. A PMR2 tandem repeat with a modified C-terminus is located downstream from the KRS1 gene encoding lysyl-tRNA synthetase in Saccharomyces cerevisiae. Mol Gen Genet 227: 149–154. [DOI] [PubMed] [Google Scholar]
- McCluskey K, Wiest A, Plamann M. 2010. The Fungal Genetics Stock Center: a repository for 50 years of fungal genetics research. J Biosci 35: 119–126. [DOI] [PubMed] [Google Scholar]
- McCusker JH. 2006. Chapter 18: Saccharomyces cerevisiae: an emerging and opportunistic pathogenic fungus In Molecular principles of fungal pathogenesis (ed. Heitman J, et al. ), pp. 245–259 ASM Press, Washington, DC. [Google Scholar]
- McCusker JH, Clemons KV, Stevens DA, Davis RW. 1994. Genetic characterization of pathogenic Saccharomyces cerevisiae isolates. Genetics 136: 1261–1269. [DOI] [PMC free article] [PubMed] [Google Scholar]
- Miceli MH, Diaz JA, Lee SA. 2011. Emerging opportunistic yeast infections. Lancet Infect Dis 11: 142–151. [DOI] [PubMed] [Google Scholar]
- Minot S, Melo MB, Li F, Lu D, Niedelman W, Levine SS, Saeij JP. 2012. Admixture and recombination among Toxoplasma gondii lineages explain global genome diversity. Proc Natl Acad Sci 109: 13458–13463. [DOI] [PMC free article] [PubMed] [Google Scholar]
- Mortimer RK, Johnston JR. 1986. Genealogy of principal strains of the Yeast Genetic Stock Center. Genetics 113: 35–43. [DOI] [PMC free article] [PubMed] [Google Scholar]
- Mortimer R, Polsinelli M. 1999. On the origins of wine yeast. Res Microbiol 150: 199–204. [DOI] [PubMed] [Google Scholar]
- Muller LA, McCusker JH. 2009a. Microsatellite analysis of genetic diversity among clinical and nonclinical Saccharomyces cerevisiae isolates suggests heterozygote advantage in clinical environments. Mol Ecol 18: 2779–2786. [DOI] [PMC free article] [PubMed] [Google Scholar]
- Muller LA, McCusker JH. 2009b. A multispecies-based taxonomic microarray reveals interspecies hybridization and introgression in Saccharomyces cerevisiae. FEMS Yeast Res 9: 143–152. [DOI] [PMC free article] [PubMed] [Google Scholar]
- Muller LA, McCusker JH. 2011. Nature and distribution of large sequence polymorphisms in Saccharomyces cerevisiae. FEMS Yeast Res 11: 587–594. [DOI] [PMC free article] [PubMed] [Google Scholar]
- Muller LA, Lucas JE, Georgianna DR, McCusker JH. 2011. Genome-wide association analysis of clinical vs. nonclinical origin provides insights into Saccharomyces cerevisiae pathogenesis. Mol Ecol 20: 4085–4097. [DOI] [PMC free article] [PubMed] [Google Scholar]
- Munoz P, Bouza E, Cuenca-Estrella M, Eiros JM, Perez MJ, Sanchez-Somolinos M, Rincon C, Hortal J, Pelaez T. 2005. Saccharomyces cerevisiae fungemia: an emerging infectious disease. Clin Infect Dis 40: 1625–1634. [DOI] [PubMed] [Google Scholar]
- Murphy A, Kavanagh K. 1999. Emergence of Saccharomyces cerevisiae as a human pathogen: implications for biotechnology. Enzyme Microb Technol 25: 551–557. [Google Scholar]
- Neyrolles O, Mintz E, Catty P. 2013. Zinc and copper toxicity in host defense against pathogens: Mycobacterium tuberculosis as a model example of an emerging paradigm. Front Cell Infect Microbiol 3: 89. [DOI] [PMC free article] [PubMed] [Google Scholar]
- Nishant KT, Wei W, Mancera E, Argueso JL, Schlattl A, Delhomme N, Ma X, Bustamante CD, Korbel JO, Gu Z, et al. 2010. The Baker's Yeast diploid genome is remarkably stable in vegetative growth and meiosis. PLoS Genet 6: e1001109. [DOI] [PMC free article] [PubMed] [Google Scholar]
- Olver WJ, James SA, Lennard A, Galloway A, Roberts IN, Boswell TC, Russell NH. 2002. Nosocomial transmission of Saccharomyces cerevisiae in bone marrow transplant patients. J Hosp Infect 52: 268–272. [DOI] [PubMed] [Google Scholar]
- Perez-Ortin JE, Querol A, Puig S, Barrio E. 2002. Molecular characterization of a chromosomal rearrangement involved in the adaptive evolution of yeast strains. Genome Res 12: 1533–1539. [DOI] [PMC free article] [PubMed] [Google Scholar]
- Pfaller MA, Diekema DJ. 2010. Epidemiology of invasive mycoses in North America. Crit Rev Microbiol 36: 1–53. [DOI] [PubMed] [Google Scholar]
- Pfaller MA, Diekema DJ, Gibbs DL, Newell VA, Meis JF, Gould IM, Fu W, Colombo AL, Rodriguez-Noriega E; Global Antifungal Surveillance Study. 2007. Results from the ARTEMIS DISK Global Antifungal Surveillance study, 1997 to 2005: an 8.5-year analysis of susceptibilities of Candida species and other yeast species to fluconazole and voriconazole determined by CLSI standardized disk diffusion testing. J Clin Microbiol 45: 1735–1745. [DOI] [PMC free article] [PubMed] [Google Scholar]
- Pfaller MA, Diekema DJ, Gibbs DL, Newell VA, Bijie H, Dzierzanowska D, Klimko NN, Letscher-Bru V, Lisalova M, Muehlethaler K, et al. 2009. Results from the ARTEMIS DISK Global Antifungal Surveillance Study, 1997 to 2007: 10.5-year analysis of susceptibilities of noncandidal yeast species to fluconazole and voriconazole determined by CLSI standardized disk diffusion testing. J Clin Microbiol 47: 117–123. [DOI] [PMC free article] [PubMed] [Google Scholar]
- Ponton J, Ruchel R, Clemons KV, Coleman DC, Grillot R, Guarro J, Aldebert D, Ambroise-Thomas P, Cano J, Carrillo-Munoz AJ, et al. 2000. Emerging pathogens. Med Mycol 38 (Suppl 1): 225–236. [DOI] [PubMed] [Google Scholar]
- Pritchard JK, Stephens M, Donnelly P. 2000. Inference of population structure using multilocus genotype data. Genetics 155: 945–959. [DOI] [PMC free article] [PubMed] [Google Scholar]
- R Core Team. 2014. R: a language and environment for statistical computing. R Foundation for Statistical Computing, Vienna, Austria: http://www.R-project.org/. [Google Scholar]
- RM11. 2004. Saccharomyces cerevisiae RM11-1a Sequencing Project. Broad Institute of Harvard and MIT; http://www.broadinstitute.org/annotation/genome/saccharomyces_cerevisiae/Home.html. [Google Scholar]
- Rodriguez-Navarro S, Llorente B, Rodriguez-Manzaneque MT, Ramne A, Uber G, Marchesan D, Dujon B, Herrero E, Sunnerhagen P, Perez-Ortin JE. 2002. Functional analysis of yeast gene families involved in metabolism of vitamins B1 and B6. Yeast 19: 1261–1276. [DOI] [PubMed] [Google Scholar]
- Salonen JH, Richardson MD, Gallacher K, Issakainen J, Helenius H, Lehtonen OP, Nikoskelainen J. 2000. Fungal colonization of haematological patients receiving cytotoxic chemotherapy: emergence of azole-resistant Saccharomyces cerevisiae. J Hosp Infect 45: 293–301. [DOI] [PubMed] [Google Scholar]
- Samanovic MI, Ding C, Thiele DJ, Darwin KH. 2012. Copper in microbial pathogenesis: meddling with the metal. Cell Host Microbe 11: 106–115. [DOI] [PMC free article] [PubMed] [Google Scholar]
- Schacherer J, Shapiro JA, Ruderfer DM, Kruglyak L. 2009. Comprehensive polymorphism survey elucidates population structure of Saccharomyces cerevisiae. Nature 458: 342–345. [DOI] [PMC free article] [PubMed] [Google Scholar]
- Silva V, Diaz MC, Febre N; Chilean Invasive Fungal Infections Group. 2004. Invasive fungal infections in Chile: a multicenter study of fungal prevalence and susceptibility during a 1-year period. Med Mycol 42: 333–339. [DOI] [PubMed] [Google Scholar]
- Skelly DA, Merrihew GE, Riffle M, Connelly CF, Kerr EO, Johansson M, Jaschob D, Graczyk B, Shulman NJ, Wakefield J, et al. 2013. Integrative phenomics reveals insight into the structure of phenotypic diversity in budding yeast. Genome Res 23: 1496–1504. [DOI] [PMC free article] [PubMed] [Google Scholar]
- Skovgaard N. 2007. New trends in emerging pathogens. Int J Food Microbiol 120: 217–224. [DOI] [PubMed] [Google Scholar]
- Smith TF, Waterman MS. 1981. Identification of common molecular subsequences. J Mol Biol 147: 195–197. [DOI] [PubMed] [Google Scholar]
- Sniegowski PD, Dombrowski PG, Fingerman E. 2002. Saccharomyces cerevisiae and Saccharomyces paradoxus coexist in a natural woodland site in North America and display different levels of reproductive isolation from European conspecifcs. FEMS Yeast Res 1: 299–306. [DOI] [PubMed] [Google Scholar]
- Voelz K, Ma H, Phadke S, Byrnes EJ, Zhu P, Mueller O, Farrer RA, Henk DA, Lewit Y, Hsueh YP, et al. 2013. Transmission of Hypervirulence traits via sexual reproduction within and between lineages of the human fungal pathogen Cryptococcus gattii. PLoS Genet 9: e1003771. [DOI] [PMC free article] [PubMed] [Google Scholar]
- Wang QM, Liu WQ, Liti G, Wang SA, Bai FY. 2012. Surprisingly diverged populations of Saccharomyces cerevisiae in natural environments remote from human activity. Mol Ecol 21: 5404–5417. [DOI] [PubMed] [Google Scholar]
- Warringer J, Zorgo E, Cubillos FA, Zia A, Gjuvsland A, Simpson JT, Forsmark A, Durbin R, Omholt SW, Louis EJ, et al. 2011. Trait variation in yeast is defined by population history. PLoS Genet 7: e1002111. [DOI] [PMC free article] [PubMed] [Google Scholar]
- Wei W, McCusker JH, Hyman RW, Jones T, Ning Y, Cao Z, Gu Z, Bruno D, Miranda M, Nguyen M, et al. 2007. Genome sequencing and comparative analysis of Saccharomyces cerevisiae strain YJM789. Proc Natl Acad Sci 104: 12825–12830. [DOI] [PMC free article] [PubMed] [Google Scholar]
- Wieland J, Nitsche AM, Strayle J, Steiner H, Rudolph HK. 1995. The PMR2 gene cluster encodes functionally distinct isoforms of a putative Na+ pump in the yeast plasma membrane. EMBO J 14: 3870–3882. [DOI] [PMC free article] [PubMed] [Google Scholar]
- Winzeler EA, Richards DR, Conway AR, Goldstein AL, Kalman S, McCullough MJ, McCusker JH, Stevens DA, Wodicka L, Lockhart DJ, et al. 1998. Direct allelic variation scanning of the yeast genome. Science 281: 1194–1197. [DOI] [PubMed] [Google Scholar]
- Zerva L, Hollis RJ, Pfaller MA. 1996. In vitro susceptibility testing and DNA typing of Saccharomyces cerevisiae clinical isolates. J Clin Microbiol 34: 3031–3034. [DOI] [PMC free article] [PubMed] [Google Scholar]
- Zhao Y, Strope PK, Kozmin SG, McCusker JH, Dietrich FS, Kokoska RJ, Petes TD. 2014. Structures of naturally evolved CUP1 tandem arrays in yeast indicate that these arrays are generated by unequal nonhomologous recombination. G3 (Bethesda) 4: 2259–2269. [DOI] [PMC free article] [PubMed] [Google Scholar]
- Zhou X, Stephens M. 2012. Genome-wide efficient mixed-model analysis for association studies. Nat Genet 44: 821–824. [DOI] [PMC free article] [PubMed] [Google Scholar]
Associated Data
This section collects any data citations, data availability statements, or supplementary materials included in this article.