Abstract
DNA-binding and RNA-binding proteins are usually considered ‘undruggable’ partly due to the lack of an efficient method to identify inhibitors from existing small molecule repositories. Here we report a rapid and sensitive high-throughput screening approach to identify compounds targeting protein–nucleic acids interactions based on protein–DNA or protein–RNA interaction enzyme-linked immunosorbent assays (PDI-ELISA or PRI-ELISA). We validated the PDI-ELISA method using the mammalian high-mobility-group protein AT-hook 2 (HMGA2) as the protein of interest and netropsin as the inhibitor of HMGA2–DNA interactions. With this method we successfully identified several inhibitors and an activator for HMGA2–DNA interactions from a collection of 29 DNA-binding compounds. Guided by this screening excise, we showed that netropsin, the specific inhibitor of HMGA2–DNA interactions, strongly inhibited the differentiation of the mouse pre-adipocyte 3T3-L1 cells into adipocytes, most likely through a mechanism by which the inhibition is through preventing the binding of HMGA2 to the target DNA sequences. This method should be broadly applicable to identify compounds or proteins modulating many DNA-binding or RNA-binding proteins.
INTRODUCTION
Protein–DNA interactions play critical roles in many essential biological events, such as DNA replication, recombination and transcription. For instance, the first step of DNA replication is the binding of the origin-binding proteins, such as DnaA for bacteria and origin recognition complex for eukaryotes, to DNA replication origins to initiate DNA replication (1–3). Transcription factors, on the other hand, orchestrate specific gene expression patterns in response to developmental and/or environmental stimuli (4–6). Abnormal expression and/or aberrant regulation of certain transcription factors are involved in human oncogenesis (7), and tumor proliferation and malignancy (8,9). In fact, transcription factors are considered as important therapeutic targets due to their crucial roles in many diseases including cancers (7). However, since transcription factors usually do not have enzymatic activities suitable for chemical intervention, they are considered ‘undruggable’ targets (10). Nevertheless, it is possible to design chemistry to disrupt protein–DNA and/or protein–protein interactions to modulate the functionalities of transcription factors, such as c-Myc and STAT3 (signal transducer and activator of transcription 3). Indeed, several high-throughput screening methods have been used to identify inhibitors targeting protein–protein interactions (7,11,12). One challenge is to develop rapid and efficient high-throughput screening assays to identify inhibitors from the millions of compounds found in small molecule libraries that may target protein–DNA, protein–RNA and protein–protein interactions. Here we report a rapid and sensitive high-throughput screening method to survey compound libraries targeting protein–DNA and protein–RNA interactions, a necessary step toward converting these ‘undruggable’ targets ‘druggable’.
MATERIALS AND METHODS
Materials
Biotin-labeled hairpin DNA oligomer FL814 containing a specific binding site of HMGA2 was purchased from Eurofins MWG Operon, Inc. Streptavidin covalently coated 96-well plates (NUNC Immobilizer Streptavidin-F96 clear) were from Thermo Fisher Scientific, Inc. Antibody against HMGA2 (HMGA2 (D1A7) Rabbit mAb) and Anti-rabbit IgG, HRP-linked Antibody #7074 were purchased from Cell Signaling, Inc. Ultra TMB-ELISA was bought from Thermo Fisher Scientific, Inc. The mammalian high mobility group protein AT hook 2 (HMGA2) was purified as described previously (13). Netropsin, insulin and Oil red O were purchased from Sigma and used without further purification. The following extinction coefficients were used to determine the concentration of different compounds: netropsin, 21 500 M−1 cm−1 at 296 nm, meso-tetra (N-methyl-4-pyridyl) porphine tetratosylate (TMPyP4), 226 000 M−1 cm−1 at 424 nm and HMGA2, 5810 M−1 cm−1 at 280 nm. A compound library consisting of 29 DNA-binding compounds was a generous gift of Prof. Jonathan B. Chaires (University of Louisville, KY, USA). Dulbecco's modified Essential Medium (DMEM) and fetal bovine serum (FBS) were purchased from Invitrogen, Inc.
Protein–DNA interaction ELISA assays to screen compounds targeting HMGA2–DNA interactions
In this method, the first step is to bind a biotin-labeled oligomer to a streptavidin-coated 96-well plate. A synthetic DNA hairpin oligomer FL814 carrying a specific binding site of HMGA2, SELEX1, was used. The DNA oligomer was dissolved into an annealing buffer (10 mM Tris-HCl pH 8.0, 50 mM NaCl) at 100 μM and heated in a water bath to 95°C for 10 min. The denatured DNA oligomer FL814 was cooled down slowly for the formation of the double-stranded DNA. The streptavidin-coated plate was washed three times with 300 μl of 2×SSCT (saline-sodium citrate buffer with Tween 20: 30 mM trisodium citrate pH 7.0, 200 mM NaCl and 0.05% Tween 20). After the wash, 100 μl of 0.1 μM FL814 was added to each of the wells. The plate was then incubated at room temperature on a shaking platform for 1 h. After removing the DNA solution, the plate was washed three times with 300 μl of 2×SSCT. In the next step, 300 μl of 3% bovine serum albumin in 2×SSCT was added to each of the wells to block the surface overnight at 4°C. The plate was then washed three times with 300 μl of 2×SSCT. The next step was the binding of HMGA2 to the DNA on the well surface of the 96-well plates. A titration of various concentrations of HMGA2 was carried out for the determination of the optimal signal-to-noise ratio for the assay. In this step, the DNA-binding compounds can be added to the wells to inhibit or enhance HMGA2 binding to the DNA oligomer FL814. After the protein-binding step, the plate was washed three times with 300 μl of 2×SSCT. One hundred microliter of the first antibody against HMGA2 (Rabbit mAb) in 2×SSCT was added to the wells and the plate was then incubated at room temperature for 1 h on a shaking platform. The plate was washed three times with 300 μl of 2×SSCT. One hundred microliter of the second antibody against HMGA2 (HRP-linked anti-Rabbit IgG) in 2×SSCT was added to the wells and the plate was then incubated at room temperature for 1 h on a shaking platform. The plate was washed three times with 300 μl of 2×SSCT. After the wash, 100 μl of Ultra TMB ELISA was added to the wells. The plate was then incubated at room temperature for 15 min on a shaking platform. The reaction was then stopped with 100 μl of 2M H2SO4. The results were quantified with photometric detection using a microplate reader.
The protein–DNA interaction enzyme-linked immunosorbent assays (PDI-ELISA) were also used to determine the apparent DNA dissociation constant (Kd) by nonlinear-least-squares fitting the following equation using the program Origin:
 |
where R, a and x represent the DNA-binding ratio, the total DNA concentration and the total protein concentration, respectively. The apparent inhibitory IC50 values were obtained using the following equation (14):
 |
where Kc2 is a macroscopic binding constant for inhibitor binding to DNA, IC50 is the concentration of inhibitor that causes 50% inhibition of HMGA2 binding to DNA and C is the concentration of an inhibitor.
Z-factor of the PDI-ELISA was determined using a full 96-well plate in which 48 wells are for positive controls in the presence of 1 μM of HMGA2 and the rest 48 wells for negative controls in the absence of HMGA2. Z-factor was calculated by the following formula:
 |
where σp, σn, μp and μn represent the sample means and standard deviations for positive (p) and negative (n) controls, respectively.
Competition dialysis assays
The competition dialysis assays were carried out according to previously published procedures (15). Briefly, a volume of 0.3 ml of FL814 (3 μM) or the HMGA2-FL814 complex (3 μM) was pipeted into a separate 0.3 ml disposable dialyzer. The dialysis units were then placed into a beaker with 200 ml of 2×SSCT containing 0.73 μM of TMPyP4. The dialysis was allowed to equilibrate with continuous stirring of 72 h at room temperature (24°C). After the dialysis, the free, bound and total concentrations of TMPyP4 were determined spectrophotometrically.
Pre-adipocytes and differentiation
Mouse pre-adipocytes (3T3-L1 cells) were a gracious gift from Dr Jun Liu at Mayo Clinic. 3T3-L1 cells were maintained in DMEM supplemented with 10% FBS, 100 U/ml penicillin, 100 μg/ml streptomycin and 5 μg/ml plasmocin. The cells were grown under normal culture conditions of 5% CO2 and humidity. Cells were maintained for a minimum of three passages in linear growth prior to differentiation. To differentiate the 3T3-L1 pre-adipocytes into adipocytes, we used the protocol previously described by Zebisch et al. (16). Briefly, 3T3-L1 pre-adipocytes were sub-cultured in DMEM supplemented with 5% newborn calf serum, 100 U/ml penicillin, 100 μg/ml streptomycin and 5 μg/ml plasmocin (Basal Media 1 – BM1). The cells were then plated at 6×10⁵ cells per dish in 35-mm dishes, 3×10⁵ cells per well in a 12-well plate, 1.5×10⁵ cells in a 24-well plate or 3.0×10⁴ cells per well in a 96-well plate. The cells were grown to confluency with BM1 replacement every other day. Following 48 h of confluency, 3T3-L1 cells were treated with Differentiation medium 1 (DM1), which is BM1 supplemented with 0.5 μM iso-butyl-methylxanthine, 0.25 μM dexamethasone, 1 μg/ml insulin and 2 μg/ml rosiglitazone. After 48 h, the medium was replaced with differentiation medium 2 (DM2); this is BM1 supplemented with 1 μg/ml insulin. On the seventh day, the cells were placed in DMEM with FBS. The cells were cultured to the date indicated in the experiments below with media changes every other day. The presence of adipogenesis was confirmed by microscopic detection of adipose bodies in the cells. For our experiments, only cultures with >80% differentiation were used.
Western blot analysis
To isolate proteins from cells for western blot analysis, cells were plated as indicated above, and following differentiation and drug treatment, cells were lysed and proteins were harvested as previously described (17). Briefly, cells were washed twice in phosphate buffered saline (PBS) and lysed in radioimmunoprecipitation assay buffer (50 mM Tris-HCl, pH 8.0, 150 mM NaCl, 1% Nonidet P-40, 0.5% deoxycholate, 0.1% SDS) supplemented with protease inhibitors (1 mM PMSF and Halt Protease Inhibitor Cocktail (Thermo)) and Halt phosphatase inhibitors (Thermo). Cells were then incubated at 4°C for 5 min with gentle rocking. Cells were scraped from the well and transferred to a sterile micro-centrifuge tube. Following a 10-min incubation on ice, the cells disruption was finished using sonication. The lysate was centrifuged at 14 000×g for 15 min to remove debris. Protein concentrations of the supernatant were determined using the Pierce BCA Assay kit protocol. Proteins were resolved by sodium dodecyl sulphate-polyacrylamide gel electrophoresis and transferred onto polyvinylidene difluoride membranes. Membranes were incubated with Li-Cor Biosciences Odyssey Blocking for at least 1 h at room temperature or overnight at 4°C. The membranes were incubated with primary antibodies specific for FABP4, HMGA2 and Actin (Cell Signaling Technology 3544, 5269 and 3700, respectively) at dilutions of 1:1000 in blocking buffer. Membranes were washed three times for 5 min in 1× TBST (20 mM Tris-HCl, pH 6.7, 137 mM NaCl, 0.1% Tween 20). Membranes were incubated with secondary antibodies in blocking buffer at 1:20 000 for fluorescently conjugated antibodies purchased from Li-Cor Biosciences. Membranes were again washed three times for 5 min in 1×TBST. Western blots were developed using fluorescence detection using the LI-COR Odyssey CLx near infrared scanner.
Oil Red O staining
Following differentiation and drug treatment, Oil Red O staining was used to qualitatively and quantitatively assess the level of neutral lipids in the differentiated cells. For qualitative assessment by phase microscopy, cells were washed twice in PBS and then fixed with 10% formalin for 30 min at room temperature. Oil Red O was reconstituted at 300 mg per 100 ml of isopropanol. The Oil Red O solution was prepared for staining by adding 20 ml of deionized water to 30 ml of the Oil Red O stock solution and filtered. The cells were then incubated for 5 min in 60% isopropanol. The Oil Red O working solution was then added to cells for 5 min. The monolyers were then rinsed clean with deionized water. The cells were then visualized using phase microscopy on the EVOS XL Core microscope. For quantitative assessment of adipogenesis in 96-well formats, cells were lysed in dimethylsulfoxide (DMSO) following the water wash of Oil Red O stained cells. The DMSO released the intracellular Oil Red O into the solution. The absorbance (492 nm) was measured using the BioTek Synergy H1 plate reader.
In-cell western analysis
Specific protein levels were analyzed using in-cell western technology (18). During differentiation and drug administration, 3T3-L1 cells were fixed in 4% paraformaldehyde in PBS for 25 min at room temperature. Pre-adipocytes were quenched by washing the cells in 100 mM glycine for 5 min at room temperature. The cells were permeabilized by incubating the cells in 0.2% Triton X-100 in PBS for 30 min at room temperature. The cells were then blocked using LI-COR Odyssey Blocking Buffer (LI-COR Biosciences, 927–40100) for 1 h at room temperature. Cells were then incubated with a primary antibody for HMGA2 (Cell Signaling Technologies #5269) at a 1:500 dilution in LI-COR Odyssey Blocking Buffer supplemented with 0.1% Tween-20 for 2.5 h at room temperature. The cells were washed in 0.1% Tween in PBS. Secondary antibodies (IRDye 800CW anti-rabbit, LI-COR Biosciences, 926–32211) were incubated at a dilution of 1:1000 in LI-COR Blocking Buffer supplemented with 0.1% Tween-20 for 1 h. Concurrent to the addition of secondary antibody TO-PRO-3 (Invitrogen) was added at a 1:1000 dilution as a normalization control for cell number and incubated for 1 h. The cells were washed again in 0.1% Tween-20 in PBS. Plates were then scanned on the LI-COR Biosciences Odyssey CLx Infrared Imaging System and quantified using the LI-COR in-cell western analysis in Image Studio.
Statistical analysis
A minimum of eight technical replicates was considered for all cell-based studies performed in 96-well formats, while technical replicates were performed for western blot analysis and microscopy; additionally, a minimum of four biological replicates were evaluated for our studies. To determine statistical significance, Student's paired t test was employed for significance between treatments. Statistical significance is indicated by an asterisk in figures in which the P value is <0.05. Data are displayed as means with error bars representing plus and minus one standard deviation.
RESULTS AND DISCUSSION
Figure 1 illustrates the concept of the high-throughput screening assay in which the PDI-ELISA (19–21) is used. The first step is to bind a biotin-labeled oligomer to the streptavidin-coated multiple-well plates. Either a synthetic hairpin or double-stranded DNA oligomer containing a binding sequence for a sequence-specific DNA-binding protein, such as transcription factors, may be used. After blocking the well surface by a blocking agent, the DNA-binding protein is added to the wells to bind to the DNA oligomer. The DNA-binding compounds are also added to the wells to inhibit or enhance the protein binding to the DNA, which is the basis of the method for high-throughput drug screening. Colorimetric, chemiluminescence or fluorescence detection can be used to determine the extent by which compounds inhibit or enhance the DNA-binding capacities of the DNA-binding protein. The apparent inhibitory or stimulatory IC50 of the DNA-binding drug can be determined as well.
Figure 1.
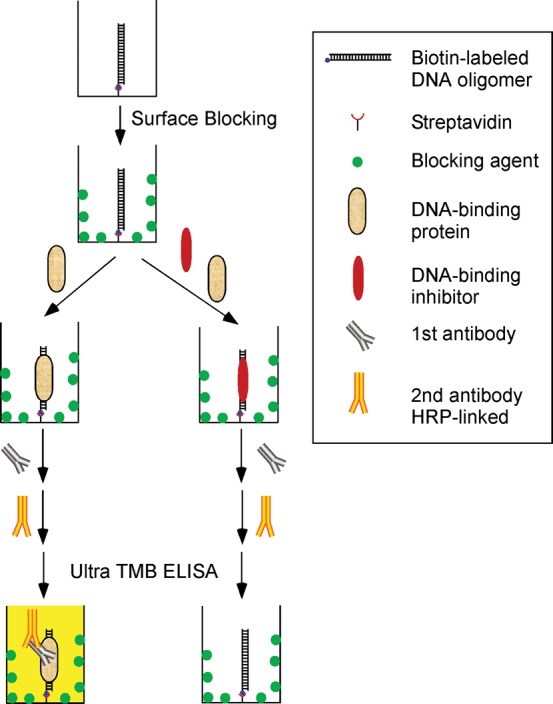
The concept of a high-throughput screening method to identify compounds or proteins targeting protein–nucleic acids interactions. The first step is to link a biotin-labeled oligomer to surface of a multiple-well plate through biotin–streptavidin interaction. After the surface-blocking step, a nucleic acids–binding protein is added to the wells to bind to the oligomer. The compounds or proteins of interest can also be added to the wells to inhibit or enhance the protein binding, which is the basis of the method for high-throughput drug screening. Colorimetric, chemiluminescence or fluorescence methods can be used to detect whether the compounds or proteins inhibit or enhance the binding capacities of the nucleic acids–binding protein.
We validated the concept using the mammalian high-mobility-group protein AT-hook 2 (HMGA2) as the sequence-specific DNA-binding protein. HMGA2 is a multi-function nuclear transcription factor directly linked to oncogenesis (22,23) and obesity (24,25). It was also involved in human height (26,27), stem cell youth (28) and human intelligence (29). These functionalities make HMGA2 one of the most intriguing proteins studied so far and a valuable candidate drug target (14,30). HMGA2 is a small DNA-binding protein carrying three ‘AT hook’ DNA-binding motifs that specifically recognize the minor groove of AT-rich DNA sequences (31). We used a biotin-labeled oligomer (a hairpin) FL814 containing a specific binding site of HMGA2, SELEX 1 (14) (Supplementary Figure S1) and colorimetric detection assays for our experiments. Under the experimental conditions used in this study, the dissociation constant of HMGA2 with FL814 was estimated to be 0.86±0.12 μM (Figure 2A), which is consistent with our previous published results (31). Netropsin, a well-characterized AT minor groove binder and a potent inhibitor of HMGA2–DNA interactions (14), was used as a model inhibitor for the proof-of-concept experiment. Results in Figure 2B clearly demonstrate that netropsin is indeed a strong inhibitor of HMGA2–DNA interactions with an IC50 of 9.30±0.78 nM. Z factors for three consecutive days were determined to be 0.66, 0.68 and 0.77 using our described assay conditions (Materials and Methods) with manual pipetting. The Z-factor may be higher if automation were used.
Figure 2.
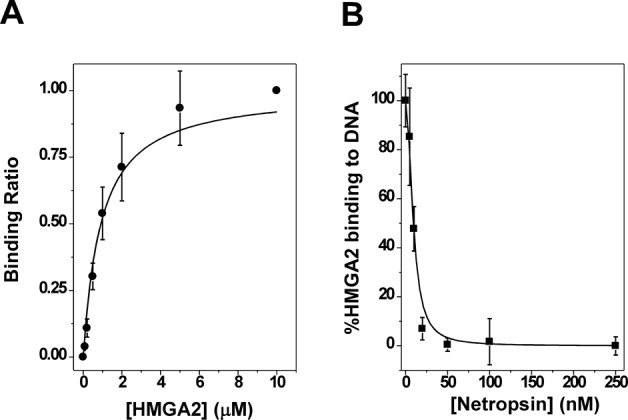
Inhibition of HMGA2 binding to FL814 by netropsin. (A) The titration experiment of HMGA2 to the DNA substrate FL814 in 2×SSCT. The apparent DNA dissociation constant was determined to be 0.86±0.12 μM according to the method described in Materials and Methods. The standard deviation was calculated according to three different titration experiments. (B) The netropsin titration experiments were used to determine the apparent inhibitory IC50 (9.30±0.78 nM). The standard deviation was calculated according to three different titration experiments.
Using the validated screening assay, we screened a collection of 29 different DNA-binding compounds targeting HMGA2–DNA interactions. These potential inhibitors include eight DNA intercalators, six DNA minor groove binders, six DNA triplex binders, six DNA quadruplex binders and three miscellaneous DNA binders. Figure 3 and Supplementary Table S1 show our results. At 100 nM of the compound added to the assays, it is apparent that three DNA minor groove binders (netropsin, DAPI and Hoechst 33258) and two bisintercalators (WP631 and WP762) are able to potently inhibit HMGA2 binding to the target sequence. The IC50 values confirmed these results (Supplementary Table S2). We would like to point out that although some of these compounds have strong absorbance around 420 nm, their contribution to the final absorbance is negligent because the solution containing these colorful compounds was removed and the wells were washed several times before measuring OD420 values.
Figure 3.
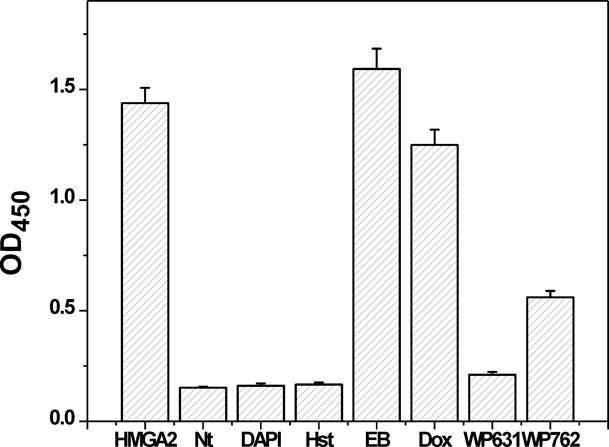
The inhibition of HMGA2-FL814 interactions by different DNA-binding compounds at 100 nM in 2×SSCT. Nt, Hst, EB and Dox represent netropsin, Hoechst 33258, ethidium bromide and doxorubicin, respectively. Netropsin, WP631, DAPI and Hoechst 33258 were able to completely inhibit the HMGA2-FL814 interactions under our experimental conditions.
Surprisingly and intriguingly, we found that meso-tetra (N-methyl-4-pyridyl) porphine tetratosylate (TMPyP4) is able to dramatically enhance the binding of HMGA2 to the target DNA sequence (FL814) (Supplementary Figure S2). To demonstrate the enhancement, we used a dilution of 1:2500 for the second antibody, HRP-linked anti-rabbit IgG. We also shortened the incubation time of the final step from 15 min to 5 min. In this way, the OD450 value of HMGA2 addition alone was sufficiently low. Adding TMPyP4 to the wells dramatically increased the absorbance at 450 nm (Figure 4). In contrast, meso-tetra (N-methyl-2-pyridyl) porphine tetrachloride (TMPyP2), a structurally similar compound, was not able to stimulate the binding of HMGA2 to FL814 (Figure 4). In the presence of TMPyP4, the dissociation constant of HMGA2 to FL814 (Kd) was determined to be 0.19±0.02 μM (Supplementary Figure S3), ∼4-fold enhancement of the binding of HMGA2 to FL814. Since FL814 is a hairpin, it is possible that TMPyP4 binds to the loop region of the oligomer to enhance the binding affinity of HMGA2 to FL814. Nevertheless, using a double-stranded DNA oligomer carrying the SELEX1 sequence without the loop region, TMPyP4 was also able to enhance the binding (Supplementary Figure S4), suggesting that the binding of TMPyP4 to the loop region is not the mechanism of the enhancement. In this study, we also carried out a competition dialysis assay (15) in which a volume of 0.3 ml of FL814 (3 μM) or the HMGA2-FL814 complex (3 μM) was pipeted into a separate 0.3 ml disposable dialyzer and dialyzed against 200 ml of 0.73 μM of TMPyP4 in 2×SSCT buffer extensively. Results in Supplementary Figure S5 show that TMPyP4 was able to bind to both FL814 and the FL814-HMGA2 complex tightly, and HMGA2 did not block the binding of TMPyP4 to FL814. These results also showed that two molecules of TMPyP4 bind to one molecule of FL814.
Figure 4.
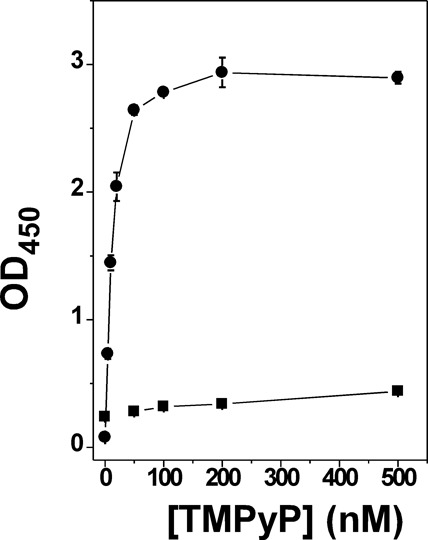
The enhancement of HMGA2 binding to FL814 by TMPyP4. The titration experiments using different concentrations of TMPyP4 (circles) and TMPyP2 (squares) were performed as described in Materials and Methods. One hundred nanomolar of FL814 and 1 μM of HMGA2 were used in these experiments.
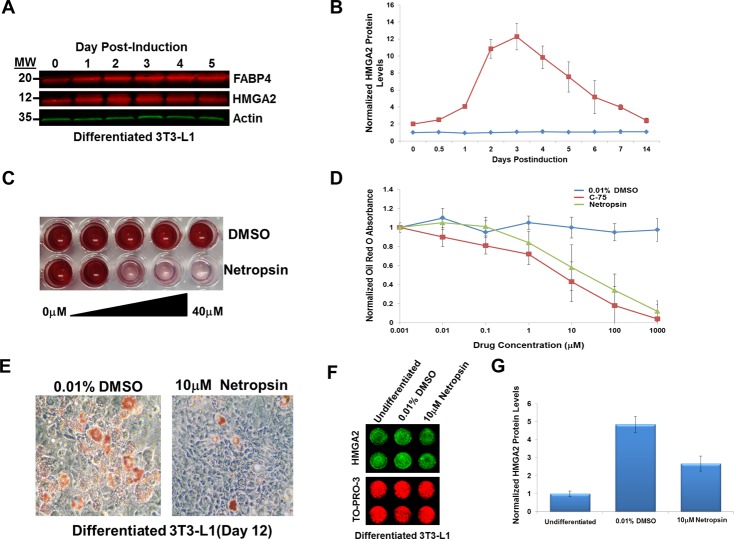
Previous studies showed that HMGA2 plays an important role in the differentiation of the mouse NIH 3T3-L1 pre-adipocyte cells into adipocytes (32) (Figure 5A and B). Knockdown of HMGA2 by miRNA let-7 significantly inhibited 3T3-L1 differentiation (32). Since netropsin is a potent inhibitor of HMGA2 binding to AT-rich DNA sequences (Figure 2B), this compound should be able to inhibit the differentiation of 3T3-L1 into adipocytes. Indeed, results in Figure 5 clearly demonstrate that netropsin strongly inhibited the differentiation of 3T3-L1 cells. At 10 μM, a concentration much lower than its cytotoxicity IC50 of 44.7 μM and above (33), netropsin was able to inhibit >50% of neutral lipid production measured by Oil red O staining in the differentiated cells (Figure 5D and E). The inhibition IC50 of neutral lipids in the differentiated cells was calculated to be 7.9±1.1 and 3.7±0.8 μM for netropsin and C-75 (an inhibitor of fatty acid synthase), respectively. As expected, HMGA2 was also expressed in fully differentiated 3T3-L1 cells even in the presence of netropsin (Figure 5F and G). These results strongly suggest that the inhibition of differentiation of 3T3-L1 to adipocytes was likely through a mechanism by which netropsin prevents HMGA2 from binding to its target DNA sequences on the chromosome. We have to point out here that the direct interactions of netropsin with DNA may also affect other DNA metabolic pathways and therefore inhibit the differentiation. Nevertheless, further studies are needed to determine the inhibition mechanism. Since the over- and/or aberrant-expression of HMGA2 has been directly attributed to the formation of the malignant tumors (22,30,34,35) and the expression level of HMGA2 often correlates with the degree of malignancy, the existence of metastasis, and a poor prognosis (36,37), netropsin and similar compounds should have potent anticancer and anti-metastasis activities by preventing HMGA2 from binding to its target sites on chromosome (33).
Figure 5.
Inhibition of HMGA2 by netropsin prevents 3T3-L1 adipogenesis. (A) Western blot analysis was used to confirm the increased expression of HMGA2 during adipogenesis. FABP4 was used as a control for increased gene expression during early adipogenesis, while actin was used as a loading control. (B) The fluorescent intensity of HMGA2 expression was quantified using the Image Studio Software (LI-COR Bioscience). The expression level of HMGA2 was measured across four biological replicates. (C) Adipogenesis was quantitatively measured by Oil Red O staining of 3T3-L1 cells. This method was employed to calculate the IC50 of Netropsin for this process over a dose curve. An image of this approach is displayed. (D) The absorbance of Oil Red O was determined using absorbance at 492 nm. C-75, an inhibitor of fatty acid synthase, was used as a control for inhibition of adipogenesis. (E) Oil Red O staining was also assessed qualitatively in the presence and absence of netropsin using phase microscopy. (F) The impact of netropsin exposure on HMGA2 expression levels was assessed using an in-cell western approach. TO-PRO-3 was used to normalize HMGA2 expression levels to cellular DNA content. (G) Normalized HMGA2 expression was assessed in 3T3-L1 cells exposed to DMSO and netropsin.
Although we showed here that PDI-ELISA was successfully used to identify small molecule DNA-binding inhibitors that block the binding of HMGA2 to its DNA-binding sites, this method can also be used to screen non-DNA binding ligands that inhibit or activate the binding of a protein to specific DNA sequences. For instance, as described in Figure 6A, PDI-ELISA can be used to screen small molecule compounds that prevent certain transcription factors from binding to the target DNA sequences. The Escherichia coli lac repressor is such a transcription factor that will dissociate from its binding sites, i.e. lac operators, upon binding to an inducer, such as IPTG (38). One should be able to use PDI-ELISA to identify inducers or small molecule ligands to inhibit the binding of transcription factors similar to the lac repressor to their DNA-binding sites. Additionally, certain transcription factors, such as eukaryotic nuclear receptors (39), do not tightly bind to the target DNA sequences in the absence of a ligand. PDI-ELISA could be a great tool to screen and identify small molecule ligands that enable the transcription factor binding to the target DNA sequence (40) (Figure 6B). Furthermore, small molecule or protein activators may induce DNA conformational change and therefore greatly enhance the DNA binding of a DNA-binding protein to the target DNA sequence. PDI-ELISA could be used to identify such activators. Indeed, using PDI-ELISA, we found that TMPyP4 significantly enhanced the binding of HMGA2 to the target DNA sequence, i.e. SELEX1 (Figure 4). This screening method can also be utilized to screen proteins from cellular extracts that inhibit or enhance the targeted protein–nucleic acids interactions. It should be pointed out that the same concept could be used to screen compounds targeting RNA–protein interactions as well. It is foreseeable that this versatile method will be used extensively to identify compounds or proteins of interest targeting many specific protein–nucleic acids interactions in the near future.
Figure 6.
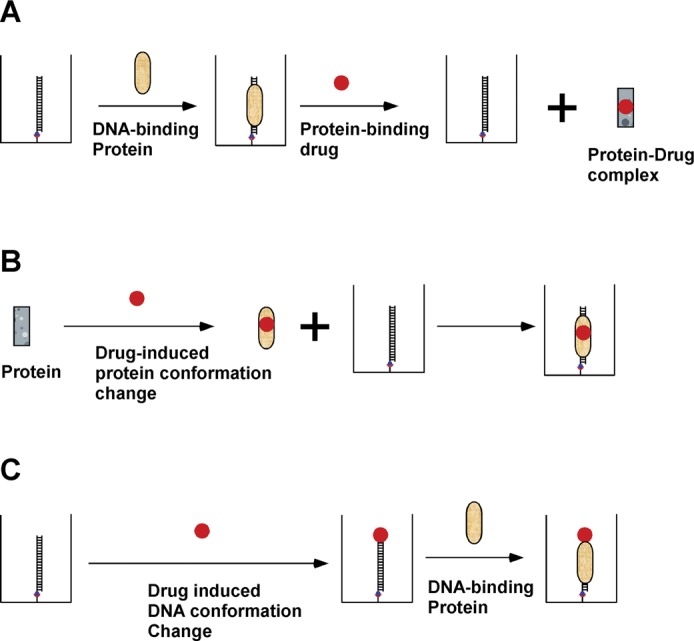
Possible schemes to screen inhibitors or activators targeting protein–DNA interactions by PDI-ELISA. (A) This screening scheme can be used to identify small molecule inhibitors that upon bind to the DNA-binding proteins cause the protein conformation change and dissociate the protein from the target DNA sequence. (B) Certain transcription factors do not bind to the target DNA sequence in the absence of a small molecule ligand. This screening scheme can be used to identify these small molecule ligands. (C) Certain small molecules or proteins act as activators to help a protein binding to a target DNA sequence. This screening scheme can be used to identify such activators using PDI-ELISA. Please see Figure 1 for the meaning of different symbols.
In summary, we have developed a rapid and sensitive high-throughput screening method, i.e. PDI-ELISA, for the identification of inhibitors and activators targeting protein–DNA interactions. Using this method, we successfully identified several potent inhibitors including netropsin for HMGA2–DNA interactions from a collection of 29 different DNA-binding compounds. We also found that TMPyP4 significantly enhances the binding of HMGA2 to the target DNA sequence. Additionally, we demonstrated that netropsin inhibited the differentiation of the preadipocyte NIH 3T3-L1 cells to adipocytes, most likely through the inhibition of HMGA2 binding to the target DNA sequences.
SUPPLEMENTARY DATA
Supplementary Data are available at NAR Online.
Acknowledgments
We thank Prof. Jonathan B. Chaires at the University of Louisville for providing us a compound library consisting of 29 different DNA-binding ligands. We also thank Dr Jun Liu at Mayo Clinic for providing us with mouse pre-adipocytes (NIH 3T3-L1 cells). We thank Dr Yuk-Ching Tse-Dinh for critically reading the article before submission and for helpful discussion. Author contributions: J.W.C. and F.L. designed the research. N.A., R.G., J.W.C. and F.L. performed experiments. F.L. wrote the article.
FUNDING
National Institutes of Health [5SC1HD063059–04, 1R15GM109254–01A1 to F.L.]; Florida International University. Publication of this article was funded in part by Florida International University Open Access Publishing Fund. Additional funding for open access charge: NIH [R15GM109254-01A1].
Conflict of interest statement. None declared.
REFERENCES
- 1.Erzberger J.P., Berger J.M. Evolutionary relationships and structural mechanisms of AAA+ proteins. Annu. Rev. Biophys. Biomol. Struct. 2006;35:93–114. doi: 10.1146/annurev.biophys.35.040405.101933. [DOI] [PubMed] [Google Scholar]
- 2.Stillman B. Origin recognition and the chromosome cycle. FEBS Lett. 2005;579:877–884. doi: 10.1016/j.febslet.2004.12.011. [DOI] [PubMed] [Google Scholar]
- 3.O'Donnell M., Langston L., Stillman B. Principles and concepts of DNA replication in bacteria, archaea, and eukarya. Cold Spring Harb. Perspect. Biol. 2013;5:a010108. doi: 10.1101/cshperspect.a010108. [DOI] [PMC free article] [PubMed] [Google Scholar]
- 4.Lobe C.G. Transcription factors and mammalian development. Curr. Top. Dev. Biol. 1992;27:351–383. doi: 10.1016/s0070-2153(08)60539-6. [DOI] [PubMed] [Google Scholar]
- 5.Osborne C.K., Schiff R., Fuqua S.A., Shou J. Estrogen receptor: current understanding of its activation and modulation. Clin. Cancer Res. 2001;7:4338s–4342s. [PubMed] [Google Scholar]
- 6.Benizri E., Ginouves A., Berra E. The magic of the hypoxia-signaling cascade. Cell Mol. Life Sci. 2008;65:1133–1149. doi: 10.1007/s00018-008-7472-0. [DOI] [PMC free article] [PubMed] [Google Scholar]
- 7.Darnell J.E., Jr Transcription factors as targets for cancer therapy. Nat. Rev. Cancer. 2002;2:740–749. doi: 10.1038/nrc906. [DOI] [PubMed] [Google Scholar]
- 8.Libermann T.A., Zerbini L.F. Targeting transcription factors for cancer gene therapy. Curr. Gene Ther. 2006;6:17–33. doi: 10.2174/156652306775515501. [DOI] [PubMed] [Google Scholar]
- 9.Frank D.A. Transcription factor STAT3 as a prognostic marker and therapeutic target in cancer. J. Clin. Oncol. 2013;31:4560–4561. doi: 10.1200/JCO.2013.52.8414. [DOI] [PubMed] [Google Scholar]
- 10.Yan C., Higgins P.J. Drugging the undruggable: transcription therapy for cancer. Biochim. Biophys. Acta. 2013;1835:76–85. doi: 10.1016/j.bbcan.2012.11.002. [DOI] [PMC free article] [PubMed] [Google Scholar]
- 11.Heeres J.T., Hergenrother P.J. High-throughput screening for modulators of protein-protein interactions: use of photonic crystal biosensors and complementary technologies. Chem. Soc. Rev. 2011;40:4398–4410. doi: 10.1039/b923660k. [DOI] [PubMed] [Google Scholar]
- 12.Makley L.N., Gestwicki J.E. Expanding the number of ‘druggable’ targets: non-enzymes and protein-protein interactions. Chem. Biol. Drug Des. 2013;81:22–32. doi: 10.1111/cbdd.12066. [DOI] [PMC free article] [PubMed] [Google Scholar]
- 13.Cui T., Joynt S., Morillo V., Baez M., Hua Z., Wang X., Leng F. Large scale preparation of the mammalian high mobility group protein A2 for biophysical studies. Protein Pept. Lett. 2007;14:87–91. doi: 10.2174/092986607779117281. [DOI] [PubMed] [Google Scholar]
- 14.Miao Y., Cui T., Leng F., Wilson W.D. Inhibition of high-mobility-group A2 protein binding to DNA by netropsin: a biosensor-surface plasmon resonance assay. Anal. Biochem. 2008;374:7–15. doi: 10.1016/j.ab.2007.10.023. [DOI] [PMC free article] [PubMed] [Google Scholar]
- 15.Ren J., Chaires J.B. Sequence and structural selectivity of nucleic acid binding ligands. Biochemistry. 1999;38:16067–16075. doi: 10.1021/bi992070s. [DOI] [PubMed] [Google Scholar]
- 16.Zebisch K., Voigt V., Wabitsch M., Brandsch M. Protocol for effective differentiation of 3T3-L1 cells to adipocytes. Anal. Biochem. 2012;425:88–90. doi: 10.1016/j.ab.2012.03.005. [DOI] [PubMed] [Google Scholar]
- 17.Chambers J.W., Howard S., LoGrasso P.V. Blocking c-Jun N-terminal kinase (JNK) translocation to the mitochondria prevents 6-hydroxydopamine-induced toxicity in vitro and in vivo. J. Biol. Chem. 2013;288:1079–1087. doi: 10.1074/jbc.M112.421354. [DOI] [PMC free article] [PubMed] [Google Scholar]
- 18.Egorina E.M., Sovershaev M.A., Osterud B. In-cell Western assay: a new approach to visualize tissue factor in human monocytes. J. Thromb. Haemost. 2006;4:614–620. doi: 10.1111/j.1538-7836.2005.01781.x. [DOI] [PubMed] [Google Scholar]
- 19.Hibma M.H., Ely S.J., Crawford L. A non-radioactive assay for the detection and quantitation of a DNA binding protein. Nucleic Acids Res. 1994;22:3806–3807. doi: 10.1093/nar/22.18.3806. [DOI] [PMC free article] [PubMed] [Google Scholar]
- 20.Rosenau C., Emery D., Kaboord B., Qoronfleh M.W. Development of a high-throughput plate-based chemiluminescent transcription factor assay. J. Biomol. Screen. 2004;9:334–342. doi: 10.1177/1087057103261446. [DOI] [PubMed] [Google Scholar]
- 21.Brand L.H., Henneges C., Schussler A., Kolukisaoglu H.U., Koch G., Wallmeroth N., Hecker A., Thurow K., Zell A., Harter K., et al. Screening for protein-DNA interactions by automatable DNA-protein interaction ELISA. PLoS One. 2013;8:e75177. doi: 10.1371/journal.pone.0075177. [DOI] [PMC free article] [PubMed] [Google Scholar]
- 22.Young A.R., Narita M. Oncogenic HMGA2: short or small. Genes Dev. 2007;21:1005–1009. doi: 10.1101/gad.1554707. [DOI] [PubMed] [Google Scholar]
- 23.Morishita A., Zaidi M.R., Mitoro A., Sankarasharma D., Szabolcs M., Okada Y., D'Armiento J., Chada K. HMGA2 is a driver of tumor metastasis. Cancer Res. 2013;73:4289–4299. doi: 10.1158/0008-5472.CAN-12-3848. [DOI] [PMC free article] [PubMed] [Google Scholar]
- 24.Zhou X., Benson K.F., Ashar H.R., Chada K. Mutation responsible for the mouse pygmy phenotype in the developmentally regulated factor HMGI-C. Nature. 1995;376:771–774. doi: 10.1038/376771a0. [DOI] [PubMed] [Google Scholar]
- 25.Anand A., Chada K. In vivo modulation of Hmgic reduces obesity. Nat. Genet. 2000;24:377–380. doi: 10.1038/74207. [DOI] [PubMed] [Google Scholar]
- 26.Weedon M.N., Lettre G., Freathy R.M., Lindgren C.M., Voight B.F., Perry J.R., Elliott K.S., Hackett R., Guiducci C., Shields B., et al. A common variant of HMGA2 is associated with adult and childhood height in the general population. Nat. Genet. 2007;39:1245–1250. doi: 10.1038/ng2121. [DOI] [PMC free article] [PubMed] [Google Scholar]
- 27.Horikoshi M., Yaghootkar H., Mook-Kanamori D.O., Sovio U., Taal H.R., Hennig B.J., Bradfield J.P., P.B., Evans D.M., Charoen P., et al. New loci associated with birth weight identify genetic links between intrauterine growth and adult height and metabolism. Nat. Genet. 2013;45:76–82. doi: 10.1038/ng.2477. [DOI] [PMC free article] [PubMed] [Google Scholar]
- 28.Copley M.R., Babovic S., Benz C., Knapp D.J., Beer P.A., Kent D.G., Wohrer S., Treloar D.Q., Day C., Rowe K., et al. The Lin28b-let-7-Hmga2 axis determines the higher self-renewal potential of fetal haematopoietic stem cells. Nat. Cell Biol. 2013;15:916–925. doi: 10.1038/ncb2783. [DOI] [PubMed] [Google Scholar]
- 29.Stein J.L., Medland S.E., Vasquez A.A., Hibar D.P., Senstad R.E., Winkler A.M., Toro R., Appel K., Bartecek R., Bergmann O., et al. Identification of common variants associated with human hippocampal and intracranial volumes. Nat. Genet. 2012;44:552–561. doi: 10.1038/ng.2250. [DOI] [PMC free article] [PubMed] [Google Scholar]
- 30.Fusco A., Fedele M. Roles of HMGA proteins in cancer. Nat. Rev. Cancer. 2007;7:899–910. doi: 10.1038/nrc2271. [DOI] [PubMed] [Google Scholar]
- 31.Cui T., Leng F. Specific recognition of AT-rich DNA sequences by the mammalian high mobility group protein AT-hook 2: a SELEX study. Biochemistry. 2007;46:13059–13066. doi: 10.1021/bi701269s. [DOI] [PubMed] [Google Scholar]
- 32.Sun T., Fu M., Bookout A.L., Kliewer S.A., Mangelsdorf D.J. MicroRNA let-7 regulates 3T3-L1 adipogenesis. Mol. Endocrinol. 2009;23:925–931. doi: 10.1210/me.2008-0298. [DOI] [PMC free article] [PubMed] [Google Scholar]
- 33.Zhao R., al-Said N.H., Sternbach D.L., Lown J.W. Camptothecin and minor-groove binder hybrid molecules: synthesis, inhibition of topoisomerase I, and anticancer cytotoxicity in vitro. J. Med. Chem. 1997;40:216–225. doi: 10.1021/jm9605804. [DOI] [PubMed] [Google Scholar]
- 34.Goodwin G. The high mobility group protein, HMGI-C. Int. J. Biochem. Cell Biol. 1998;30:761–766. doi: 10.1016/s1357-2725(98)00016-8. [DOI] [PubMed] [Google Scholar]
- 35.Chiappetta G., Ferraro A., Vuttariello E., Monaco M., Galdiero F., De S.V., Califano D., Pallante P., Botti G., Pezzullo L., et al. HMGA2 mRNA expression correlates with the malignant phenotype in human thyroid neoplasias. Eur. J. Cancer. 2008;44:1015–1021. doi: 10.1016/j.ejca.2008.02.039. [DOI] [PubMed] [Google Scholar]
- 36.Abe N., Watanabe T., Sugiyama M., Uchimura H., Chiappetta G., Fusco A., Atomi Y. Determination of high mobility group I(Y) expression level in colorectal neoplasias: a potential diagnostic marker. Cancer Res. 1999;59:1169–1174. [PubMed] [Google Scholar]
- 37.Meyer B., Loeschke S., Schultze A., Weigel T., Sandkamp M., Goldmann T., Vollmer E., Bullerdiek J. HMGA2 overexpression in non-small cell lung cancer. Mol. Carcinog. 2007;46:503–511. doi: 10.1002/mc.20235. [DOI] [PubMed] [Google Scholar]
- 38.Lewis M., Chang G., Horton N.C., Kercher M.A., Pace H.C., Schumacher M.A., Brennan R.G., Lu P. Crystal structure of the lactose operon repressor and its complexes with DNA and inducer. Science. 1996;271:1247–1254. doi: 10.1126/science.271.5253.1247. [DOI] [PubMed] [Google Scholar]
- 39.Helsen C., Kerkhofs S., Clinckemalie L., Spans L., Laurent M., Boonen S., Vanderschueren D., Claessens F. Structural basis for nuclear hormone receptor DNA binding. Mol. Cell Endocrinol. 2012;348:411–417. doi: 10.1016/j.mce.2011.07.025. [DOI] [PubMed] [Google Scholar]
- 40.Underwood K.F., Mochin M.T., Brusgard J.L., Choe M., Gnatt A., Passaniti A. A quantitative assay to study protein:DNA interactions, discover transcriptional regulators of gene expression, and identify novel anti-tumor agents. J. Vis. Exp. 2013;78:e50512. doi: 10.3791/50512. [DOI] [PMC free article] [PubMed] [Google Scholar]
Associated Data
This section collects any data citations, data availability statements, or supplementary materials included in this article.


