

Abstract
Macrophages affect the magnitude and duration of inflammatory response in a functionally heterogeneous manner. The phenotype of macrophages is maintained through a reversible homeostatic mechanism. A number of determinants that modulate macrophage plasticity have been identified, although the precise mechanisms are not fully understood. Here we report that stimulation of isolated human blood monocytes and mouse bone marrow-derived macrophages with human serum amyloid A (SAA), a major acute-phase protein, leads to induced expression of macrophage M2 markers including IL-10, Ym1, Fizz-1, MRC1, IL-1Rn and CCL17. The same effect was observed with macrophages exposed to SAA in peritoneal cavity. SAA also increases arginase 1 activity and enhances macrophage efferocytosis of apoptotic neutrophils in mouse macrophages. The induction of M2 markers requires MyD88 and the activation of multiple signaling pathways, but is independent of Stat6. SAA induces IRF4 expression and increases its DNA-binding activity. Silencing IRF4 by siRNA abrogates SAA-induced expression of the M2 markers. These results suggest a potential role for SAA to alter macrophage phenotype and modulate macrophage functions through a MyD88-dependent mechanism that involves IRF4-mediated transcription.
Keywords: M2 macrophage markers, serum amyloid A, efferocytosis, IRF4
Introduction
Macrophages are dynamic and heterogeneous innate immune cells that are essential for the initiation and resolution of inflammation. These cells display different phenotypes and respond to environmental cues in a polarized manner (1, 2). Polarized macrophages have been broadly classified into two groups, M1 macrophages and M2 macrophages (3, 4). Macrophages stimulated with LPS and IFN-γ assume an M1 pro-inflammatory phenotype, which is characterized by high levels of iNOS expression, increased capacity of antigen presentation, and elevated production of pro-inflammatory cytokines including TNF-α, IL-1β and IL-12 (5). The M2 macrophages, which are induced by exposure to IL-4, IL-13, transforming growth factor-β (TGF-β) and glucocorticoids, produce anti-inflammatory cytokines including IL-10, TGF-β, IL-1 receptor antagonist (IL-1Rn), CCL17 and in mice, Fizz-1 (found in inflammatory zone-1, Retnla) (3), Ym1 (chitinase 3-like 3, Chi3l3) and arginase 1 (6). In addition, the M2 macrophages express high levels of CD206 (mannose receptor C type 1, MRC1) and CD163 (1, 6, 7). The different cytokines, surface markers and metabolic enzymes expressed by these macrophage subsets reflect the diverse functions of the M1 and M2 macrophages. The M2 macrophages are often seen in the late phase of inflammation and are believed to play a role in the resolution of inflammation, tissue repair and remodeling (8).
Neutrophils are the first cells recruited to the site of inflammation (9). These terminally differentiated cells have short lifespan once released from bone marrow. Neutrophil apoptosis, either spontaneous or pathogen-induced, can lead to the release of toxic contents and cause tissue damage. Therefore, proper clearance of apoptotic neutrophils by macrophages, a process termed efferocytosis (10), is essential for homeostasis, tissue repair and remodeling (11, 12). The M2 macrophages display an enhanced efferocytosis and are known as “efferocytic-high” macrophages (13–15).
Serum amyloid A (SAA) is produced in response to severe infection and other forms of environmental insults (16, 17). A major acute-phase protein, SAA serves as a biomarker for clinical diagnosis of inflammatory diseases (18). Elevated SAA production is associated with rheumatoid arthritis, atherosclerosis, Crohn’s disease and type-2 diabetes (19–22), bringing the possibility that SAA may play an active role in these inflammatory disorders. In ex vivo and in vitro studies, recombinant human SAA is chemotactic for phagocytes (23)and induces the transcripts of several proinflammatory cytokines including TNFα, IL-1β, IL-6, IL-12p40, IL-23p19 and G-CSF (24–29). SAA stimulates the expression of metalloproteinase genes in rheumatoid synovium (30) and contributes to neutrophilia in sterile inflammation (27). However, recent reports indicate that systemic induction or administration of SAA failed to increase the plasma levels of proinflammatory cytokines (31, 32), raising the possibilities that SAA produced at different phases of inflammation and present at different locations (blood vs. tissue) may have different functions.
In the present study, we report that ex vivo and in vitro stimulation of macrophages with SAA induces M2 macrophage markers and promotes efferocytosis of apoptotic neutrophils. We have further investigated the underlying signaling mechanisms and identified MyD88 and IRF4 as key components for SAA-induced M2-like macrophage polarization and efferocytosis of apoptotic neutrophils.
Materials and Methods
Mice
All knockout mice used in this study were obtained from the Jackson Laboratory (Bar Harbor, ME) except for the Fpr2 knockout mice (33), which were generously provided by Dr. Ji Ming Wang (NCI-Frederick, NIH). C57BL/6 mice were purchased from Shanghai Laboratory Animal Center (SLAC, Shanghai, China). All animal studies were conducted at Shanghai Jiao Tong University using age- and sex-matched littermates. The procedures involving mice were approved by the Institutional Animal Care and Use Committee at Shanghai Jiao Tong University.
Reagents
Recombinant human SAA (Apo-SAA, Cat. No. 300-13) and SAA1 (Apo-SAA1, Cat. No. 300-53) were obtained from PeproTech (Rocky Hill, NJ). The content of bacterial endotoxin was less than 0.1 ng/μg protein according to the manufacturer. Using Tachypleus Amebocyte lysate (Zhanjiang A&C Biological, Zhanjiang, China), we found the endotoxin level to be less than 0.05 ng/μg SAA protein. Inhibitors for the protein kinases MEK (PD98059), p38 MAPK (SB203580), JNK (SP600125), PI3K (LY294002) were purchased from Calbiochem (San Diego, CA). Antibody to Arg1 was obtained from Santa Cruz Biotechnology (Dallas, TX). The Ym1 antibody was obtained from StemCell Technologies (Vancouver, Canada). Antibodies to IRF4 and IRF5 were purchased from Cell Signaling Technology (Danvers, MA). Anti-CD11b (PerCP-Cy5.5, Clone: M1/70) and anti-CD206 (FITC, Clone: C068C2) were obtained from BioLegend (San Diego, CA) and used for flow cytometry analysis.
Cells preparation and culture
Monocytes were purified from buffy coat obtained from healthy blood donors, following a protocol approved by the Institutional Review Board at Shanghai Jiao Tong University. Briefly, human peripheral blood mononuclear cells (PBMCs) were separated by standard gradient centrifugation on Ficoll-Paque gradient. Monocytes were then isolated from PBMCs by positive sorting using anti-CD14-conjugated magnetic microbeads (Miltenyi, Germany). Monocyte purity was greater than 90% as assessed by flow cytometry (data not shown). Mouse bone marrow-derived macrophages (BMDMs) were prepared from bone marrow cells isolated from WT C57BL/6 mice or knockout mice as described previously (34). Human monocytic leukemia cell line THP-1 (TIB-202) and mouse macrophage cell line RAW264.7 (TIB-71) was purchased from ATCC (Manassas, VA). The cells were maintained in RPMI 1640 supplemented with 10% FBS, 1% streptomycin-penicillin and 10 μM β-mercaptoethanol. All cell cultures were kept at 37 °C in a humidified atmosphere with 5% CO2.
RNA extraction, PCR and plasmid construction
Total RNA was extracted from the cells using an RNeasy Mini Kit (Qiagen China, Shanghai, China). First-strand cDNA was prepared from 1 μg of total RNA using AMV reverse transcriptase (Promega, Madison, WI). Gene-specific real-time quantitative PCR was performed using SYBR Green® Real-time PCR Master Mix (TOYOBO, Japan) on a Mastercycler Realplex system (Eppendorf, Germany). The results were normalized to that of GAPDH expression in the sample. Human IRF4 promoter extending from −1992 to +13 was amplified by PCR with genomic DNA. The PCR product was excised with XhoI and SacI digestion and cloned into the pGL3 luciferase vector (Promage). The ΔΔCt method was used for calculating the transcript level.
Measurement of arginase activity
Arginase activity based on urea formation was measured as previously described (35). Briefly, MnCl2 (25 μl, 10 mM in 50 mM Tris-HCl) was added to cell lysate and incubated at 56°C for 10 min for enzyme activation. L-Arginine was added to the tubes, incubated at 37°C for 1 h for enzyme activation and the reaction was stopped by adding an acid mixture (H2SO4 : H3PO4 : H2O in a ratio of 1:3:7). For colorimetric determination, α-isonitrosopropiophenone was added to each tube. The mixture was heated (100 °C, 45 min) and kept in dark for 10 min. Readings were taken with a spectrophotometer at an absorbance of 540 nm. Sample blank contained lysate without the addition of MnCl2 or L-Arginine to measure basal arginase activity, and these readings were subtracted from all samples. The values were divided by protein content to determine specific activity of the enzyme. The amount of the urea produced was used as an index for arginase activity.
Isolation and induction of apoptosis in neutrophils
Mouse polymorphonuclear neutrophils (PMN) were purified from bone marrow cell suspensions as described previously (36). Cells (2×10⁷/ml were incubated with 10 μM 5-chloromethylfluorescein diacetate (CMFDA; Molecular Probes) at 37°C for 15 min. Spontaneous apoptosis of CMFDA-labeled PMN was achieved by culturing PMN in RPMI 1640 medium supplemented with 10% autologous serum at 37°C for 24 h. To monitor apoptosis, 106 cells were stained with annexin V-FITC (BD Bioscience, San Jose, CA) and propidium iodide, according to the manufacture’s protocol. Cells were analyzed without fixation by flow cytometry within 30 min of staining.
Efferocytosis assays
Approximately 5×10⁵ mouse BMDMs were seeded in a 24-well plate, exposed to experimental stimuli and incubated with CMFDA-labeled apoptotic cells at a ratio of 1:1 at 37 °C for 60 min. The cells were collected and extracellular fluorescence associated with membrane-bound but non-engulfed apoptotic cells and bodies was quenched with trypan blue (0.04% in PBS). The proportion of BMDMs that exhibited increased fluorescence (corresponding to phagocytosis of fluorescent-labelled apoptotic cells) was determined by flow cytometry on a BD LSR Fortessa® flow cytometer (BD Biosciences) or by fluorescent microscopy on a Leica TCS SP8 inverted confocal microscope (Leica, Wetzlar, Germany). The phagocytosis index is calculated as the percentage of macrophages containing at least one ingested neutrophil. For efferocytosis in peritoneal cavity, 1×10⁶ CMFDA-labeled apoptotic neutrophils were resuspended in 100 μl PBS and injected into the peritoneal cavity of mice 18 h after SAA injection. After another 2 h, the mice were sacrificed and peritoneal cells were harvested by lavage. The percentage of macrophages (CD11b+ F4/80+) that ingested apoptotic neutrophils was taken as phagocytosis index.
A second method was used to discriminate the attached neutrophils from internalized neutrophils. Apoptotic neutrophils were biotinylated with EZ-link-Sulfo-NHS-Biotin (Thermo-Fisher) and then treated with APC-streptavidin (BioLegend). Cell surface-bound apoptotic neutrophils were seen under both CMFDA (green) and APC-streptavidin (red) optics, whereas internalized apoptotic neutrophils were visualized only under CMFDA (green) optics.
For non-specific phagocytic uptake, phagocytosis of latex reads-rabbit IgG-FITC complex (Cayman Chemical Company, Ann Arbor, MI) was performed according to the manufacturer’s instruction. Phagocytosis of dextran was performed by adding FITC-dextran (M.W. 70,000, Sigma-Aldrich) to the cell suspension at different final concentrations. The cells were incubated for 45 min at 37 °C, washed with ice-cold PBS, and analyzed by FACS.
Actin polymerization and Confocal microscopy
After treatment, cells were fixed, permeabilized and stained with Alexa Fluor 563 conjugated phalloidin (Molecular Probes). The nuclei were visualized with DAPI staining. The cells were affixed on glass cover slip by cytospin (Shandon). The cover slip was mounted on a glass slide using PermaFluor mounting medium (Thermo-Fisher). Microscopic analysis was performed on a Leica TCS SP8 inverted fluorescent confocal microscope (Leica).
Rac1 activation
GST-p21 binding domain (GST-PBD) was immobilized by adsorption to glutathione-sepharose beads (GE Healthcare). After SAA stimulation, BMDMs (2×10⁶) were lysed in RIPA buffer (25 mM Tris-HCl pH 7.6, 150 mM NaCl, 1% NP-40, 1% sodium deoxycholate, 0.1% SDS). The lysate was mixed with the immobilized GST-PBD, and gently rotated at 4 °C for 60 min. The beads were collected by centrifugation and washed before SDS-PAGE analysis (12% polyacrylamide). The GTP-bound Rac1 that was pulled down was detected by Western blotting using an anti-Rac1 antibody (Cell Signaling Technologies).
siRNA interference
The mouse macrophage cell line RAW264.7 was transfected with siRNA using a Silencer® siRNA Transfection II Kit (Ambion, Austin, TX) according to the manufacturer’s instructions. The HiPerFect transfection reagent (Qiagen) was used for siRNA transfection of human monocyte-derived macrophages. The cells were then cultured for 48 h before stimulation. The siRNA oligonucleotides were designed and synthesized by Shanghai RIBOBIO Co.,LTD (Guangzhou, China).
Chromatin immunoprecipitation assay
Chromatin immunoprecipitation (CHIP) was performed using a CHIP assay kit (Millipore, Billerica, MA) according to the manufacturer’s instruction with minor modifications. Briefly, 5×10⁶ THP-1 cells were spread in 6-well cell culture cluster (Corning) and stimulated with or without SAA at specified concentrations. After stimulation, cells were cross-linked and then washed and resuspended in SDS lysis buffer. Nuclei were fragmented by sonication. Chromatin fractions were precleared with protein A-agarose beads followed by immnoprecipitation overnight with an anti-IRF4 Ab or a control IgG. Cross-linking was reversed and proteinase K digestion was performed. The input and immonoprecipitated DNA were amplified by real-time PCR. The ratio of the amount of DNA recovered relative to the input control was calculated.
Statistical analysis
For each experimental group, data are presented as mean ±SEM (n ≥ 3). Statistical significance among different samples was assessed with paired Student t test, or one-way ANOVA with repeated measures if treatment groups were more than two. Statistical significance was defined as *, P<0.05 and **, P<0.01. Analysis and graphing were performed using the Prism software (ver. 5.0; GraphPad, San Diego, CA).
Results
Upregulation of M2 macrophage markers following SAA stimulation
Previous studies have shown that SAA has cytokine-like activity and can stimulate phagocyte production of proinflammatory cytokines including TNFα, IL-1β, IL-6, IL-12p40, IL-23p19 and G-CSF (24–29). It is unclear whether SAA can induce other genes relevant to macrophage reprogramming. To test this possibility, human CD14+ monocytes from peripheral blood (PBMCs) were stimulated with recombinant human SAA (apo-SAA, 0.5 μM). Real-time PCR was performed to quantify the transcripts of IL-10, IL-1Rn, MRC1 and CCL17. Time-dependent induction of these M2 macrophage markers was observed (Fig. 1A). In mice, the transcripts of these M2 markers were induced in bone marrow-derived macrophages (BMDMs; Fig. 1B) and peritoneal macrophages (Fig. 4) upon SAA stimulation. At the protein level, there was a 30-fold increase in IL-10 production that peaked at 8 h after SAA stimulation (Fig. 2A). Increased cell surface expression of Mrc-1 (Fig. 2B) and upregulated Ym1 production (Fig. 2C) was also observed in SAA-stimulated BMDMs. In addition, there was a 3-fold increase in arginase 1 expression (Arg1; Fig. 2D), along with increased arginase activity (13.74 ± 1.52-fold over control; Fig. 2E). SAA was compared with IL-4, a prototype M2 macrophage inducer, in the induction of arginase activity (Fig. 2F). In contrast, LPS, a classic activator of macrophages, only had a minor effect on arginase activity (Fig. 2F).
Figure 1.

SAA induces the transcripts of M2 macrophage marker genes. (A) Human CD14+ monocytes were stimulated for up to 24 h with apo-SAA (0.5 μM). The relative abundance of transcripts for IL-10, IL-1Rn, MRC1 and CCL17 was assessed by qRT-PCR. (B) BMDMs from C57BL/6 mice were stimulated for up to 24 h with 0.5 μM of SAA. The relative abundance of transcripts for IL-10, IL-1Rn, Fizz-1, Mrc1, CCL17 and Ym1 were assessed by qRT-PCR and compared to that of untreated mouse BMDMs. Data shown are means ± SEM from three independent experiments. *, p<0.05, **, p<0.01.
Figure 4.

Effect of human SAA1 on peritoneal macrophages. (A) WT C57BL/6 mice were given peritoneal injection of recombinant human SAA1 (25 μg in 100 μl PBS). After 18 h, peritoneal lavage was performed and CD11b+ F4/80+ macrophages (1×10⁶) were collected for RNA preparation. The abundance of selected M2 marker gene transcripts was assessed by qRT-PCR. Data shown are means ± SEM from macrophages derived from PBS (con) and SAA1 (SAA) treated mice (6 per group). (B) IL-10 released by the peritoneal macrophages was detected using ELISA. For Ym1 and Arg1 protein level, total cell lysate was prepared from the collected peritoneal macrophages (1×10⁶) and subjected to western blotting. Densitometry data are shown. Cell surface expression of Mrc1 (CD206) was determined by flow cytometry. (C) The activity of Arg1 was determined as described in Figure 2. A total of 6 mice were used for each experimental condition in B, C. Western blotting data were quantified using Quantity One (Bio-Rad, Hercules, CA). All data are shown as means ± SEM. (D) CMFDA-labeled early apoptotic neutrophils were injected into peritoneal cavity 18 h after SAA1 administration. Two hours later, CD11b+ F4/80+ macrophages from peritoneal lavage were analyzed for the uptake of apoptotic neutrophils based on CMFDA fluorescence using flow cytometry. Representative histograms (6 mice each group) are shown. (E) Phagocytic index was calculated based on data from 6 mice in each group. *, p<0.05 and **, p<0.01 in this figure.
Figure 2.

SAA induces M2 macrophage markers at protein level. (A) BMDMs were stimulated for up to 24 h with apo-SAA (0.5 μM). The level of IL-10 protein was assessed as a function of time using ELISA. Data shown are means ± SEM from three experiments. (B) After SAA (0.5 μM) treatment for 24 h, cell surface expression of MRC1 (CD206) was detected by flow cytometry. Data shown are representative of three experiments. (C and D) After SAA (0.5 μM) treatment for the indicated times, Ym1 (C) and arginase 1 (Arg1, D) protein expression was detect by western blotting. Densitometry values (means±SEM) from three independent experiments are shown in the bar charts. (E) Dose-dependent induction of arginase 1 activity by SAA. BMDMs were stimulated for 24 h with SAA at the indicated concentrations, and the induced arginase 1 activity was determined. (F) Comparison of SAA (0.5 μM), LPS (100 ng/ml) and IL-4 (20 ng/ml) for their ability to stimulate arginase 1 activity. BMDMs (2×10⁶/sample) were stimulated for 24 h at the above concentrations. Arginase 1 activity was then determined as described in Materials and Methods. Data shown are means ± SEM from three experiments. *, p<0.05; **, p<0.01.
Macrophages stimulated with SAA are more efficient in efferocytosis
Resolution of inflammation requires timely removal of bacteria and apoptotic cells, the latter being accomplished through a process termed efferocytosis (37). In vitro phagocytosis assays were performed to determine if SAA could affect efferocytosis of apoptotic neutrophils. BMDMs were cultured in complete medium for 5 days, and LPS (for M1), IL-4 (for M2), fresh medium (for M0) or SAA was added to the cell culture to induce different macrophage phenotypes for another 2 days. CMFDA (5-chloromethylfluorescein diacetate)-labeled early apoptotic neutrophils were added at a 1:1 (macrophages:neutrophils) ratio for a 1-h incubation. After quenching non-phagocytosed cells, the macrophages were analyzed by flow cytometry. As shown in Fig. 3A, the ability of BMDMs to clear apoptotic neutrophils was markedly increased in samples containing SAA, with a phagocytic index comparable to or better than that of the IL-4-treated cells. A concentration-dependent increase in efferocytosis was seen between 0.05 and 1.0 μM of SAA (Fig. 3B).
Figure 3.

Macrophages stimulated with SAA display enhanced efferocytosis. (A) BMDMs were treated with vehicle (con), apo-SAA (0.5 μM), LPS (100 ng/ml) or IL-4 (20 ng/ml) for 48 h. Efferocytosis assay was conducted by adding CMFDA-labeled early apoptotic neutrophils (PMN), as described in Materials and Methods. Data are expressed as the percentage of phagocytosed apoptotic cells (phagocytic index ± SEM, n = 6). *, p<0.05, **, p<0.01. (B) Effect of apo-SAA at different concentrations (from bottom to top: 0 (without apoptotic PMN), 0, 0.05, 0.10 and 1.0 μM with apoptotic PMN, respectively). Representative (n=3) mean fluorescence intensity was shown. (C) Confocal microscopic images showing the effect of SAA on macrophage efferocytosis, using the same experimental condition as in A. Arrows indicate F-actin (red) and phagocytosed CMFDA-labeled early apoptotic neutrophils (green), representative of three independent experiments. (D) Rac1 activation in BMDMs treated with 0.5 μM of apo-SAA for the indicated times. GTP-bound Rac1 in cell lysate was pulled down with GST-PBD and evaluated by western blotting using an anti-Rac1 antibody. Total Rac1 was detected in cell lysate without PBD pull-down. Densitometry values (means ± SEM) from 3 independent experiments are shown in the bottom panel. *, p<0.05.
To further determine whether the increase in phagocytic index is a consequence of improved uptake efficiency or specific for the apoptotic neutrophils, we performed phagocytosis experiments using FITC-labeled dextran and fluorescently labeled latex beads. SAA treatment using the same experimental condition as in Fig. 3 did not alter phagocytosis of dextran or latex beads when compared to medium-treated cells (data not shown). Thus, the effect of SAA on efferocytosis appears to be specific for the uptake of apoptotic neutrophils.
Localized polymerization of actin filaments is associated with the formation of pseudopodia that surround the bacterial particles or apoptotic cells to be engulfed (38, 39). In SAA-stimulated macrophages, F-actin rearrangement was found at sites of apoptotic cell ingestion (Fig. 3C). Likewise, activation of the small GTPase Rac1 was observed in SAA-stimulated macrophages (Fig. 3D). These results suggest a correlation between SAA-stimulated Rac activation and increased macrophage efferocytosis (38).
Peritoneal administration of SAA induces M2-like macrophage phenotype
The physiological functions of SAA remain an unsettled issue (31, 32) since early studies used commercially available recombinant human SAA (Apo-SAA) that contain substitution at two positions in SAA1. To address this concern, we tested the ability of recombinant human SAA1 (Apo-SAA1) to induce M2 markers in mouse peritoneal cavity. SAA1 or PBS was administered into the peritoneal cavity for 18 h; peritoneal macrophages were collected and the induction of selected M2 markers was measured. SAA1 potently induced the M2 markers at the mRNA (Fig. 4A) and protein levels (Fig. 4B). In addition, peritoneal macrophages isolated from SAA1-treated mice displayed higher arginase activities than those from PBS-treated mice (Fig. 4C). To investigate the effect of SAA1 on macrophage efferocytosis, CMFDA-labeled early apoptotic neutrophils from mice were injected into the peritoneal cavity of C57BL/6 mice 18 h after SAA1 administration. Peritoneal macrophages were isolated 2 h later, and the uptake of apoptotic neutrophils by CD11b+ F4/80+ macrophages was quantified by flow cytometry (Fig. 4D). Macrophage efferocytosis of apoptotic neutrophils was significantly higher in SAA1-treated samples than in PBS-treated controls (Fig. 4E). Collectively, these results show that SAA1, like the recombinant apo-SAA, is able to induce M2-like macrophage phenotype.
IRF4 is critical to SAA-induced M2-like phenotype and macrophage efferocytosis
Since classical activation of M2 macrophage is mediated through a Stat6-dependate pathway (1), we investigated the involvement of Stat6 in SAA-induced expression of the M2 markers. As shown in Supplemental Fig. S1A, induction of the M2 macrophage markers by SAA was largely intact in Stat6-deficient BMDM. In addition, promotion of BMDM efferocytosis by SAA was not affected by Stat6 deficiency (Supplemental Fig. S1B). These results suggest that the SAA-induced phenotypic change differs from classical activation of M2 macrophages, which requires IL-4-dependent Stat6 activation. Among other transcription factors that might be involved, IRF4 has been recently identified as an important transcription factor for M2 macrophage polarization (40). Indeed, the level of IRF4 transcripts was markedly increased following SAA stimulation in both THP-1 and human CD14+ monocytes, and the kinetics was consistent with the expression of the M2 markers examined (Fig. 5A and Supplemental Fig. S2A). An increase in IRF4 protein was also observed based on western blot analysis of whole cell lysate prepared from SAA-stimulated samples (Fig. 5B). In contrast, SAA had little effect on IRF5 expression. A human IRF4 promoter-driven luciferase reporter (pGL3-IRF4) was constructed and transiently transfected into the human monocytic cell line THP-1. Stimulation of the transfected cells with SAA (0.5 μM) led to an increase in luciferase activity, confirming that SAA could activate IRF4 gene transcription (Fig. 5C). Given the robust response of IRF4 expression to SAA stimulation, IRF4 recruitment to the promoters of selected M2 marker genes was examined by chromatin immunoprecipitation (ChIP). In SAA-treated THP-1 (Fig. 5D) and PBMCs (Supplemental Fig. S2B), anti-IRF4 but not control IgG was found to precipitate products that were subsequently amplified by PCR with primers specific for the promoters of IL-10 and Arg1. These results support an increase in the DNA binding activity of IRF4 following SAA stimulation.
Figure 5.
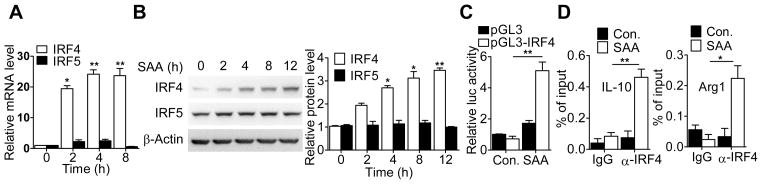
SAA induces IRF4 expression and activation. (A) Time-dependent induction of IRF4 and IRF5 transcripts in SAA-stimulated THP-1 cells. The cells (2×10⁶/sample) were stimulated with 0.5 μM of apo-SAA for different time periods as indicated. Total RNA was extracted for detection of IRF4 and IRF5 transcripts by qRT-PCR. (B) Time-dependent induction of IRF4 and IRF5 protein in apo-SAA (0.5 μM) stimulated THP-1 cells. IRF4 and IRF5 in total cell lysate was detected by western blotting with antibodies specific to IRF4 and IRF5, respectively (left). β-actin was detected for loading control. Densitometry values (means ± SEM) from 3 separate measurements are shown in the right. (C) Activation of the human IRF4 promoter by SAA was assayed in transiently transfected THP-1 cells expressing a human IRF4 promoter-luciferase reporter (-1992/+13). The transfected cells were treated with 0.5 μM of apo-SAA for 16 h. Luciferase activity was normalized against that of co-transfected Renilla luciferase plasmid. (D) ChIP assay showing IRF4 binding to the IL-10 and Arg1 promoters. THP-1 cells were incubated with medium alone or apo-SAA (0.5 μM) for 1 h. Chromatin samples were immunoprecipitated with anti-IRF4 rabbit polyclonal Ab or an isotype-matched IgG as a control. Real-time PCR was performed to quantify IRF4 binding to the IL-10 and Arg1 promoters. The input DNA was used as a reference point. Data (means ± SEM) from 3 representative experiments are shown. *, p<0.05, **, p<0.01.
To determine whether IRF4 is required for SAA induction of M2 markers, siRNA was used to silence IRF4 expression (Fig. 6A). Transfection of the specific siRNA led to a significant reduction in SAA-induced expression of IL-10, IL-1Rn and CCL17, and in arginase activity in RAW264.7 macrophages (Fig. 6B) and in human CD14+ monocytes (Supplemental Fig. S2D). Potentiation of macrophage efferocytosis by SAA was reduced by more than 80% in the siRNA1-transfected cells (Fig. 6C, 6D).
Figure 6.

Effect of IRF4 deficiency on SAA-induced M2 marker gene expression and efferocytosis. (A) RAW264.7 cells were transfected with siRNAs targeting IRF4 or with a negative control siRNA (NC). After 48 h, the effect of siRNA knockdown was evaluated with qRT-PCR for the IRF4 transcript (left panel) and with immunoblotting for IRF4 protein (right panel). Data shown are means ± SEM from 3 experiments. (B) RAW264.7 cells were transfected with normal control siRNA (NC) or an IRF4-specific siRNA (siRNA1), and then stimulated with apo-SAA or medium. The expression level of the M2 marker genes was determined by qRT- PCR. Arginase activity was determined as described in Figure 2. Data shown are means ± SEM from 3 experiments, with similar results. *, p<0.05, **, p<0.01. (C) RAW264.7 cells were stimulated for 48 h with apo-SAA (0.1 μM) after transfection with siRNA1 or NC siRNA for 24 h. Efferocytosis of apoptotic neutrophils was detected as described in Figure 3. The histograms shown are representative of 4 independent experiments. (D) Phagocytic index of C was calculated based on data from three independent experiments. *, p<0.05.
Signaling pathways for SAA induction of M2 markers and efferocytosis
The above results suggest an important role for IRF4 in SAA-induced M2 marker gene expression and macrophage efferocytosis. Experiments were conducted to explore the regulatory mechanism for IRF4 expression using pharmacological inhibitors. As shown in Fig. 7A, the PI3K inhibitor LY294002 and the MEK inhibitor PD98059 significantly reduced the accumulation of IRF4 transcripts, possibly at the transcriptional level based on IRF4-driven luciferase reporter activity (Fig. 7B). The observed inhibition was not due to cytotoxicity, as the majority (>85%) of the cells remained viable under the experimental condition (data not shown). Furthermore, LY294002 and PD98059 also significantly decreased SAA-induced expression of IL-10, IL-1Rn and CCL17 (Fig. 7C) and Mrc1 (CD206) expression in SAA-treated BMDMs (Fig. 7D). The SAA-induced arginase activity and efferocytosis were inhibited by PD98059 and LY294002 (Fig. 7E, F). No significant inhibition was seen with SP600125 (a JNK inhibitor) and SB203580 (a p38 MAPK inhibitor). These data suggested that the ERK and PI3K pathways are critical for SAA induction of M2 macrophage markers and efferocytosis.
Figure 7.

Requirement of ERK and PI3K for SAA-induced M2 marker gene expression and macrophage efferocytosis. (A) BMDMs were pre-incubated for 1 h with LY294002 (10 μM), PD98059 (10 μM), SB203580 (10 μM), SP600125 (10 μM) or vehicle (same DMSO content as indicated by the negative sign). The cells were then stimulated with apo-SAA (0.5 μM) for 4 h. The relative expression level of IRF4 transcript was measured by qRT-PCR. (B) After transfection with the pGL3-IRF4 luciferase reporter, THP-1 cells were treated with the indicated inhibitors and with apo-SAA as described in A. The induced luciferase activity was measured. (C and D) Mouse BMDMs were treated with pharmaceutical inhibitors as described above. After SAA stimulation for 12 h (6 h for IL-10), the relative expression levels of selected M2 markers were measured by qRT-PCR (C) and by flow cytometry (for Mrc1, D). (E and F) Mouse BMDMs were treated with pharmaceutical inhibitors and with apo-SAA as described above in A. The activity of Arginase-1 (E) and efferocytosis of apoptotic neutrophils (F) were measured as described in Figure 2 and Figure 3, respectively. All data shown in A, B, C–E are means ± SEM from 3–4 experiments. *, p<0.05; **, p<0.01.
SAA is known to activate several receptors including FPR2, TLR2 and TLR4 (28, 41, 42). The role for these receptors in SAA-induced expression of IRF4 and M2 macrophage markers was examined. As shown in Fig. 8A, deficiency in TLR2 and MyD88, but not fpr2, significantly decreased SAA-induced expression of IRF4 in BMDM (Fig. 8A). Likewise, BMDMs from Tlr2−/− and Myd88−/− mice responded to SAA with significantly reduced expression of IL-10, IL-1Rn and CCL17 (Fig. 8B). Furthermore, deletion of myd88 and tlr2 also significantly impacted the effect of SAA on efferocytosis (Fig. 8C, D). Taken together, these results suggest that the effect of SAA on the induction of the M2 marker genes and on efferocytosis may involve the MyD88-IRF4 pathway. Interestingly, TLR4 deficiency did not significantly alter the expression of the M2 markers, nor did it affect SAA potentiation of macrophage efferocytosis (Supplemental Fig. S3), suggesting that TLR4 plays a less important role in these settings.
Figure 8.

SAA induces M2 macrophage markers and efferocytosis in a TLR2- and MyD88-dependent manner. (A) BMDMs from mice lacking Tlr2, Myd88 or Fpr2 and from their WT littermates were stimulated with 0.5 μM apo-SAA for 4 h. The relative expression level of IRF4 was measured by qRT-PCR. (B) BMDMs from these mice were stimulated with 0.5 μM apo-SAA for 12 h (6 h for IL-10). The relative expression levels of selected M2 macrophage markers were measured by qRT-PCR. All data shown in this figure (A, B) are means ± SEM from 3–4 experiments. *, p<0.05; **, p<0.01. (C, D) BMDMs lacking Myd88 (C) or Tlr2 (D) were treated with 0.5 μM SAA for 48 h. Efferocytosis assay was conducted as described in Materials and Methods. Representative histograms are shown. The phagocytic indexes were calculated based on 6 mice in each group and shown in bar charts. *, p<0.05 and **, p<0.01 in this figure.
Discussion
Elevated levels of SAA have been associated with a variety of inflammatory diseases resulting from infectious and non-infectious causes (reviewed in (17, 43)). However, the exact role of SAA in inflammation has not been fully understood. Prior to this study, experimental evidence favors the concept that SAA is proinflammatory, as this acute-phase protein is chemotactic and capable of inducing proinflammatory cytokines such as TNF-α, IL-1β and IL-8 in in vitro settings. A previous attempt for in vivo expression of SAA1 in mice, through adenoviral infection that increases circulating level of SAA (32), did not result in systemic or local inflammatory response. These findings have led us to question whether SAA is proinflammatory in vivo. Here we report that SAA plays a role in macrophages reprogramming. Our results show that SAA induces M2 macrophage markers and promotes macrophage efferocytosis of apoptotic neutrophils. These actions are consistently observed ex vivo with isolated monocytes and macrophages, and in vitro with primary human CD14+ monocytes and cultured cell lines such as THP-1 and RAW264.7. In addition, peritoneal administration of SAA produced similar effects. Together, these findings suggest a potential function of SAA to promote resolution of inflammation, tissue repair and remodeling through induction of M2-like macrophages.
Macrophage efferocytosis of apoptotic neutrophils is critical to the resolution of inflammation (37). Our data show that SAA increases the rate of efferocytosis, comparable to that of cells stimulated with IL-4. SAA was previously reported to rescue isolated neutrophils from constitutive apoptosis, thus extending their lifespan (44). These findings suggest a possibly homeostatic function of SAA through its actions on different types of cells. The chemotactic and anti-apoptotic functions of SAA may accelerate inflammation at its early stage by attracting additional neutrophils to the site of inflammation, whereas the ability of SAA to induce M2 macrophage markers and promote macrophage efferocytosis is expected to facilitate resolution of inflammation at its late stage. Our observation that peritoneal administration of SAA produces an M2-like macrophage phenotype indicates that this function may be preserved in vivo, where different cells and signaling crosstalk are present. It is likely that SAA functions differently in different experimental settings, hence requiring additional work in vivo to determine its functions during inflammation.
The functional plasticity of macrophages is the result of crosstalk between different receptors and signal cascades. The network is likely complex, including the interactions between receptors, adaptor proteins, and the expression and activation of transcription factors. Although the transcription factor Stat6 is a major driving force for the expression of M2 markers following IL-4 stimulation, it remains inactive in SAA-treated macrophages (data not shown). In addition, our results demonstrate for the first time that SAA induces the expression and activation of IRF4 in monocytes and macrophages. IRF4 was recently identified as a key transcription factor that controls the expression of a variety of M2 markers (40). Our results show that SAA induces IRF4 transcription and promotes IRF4 binding to the promoters of IL-10 and Arg1. Likewise, loss of IRF4 abrogates SAA induction of the M2 markers and macrophage efferocytosis of apoptotic neutrophils. It has been reported that IRF4 expression requires Jmjd3, a histone demethylase that releases transcriptional repression of the Irf4 promoter (40). In a separate study completed recently, we found that SAA could induce the expression of Jmjd3, resulting in diminished histone H3 methylation at lysine 27 (45). As shown in Supplemental Figure S4, Jmjd3 deficiency by shRNA silencing significantly reduced the expression of IRF4 and the M2 markers in SAA-stimulated RAW26.4 cells. Silencing Jmjd3 expression also reduced SAA potentiation of macrophage efferocytosis. Taken together, these results show that SAA affects macrophage phenotype at least in part through the Jmjd3-IRF4 pathway (46). Epigenetic regulation of SAA-induced gene expression was not previously known, and could potentially produce a broad effect in the target cells.
The cytokine-like activity of SAA was first associated with its ability to stimulate phagocyte production of proinflammatory cytokines including TNFα, IL-1β, IL-6, IL-12p40, IL-23p19 and G-CSF (24–29). This cytokine-like activity now has been redefined by induction of several M2 macrophage markers. Given that SAA is capable of activate both M1 and M2 macrophage markers, it is likely that the “dual actions” of SAA is regulated through multiple signaling pathways. It is known that several receptors including FPR2, TLR2 and TLR4 are activated by SAA (28, 41, 42). Our data from different gene deletion or functionally deficient mice show that the TLR2 and MyD88 signal cascades are essential for the activation of IRF4 as well as the expression of M2 markers and efferocytosis. In most published studies, activation of TLRs can skew macrophages towards an M1 phenotype. It is therefore interesting to observe that SAA-induced expression of M2 macrophage markers is significantly reduced in tlr2−/− macrophages. This TLR appears to play a pivotal role in SAA-induced expression of multiple cytokines including IL-10 and IL-1rn (28). Induction of IL-10 has also been observed in SAA-stimulated neutrophils, in an iNKT cell regulated manner (47). Thus, SAA may exert biological actions in a cell-specific manner. In addition, SAA activation of IRF4, which interacts with MyD88, may initiate a negative regulatory mechanism that suppresses TLR-dependent expression of proinflammatory cytokines (48). In a preliminary study, we found that the expression of the M1 markers, such as IL-1β, TNF-α and IL-6, was not decreased in IRF4 knock-down cells compared with control cells (data not shown). Interestingly, a more profound effect was observed with myd88 deletion than tlr2 deletion, suggesting that in addition to mediating signaling initiated by TLR2, MyD88 has another unidentified function relevant to SAA-induced expression of certain cytokines. Collectively, these findings suggest homeostatic regulation of the inflammatory process by SAA through crosstalk with different signaling pathways.
SAA is a group of proteins of approximately 104 amino acids, encoded by different genes (49). In humans, SAA1 and SAA2 (94% identical) are inducible, SAA3 is a pseudogene, and SAA4 is constitutively expressed. Although it is not yet possible to assign the M2-like skewing capability to a specific isoform of SAA, our results show that this function is shared by human SAA1 and apo-SAA from PeproTech, the latter being a hybrid of SAA1 and SAA2 (SAA1 with Asp61 and His72 substituted by Asn and Arg from SAA2, respectively). It was reported recently that the SAA hybrid is more potent than SAA1 in the induction of proinflammatory cytokine genes (31). However, our results from ex vivo and in vitro studies (using SAA1 and apo-SAA) are similar, suggesting that both the SAA hybrid (apo-SAA) and SAA1 are able to skew macrophages towards an M2-like phenotype. Endogenous SAA purified from blood of cardiac surgery patients is as active as the SAA hybrid in the induction of G-CSF production by the J774 macrophages (32). However, systemic elevation of blood SAA levels through infection with human SAA1-adenoviral vectors failed to increase G-CSF levels in the blood (32). In contrast, subcutaneous injection of SAA resulted in neutrophilia accompanied by an increase in G-CSF concentrations in the blood (27). These findings indicate that the microenvironment, in which SAA is present, can impact the functions of SAA. In blood circulation SAA is closely associated with HDL, and the HDL-bound SAA has diminished cytokine-inducing property (24). In contrast, intraperitoneal administration of SAA1 skewed macrophages towards an M2-like phenotype that was comparable to the ex vivo phenotype induced by the SAA hybrid. Activated macrophages are a major source of non-hepatic SAA, thus creating a potential autocrine loop for efficient utilization of the newly secreted SAA at inflammatory tissues.
It is postulated that the acute-phase response serves the purpose of isolating pathogens, minimizing injury to the host and promoting tissue repair (16). As a major acute-phase protein, SAA binds to several Gram-negative bacteria and facilitates their elimination by phagocytes (50). Our results, together with the report that iNKT cells regulate the production of IL-10 in SAA-stimulated neutrophils (47), suggest a potential role for SAA to promote clearance of apoptotic neutrophils, limit inflammation and facilitate its resolution.
Supplementary Material
Acknowledgments
We thank Dr. Ji Ming Wang for the Fpr2 knockout mice, Dr. Mingjie Chen for technical assistance and Dr. Runsheng Li for helpful discussions.
Abbreviations
- SAA
serum amyloid A
- IRF4
Interferon regulatory factor 4
- Ym1
chitinase 3-like 3, Chi3l3
- Fizz-1
found in inflammatory zone-1, Retnla
- MRC1
mannose receptor 1
- IL-1Rn
IL-1 receptor antagonist
- PBMCs
peripheral blood monocytes
- PMN
polymorphonuclear neutrophil
- FPR2
formyl peptide receptor 2, FPRL1/ALX
- TLR2
toll like receptor 2
- PTX
pertussis toxin
- CMFDA
5-chloromethylfluorescein diacetate
- ChIP
chromatin immunoprecipitation
Footnotes
This work was supported in part by grants from National Natural Science Foundation of China (Grants 81202316), National Basic Research Program of China (973 Program, Grant 2012CB518000), the Specialized Research Fund for the Doctoral Program of Higher Education of China (Grants 20120073110069 and 20120073120092), and from U.S. National Institutes of Health (R01AI033503 and R56AI040176).
Disclosures
The authors have no financial conflict of interests.
References
- 1.Gordon S. Alternative activation of macrophages. Nat Rev Immunol. 2003;3:23–35. doi: 10.1038/nri978. [DOI] [PubMed] [Google Scholar]
- 2.Martinez FO, Sica A, Mantovani A, Locati M. Macrophage activation and polarization. Front Biosci. 2008;13:453–461. doi: 10.2741/2692. [DOI] [PubMed] [Google Scholar]
- 3.Martinez FO, Gordon S, Locati M, Mantovani A. Transcriptional profiling of the human monocyte-to-macrophage differentiation and polarization: new molecules and patterns of gene expression. J Immunol. 2006;177:7303–7311. doi: 10.4049/jimmunol.177.10.7303. [DOI] [PubMed] [Google Scholar]
- 4.Mosser DM, Edwards JP. Exploring the full spectrum of macrophage activation. Nat Rev Immunol. 2008;8:958–969. doi: 10.1038/nri2448. [DOI] [PMC free article] [PubMed] [Google Scholar]
- 5.Benoit M, Desnues B, Mege JL. Macrophage polarization in bacterial infections. J Immunol. 2008;181:3733–3739. doi: 10.4049/jimmunol.181.6.3733. [DOI] [PubMed] [Google Scholar]
- 6.Raes G, Van den Bergh R, De Baetselier P, Ghassabeh GH, Scotton C, Locati M, Mantovani A, Sozzani S. Arginase-1 and Ym1 are markers for murine, but not human, alternatively activated myeloid cells. J Immunol. 2005;174:6561. doi: 10.4049/jimmunol.174.11.6561. author reply 6561–6562. [DOI] [PubMed] [Google Scholar]
- 7.Mantovani A, Sica A, Sozzani S, Allavena P, Vecchi A, Locati M. The chemokine system in diverse forms of macrophage activation and polarization. Trends Immunol. 2004;25:677–686. doi: 10.1016/j.it.2004.09.015. [DOI] [PubMed] [Google Scholar]
- 8.Mantovani A, Biswas SK, Galdiero MR, Sica A, Locati M. Macrophage plasticity and polarization in tissue repair and remodelling. J Pathol. 2013;229:176–185. doi: 10.1002/path.4133. [DOI] [PubMed] [Google Scholar]
- 9.Nathan C. Neutrophils and immunity: challenges and opportunities. Nat Rev Immunol. 2006;6:173–182. doi: 10.1038/nri1785. [DOI] [PubMed] [Google Scholar]
- 10.Henson PM, Bratton DL, Fadok VA. Apoptotic cell removal. Curr Biol. 2001;11:R795–805. doi: 10.1016/s0960-9822(01)00474-2. [DOI] [PubMed] [Google Scholar]
- 11.Kennedy AD, DeLeo FR. Neutrophil apoptosis and the resolution of infection. Immunol Res. 2009;43:25–61. doi: 10.1007/s12026-008-8049-6. [DOI] [PubMed] [Google Scholar]
- 12.Gordy C, Pua H, Sempowski GD, He YW. Regulation of steady-state neutrophil homeostasis by macrophages. Blood. 2011;117:618–629. doi: 10.1182/blood-2010-01-265959. [DOI] [PMC free article] [PubMed] [Google Scholar]
- 13.Bystrom J, Evans I, Newson J, Stables M, Toor I, van Rooijen N, Crawford M, Colville-Nash P, Farrow S, Gilroy DW. Resolution-phase macrophages possess a unique inflammatory phenotype that is controlled by cAMP. Blood. 2008;112:4117–4127. doi: 10.1182/blood-2007-12-129767. [DOI] [PMC free article] [PubMed] [Google Scholar]
- 14.Fernandez-Boyanapalli R, Frasch SC, Riches DW, Vandivier RW, Henson PM, Bratton DL. PPARgamma activation normalizes resolution of acute sterile inflammation in murine chronic granulomatous disease. Blood. 2010;116:4512–4522. doi: 10.1182/blood-2010-02-272005. [DOI] [PMC free article] [PubMed] [Google Scholar]
- 15.Schif-Zuck S, Gross N, Assi S, Rostoker R, Serhan CN, Ariel A. Saturated-efferocytosis generates pro-resolving CD11b low macrophages: modulation by resolvins and glucocorticoids. Eur J Immunol. 2011;41:366–379. doi: 10.1002/eji.201040801. [DOI] [PMC free article] [PubMed] [Google Scholar]
- 16.Kushner I, Rzewnicki D. Acute phase response. In: Gallin JI, Snyderman R, editors. Inflammation: Basic principles and clinical correlates. 3. Lippincott Willams & Wilkins; Philadelphia: 1999. pp. 317–329. [Google Scholar]
- 17.Gabay C, Kushner I. Acute-phase proteins and other systemic responses to inflammation. N Engl J Med. 1999;340:448–454. doi: 10.1056/NEJM199902113400607. [DOI] [PubMed] [Google Scholar]
- 18.Jensen LE, Whitehead AS. Regulation of serum amyloid A protein expression during the acute-phase response. Biochem J. 1998;334:489–503. doi: 10.1042/bj3340489. [DOI] [PMC free article] [PubMed] [Google Scholar]
- 19.O’Hara R, Murphy EP, Whitehead AS, FitzGerald O, Bresnihan B. Acute-phase serum amyloid A production by rheumatoid arthritis synovial tissue. Arthritis Res. 2000;2:142–144. doi: 10.1186/ar78. [DOI] [PMC free article] [PubMed] [Google Scholar]
- 20.Fyfe AI, Rothenberg LS, DeBeer FC, Cantor RM, Rotter JI, Lusis AJ. Association between serum amyloid A proteins and coronary artery disease: evidence from two distinct arteriosclerotic processes. Circulation. 1997;96:2914–2919. doi: 10.1161/01.cir.96.9.2914. [DOI] [PubMed] [Google Scholar]
- 21.De Beer FC, Mallya RK, Fagan EA, Lanham JG, Hughes GR, Pepys MB. Serum amyloid-A protein concentration in inflammatory diseases and its relationship to the incidence of reactive systemic amyloidosis. Lancet. 1982;2:231–234. doi: 10.1016/s0140-6736(82)90321-x. [DOI] [PubMed] [Google Scholar]
- 22.Kumon Y, Suehiro T, Itahara T, Ikeda Y, Hashimoto K. Serum amyloid A protein in patients with non-insulin-dependent diabetes mellitus. Clin Biochem. 1994;27:469–473. doi: 10.1016/0009-9120(94)00044-v. [DOI] [PubMed] [Google Scholar]
- 23.Badolato R, Wang JM, Murphy WJ, Lloyd AR, Michiel DF, Bausserman LL, Kelvin DJ, Oppenheim JJ. Serum amyloid A is a chemoattractant: induction of migration, adhesion, and tissue infiltration of monocytes and polymorphonuclear leukocytes. J Exp Med. 1994;180:203–209. doi: 10.1084/jem.180.1.203. [DOI] [PMC free article] [PubMed] [Google Scholar]
- 24.Patel H, Fellowes R, Coade S, Woo P. Human serum amyloid A has cytokine-like properties. Scand J Immunol. 1998;48:410–418. doi: 10.1046/j.1365-3083.1998.00394.x. [DOI] [PubMed] [Google Scholar]
- 25.He R, Sang H, Ye RD. Serum amyloid A induces IL-8 secretion through a G protein-coupled receptor, FPRL1/LXA4R. Blood. 2003;101:1572–1581. doi: 10.1182/blood-2002-05-1431. [DOI] [PubMed] [Google Scholar]
- 26.He R, Shepard LW, Chen J, Pan ZK, Ye RD. Serum amyloid A is an endogenous ligand that differentially induces IL-12 and IL-23. J Immunol. 2006;177:4072–4079. doi: 10.4049/jimmunol.177.6.4072. [DOI] [PubMed] [Google Scholar]
- 27.He RL, Zhou J, Hanson CZ, Chen J, Cheng N, Ye RD. Serum amyloid A induces G-CSF expression and neutrophilia via Toll-like receptor 2. Blood. 2009;113:429–437. doi: 10.1182/blood-2008-03-139923. [DOI] [PMC free article] [PubMed] [Google Scholar]
- 28.Cheng N, He R, Tian J, Ye PP, Ye RD. Cutting Edge: TLR2 Is a Functional Receptor for Acute-Phase Serum Amyloid A. J Immunol. 2008;181:22–26. doi: 10.4049/jimmunol.181.1.22. [DOI] [PMC free article] [PubMed] [Google Scholar]
- 29.Ather JL, Ckless K, Martin R, Foley KL, Suratt BT, Boyson JE, Fitzgerald KA, Flavell RA, Eisenbarth SC, Poynter ME. Serum amyloid A activates the NLRP3 inflammasome and promotes Th17 allergic asthma in mice. J Immunol. 2011;187:64–73. doi: 10.4049/jimmunol.1100500. [DOI] [PMC free article] [PubMed] [Google Scholar]
- 30.Vallon R, Freuler F, Desta-Tsedu N, Robeva A, Dawson J, Wenner P, Engelhardt P, Boes L, Schnyder J, Tschopp C, Urfer R, Baumann G. Serum amyloid A (apoSAA) expression is up-regulated in rheumatoid arthritis and induces transcription of matrix metalloproteinases. J Immunol. 2001;166:2801–2807. doi: 10.4049/jimmunol.166.4.2801. [DOI] [PubMed] [Google Scholar]
- 31.Christenson K, Bjorkman L, Ahlin S, Olsson M, Sjoholm K, Karlsson A, Bylund J. Endogenous Acute Phase Serum Amyloid A Lacks Pro-Inflammatory Activity, Contrasting the Two Recombinant Variants That Activate Human Neutrophils through Different Receptors. Front Immunol. 2013;4:92. doi: 10.3389/fimmu.2013.00092. [DOI] [PMC free article] [PubMed] [Google Scholar]
- 32.Kim MH, de Beer MC, Wroblewski JM, Webb NR, de Beer FC. SAA does not induce cytokine production in physiological conditions. Cytokine. 2013;61:506–512. doi: 10.1016/j.cyto.2012.10.019. [DOI] [PMC free article] [PubMed] [Google Scholar]
- 33.Chen K, Le Y, Liu Y, Gong W, Ying G, Huang J, Yoshimura T, Tessarollo L, Wang JM. A critical role for the g protein-coupled receptor mFPR2 in airway inflammation and immune responses. J Immunol. 2010;184:3331–3335. doi: 10.4049/jimmunol.0903022. [DOI] [PMC free article] [PubMed] [Google Scholar]
- 34.Zhang X, Goncalves R, Mosser DM. The isolation and characterization of murine macrophages. Curr Protoc Immunol. 2008;Chapter 14(Unit 14):11. doi: 10.1002/0471142735.im1401s83. [DOI] [PMC free article] [PubMed] [Google Scholar]
- 35.Romero MJ, Platt DH, Tawfik HE, Labazi M, El-Remessy AB, Bartoli M, Caldwell RB, Caldwell RW. Diabetes-induced coronary vascular dysfunction involves increased arginase activity. Circ Res. 2008;102:95–102. doi: 10.1161/CIRCRESAHA.107.155028. [DOI] [PMC free article] [PubMed] [Google Scholar]
- 36.Glogauer M, Marchal CC, Zhu F, Worku A, Clausen BE, Foerster I, Marks P, Downey GP, Dinauer M, Kwiatkowski DJ. Rac1 deletion in mouse neutrophils has selective effects on neutrophil functions. J Immunol. 2003;170:5652–5657. doi: 10.4049/jimmunol.170.11.5652. [DOI] [PubMed] [Google Scholar]
- 37.Soehnlein O, Lindbom L. Phagocyte partnership during the onset and resolution of inflammation. Nat Rev Immunol. 2010;10:427–439. doi: 10.1038/nri2779. [DOI] [PubMed] [Google Scholar]
- 38.Leverrier Y, Ridley AJ. Requirement for Rho GTPases and PI 3-kinases during apoptotic cell phagocytosis by macrophages. Curr Biol. 2001;11:195–199. doi: 10.1016/s0960-9822(01)00047-1. [DOI] [PubMed] [Google Scholar]
- 39.Kong L, Sun L, Zhang H, Liu Q, Liu Y, Qin L, Shi G, Hu JH, Xu A, Sun YP, Li D, Shi YF, Zang JW, Zhu J, Chen Z, Wang ZG, Ge BX. An essential role for RIG-I in toll-like receptor-stimulated phagocytosis. Cell Host Microbe. 2009;6:150–161. doi: 10.1016/j.chom.2009.06.008. [DOI] [PubMed] [Google Scholar]
- 40.Satoh T, Takeuchi O, Vandenbon A, Yasuda K, Tanaka Y, Kumagai Y, Miyake T, Matsushita K, Okazaki T, Saitoh T, Honma K, Matsuyama T, Yui K, Tsujimura T, Standley DM, Nakanishi K, Nakai K, Akira S. The Jmjd3-Irf4 axis regulates M2 macrophage polarization and host responses against helminth infection. Nat Immunol. 2010;11:936–944. doi: 10.1038/ni.1920. [DOI] [PubMed] [Google Scholar]
- 41.Su SB, Gong W, Gao JL, Shen W, Murphy PM, Oppenheim JJ, Wang JM. A seven-transmembrane, G protein-coupled receptor, FPRL1, mediates the chemotactic activity of serum amyloid A for human phagocytic cells. J Exp Med. 1999;189:395–402. doi: 10.1084/jem.189.2.395. [DOI] [PMC free article] [PubMed] [Google Scholar]
- 42.Sandri S, Rodriguez D, Gomes E, Monteiro HP, Russo M, Campa A. Is serum amyloid A an endogenous TLR4 agonist? J Leukoc Biol. 2008;83:1174–1180. doi: 10.1189/jlb.0407203. [DOI] [PubMed] [Google Scholar]
- 43.Urieli-Shoval S, Linke RP, Matzner Y. Expression and function of serum amyloid A, a major acute-phase protein, in normal and disease states. Curr Opin Hematol. 2000;7:64–69. doi: 10.1097/00062752-200001000-00012. [DOI] [PubMed] [Google Scholar]
- 44.El Kebir D, Jozsef L, Filep JG. Opposing regulation of neutrophil apoptosis through the formyl peptide receptor-like 1/lipoxin A4 receptor: implications for resolution of inflammation. J Leukoc Biol. 2008;84:600–606. doi: 10.1189/jlb.1107765. [DOI] [PubMed] [Google Scholar]
- 45.Yan Q, Sun L, Zhu Z, Wang L, Li S, Ye RD. Jmjd3-mediated epigenetic regulation of inflammatory cytokine gene expression in serum amyloid A-stimulated macrophages. Cell Signal. 2014;26:1783–1791. doi: 10.1016/j.cellsig.2014.03.025. [DOI] [PMC free article] [PubMed] [Google Scholar]
- 46.Bowdridge S, Gause WC. Regulation of alternative macrophage activation by chromatin remodeling. Nat Immunol. 2010;11:879–881. doi: 10.1038/ni1010-879. [DOI] [PubMed] [Google Scholar]
- 47.De Santo C, Arscott R, Booth S, Karydis I, Jones M, Asher R, Salio M, Middleton M, Cerundolo V. Invariant NKT cells modulate the suppressive activity of IL-10-secreting neutrophils differentiated with serum amyloid A. Nat Immunol. 2010;11:1039–1046. doi: 10.1038/ni.1942. [DOI] [PMC free article] [PubMed] [Google Scholar]
- 48.Negishi H, Ohba Y, Yanai H, Takaoka A, Honma K, Yui K, Matsuyama T, Taniguchi T, Honda K. Negative regulation of Toll-like-receptor signaling by IRF-4. Proc Natl Acad Sci U S A. 2005;102:15989–15994. doi: 10.1073/pnas.0508327102. [DOI] [PMC free article] [PubMed] [Google Scholar]
- 49.Uhlar CM, Burgess CJ, Sharp PM, Whitehead AS. Evolution of the serum amyloid A (SAA) protein superfamily. Genomics. 1994;19:228–235. doi: 10.1006/geno.1994.1052. [DOI] [PubMed] [Google Scholar]
- 50.Shah C, Hari-Dass R, Raynes JG. Serum amyloid A is an innate immune opsonin for Gram-negative bacteria. Blood. 2006;108:1751–1757. doi: 10.1182/blood-2005-11-011932. [DOI] [PubMed] [Google Scholar]
Associated Data
This section collects any data citations, data availability statements, or supplementary materials included in this article.