Abstract
DUSP3 is a small dual-specificity protein phosphatase with an unknown physiological function. We report that DUSP3 is strongly expressed in human and mouse monocytes and macrophages and that its deficiency in mice promotes tolerance to lipopolysaccharide (LPS)-induced endotoxin shock and to polymicrobial septic shock following cecal ligation and puncture. By using adoptive transfer experiments, we demonstrate that resistance to endotoxin is macrophage-dependent and transferable and that this protection is associated with a striking increase of M2-like macrophages in DUSP3−/− mice in both the LPS and cecal ligation and puncture models. We show that the altered response of DUSP3−/− mice to sepsis is reflected in decreased TNF production and impaired ERK1/2 activation. Our results demonstrate that DUSP3 plays a key and non-redundant role as a regulator of innate immune responses by mechanisms involving the control of ERK1/2 activation, TNF secretion and macrophage polarization.
Introduction
Sepsis and septic shock are complex clinical syndromes that cover a spectrum of pathophysiological conditions resulting from the response to infection (1). Sepsis develops when the inflammatory immune response to infection is uncontrollably amplified (2). The inflammation is usually initiated by recognition of bacterial components such as bacterial lipopolysaccharide (LPS). This leads to the activation of TLR4 signaling cascades and results in excessive release of cytokines, chemokines and nitric oxide (NO), which can initiate widespread tissue injury leading to organ dysfunction and eventually to death (3).
NF-κB and the MAPKs signaling pathways are the major pathways activated after TLR4 stimulation (4). This leads to the expression of target genes encoding various inflammatory cytokines, such as TNF and IL-6 (4, 5). MAPKs activation is regulated by phosphorylation by MAPKinase kinase kinases (MAPKKKs) (6). To terminate MAPKs-induced signaling, MAPKs are inactivated by different protein phosphatases, including the dual-specificity protein phosphatases (DSPs). The human genome contains 30 protein-encoding DSP/DUSP genes. Eleven of these DSPs, called MAPK phosphatases (MKPs), contain a MAPK binding domain (MKB). The other nineteen are atypical DSPs (A-DSPs) that do not contain this domain (7, 8). MAPKs are mainly regulated by MKPs. Analysis of mice lacking a specific MKP-coding gene has shown that MKPs are not functionally redundant and that they have important effects on immune responses (9–11). In contrast to the MKPs, the physiological functions of A-DSPs are largely unknown.
DUSP3, also called Vaccinia-H1 Related phosphatase (VHR), is a 21-kDa atypical DSP encoded by DUSP3 in humans (Dusp3 in mice). DUSP3 has been reported to dephosphorylate the MAPKs ERK and JNK, but not p38 (12–14). We previously reported that, unlike MKPs, DUSP3 expression is not induced in response to MAPKs activation but is regulated during cell cycle progression (15, 16). We, and others, have also reported that DUSP3 expression levels are altered in several human cancers (17–19). We recently generated DUSP3-knockout (DUSP3−/−) mice, and found that they were healthy, fertile and showed no spontaneous phenotypic abnormality. However, DUSP3 deficiency prevents neo-angiogenesis and b-FGF-induced microvessel outgrowth (20). In the present study using DUSP3−/− mice, we identified DUSP3 as a key and non-redundant regulator of the innate immune response to lethal inflammatory shock induced by endotoxin or polymicrobial infection, and showed that it acts by a mechanism involving M2-like macrophages. Moreover, we report that DUSP3 is required for the production of TNF and, therefore, contributes to inflammatory responses.
Materials and Methods
Human RNA sampling
RNA was prepared from sorted human blood cells obtained from 256 healthy volunteers. Donors were informed about the objectives of the study and signed an informed consent. The ethical committee review board of the University Hospital of Liège approved the study. Venous blood (5 mL) was collected on EDTA. CD19+ B lymphocytes, CD4+ and CD8+ T lymphocytes, CD14+ monocytes, and CD15+ granulocytes were positively selected from PBMC using MACS separation columns (MiltenyiBiotec). Total RNA was extracted from freshly purified cell populations using AllPrep DNA/RNA Micro Kit (Qiagen) and stored at −80°C until use. RNA was quantified by absorbance measurement, and 200 ng of RNA were used in reverse transcription with oligo-dT primers (Superscript III RT, Invitrogen), prior to biotin labeling and amplification using the TargetAmp Nano-g Biotin-aRNA Labeling Kit for the Illumina System (Epicentre). Biotin-labeled aRNA were purified using the RNeasy MinElute Cleanup Kit (Qiagen) and 400 ng were hybridized on Human HT-12 v4 arrays (Illumina) following the recommendations of the manufacturer. Arrays were scanned on an iScan microarray scanner (Illumina). Internal quality controls of the arrays were analyzed. Cell-specific expression markers were analyzed in all samples in order to identify potential sample inversion or contamination. The raw fluorescence intensities for the probes corresponding to DSPs have been corrected for the fluorescence background signal for each sample on the array by subtracting the fluorescence intensity of the negative control probes on the array. The data have then been normalized by dividing the intensity for each probe in each sample by the mean fluorescence intensity of 7 housekeeping genes (EEF1A1, UBC, ACTB, RPS9, GAPDH, TUBB2A and TXN) in the same sample.
Mice
DUSP3−/− mice were generated as previously reported (20). These mice were backcrossed with C57BL/6 mice (Charles River) for 11 generations under specific pathogen-free (SPF) conditions at the animal facility of Liège University. Heterozygotes breeding pairs were used to generate homozygote DUSP3−/− and paired DUSP3+/+ littermate controls colonies used in the experiments. Mice were genotyped using DNA extracted from tail samples as previously described (20). Age matched DUSP3+/+ and DUSP3−/− female mice were used in all the experiments. C57BL/6-CD45.1 mice (Charles River) were used as recipient mice in the bone marrow and monocyte adoptive transfer experiments. Mice were kept in a specific-pathogen free animal facility and received food and water ad libitum.
All mouse experiments and procedures were approved by the animal ethics committees of the Universities of Ghent and Liège and were carried out according to their guidelines.
Antibodies and reagents
The following materials were from BD Biosciences: purified anti-CD16/CD32 (FcγIII/II receptor) (2.4G2), PerCP-Cy5.5-anti-CD11b/Mac-1 (M1/70), PE-anti-CD14 (rmC5-3), APC-anti-F4/80 (BM8), V450-anti-CD45.1 (A20), PE-Cy7-anti-CD45.2 (104), APC-Cy7-anti-Ly6G (1A8), V500-anti-I-A/I-E (MHCII) (M5/114.15.2) and APC-anti-CD11c (HL3). PE-anti-TLR4/MD2 (MTS510) was from eBiosciences. FITC-anti-Ly6B (7/4), Alexa 647-antiLy6B (7/4) and Alexa 488-anti-Ly6G (ER-MP20) were from AbD Serotec. Anti-VHR (DUSP3) antibody (used for human samples #4752), anti-phospho-ERK1/2 (Thr202/Tyr204), anti-ERK1/2, anti-phospho-p38 (Thr180/Tyr182), anti-p38, anti-phospho-MEK1/2 (Ser217/221) (42G9), anti-MEK1/2 and anti-Iκβα were from Cell Signaling (Cell Signaling). Anti-VHR (DUSP3) antibody used for mouse samples was from Santa Cruz (sc8889, Santa Cruz). Anti- GAPDH antibody was from Sigma (Sigma). HRP-conjugated anti-goat, anti-mouse and anti-rabbit antibodies, used as secondary antibodies, were from Amersham Biosciences (Amersham Biosciences, Glattbrugg, Switzerland). LPS from Escherichia coli serotype O111:B4 was from Sigma (Sigma) and was diluted in pyrogen-free PBS.
Cecal ligation and puncture (CLP) and in vivo challenge with LPS
CLP was performed as previously described (21). For LPS challenge, mice were intraperitoneally (i.p.) injected with LPS (6 mg/kg). Body temperature was monitored using a rectal thermometer at various times after LPS injection and after CLP. Death of mice was recorded and the data were analyzed for statistical significance of differences between groups.
Mice irradiation, bone marrow (BM) transplantation and monocyte transfer
Donor mice 7−8 weeks old were killed by cervical dislocation. Tibia and fibula were collected and BMs were flushed with PBS. BM cells (10 × 106) were immediately transplanted to recipient mice aged 7−8 weeks that had been lethally irradiated (866.3 cGy). After 3−4 weeks, transplantation efficiency was evaluated on the basis of the ratio of CD45.2 (donor) to CD45.1 (recipient) cells in the blood of transplanted mice.
For monocyte transplantation, monocytes were negatively selected from BM cell suspensions using an EasySep monocyte selection kit following the instructions of the manufacturer (StemCell). Monocytes (1.5 × 10⁶) were injected i.v. into mice 24 h before LPS injection. Survival and body temperature were monitored for 5 days. Percentage and phenotype of transferred monocytes were evaluated by flow cytometry on peritoneal lavages of recipient mice using anti-CD45.1, anti-CD45.2, anti-CD11b, anti-F4/80 and anti-Ly6B antibodies.
Isolation of peritoneal macrophages
Resident PMs were selected by adherence to tissue culture plastic dishes in culture conditions at a cell density of 1 × 10⁶ cells /mL in complete RPMI-1640 medium. After 2 h, cells were gently rinsed twice with FBS/RPMI and used for experiments.
Animal blood sampling and plasma preparation
Peripheral blood was drawn in EDTA-coated tubes (BD Microtainer K2E tubes, BD Biosciences) by puncturing the sub-mandibular vein of the mouse with a sterile Golden rod animal lancet with a point length of 5 mm (Bioseb). Centrifugation was performed at 2000 rpm for 15 min at room temperature. Plasma samples were separated in sterile eppendorf tubes, aliquoted in small volumes and stored at −80°C until used.
Nitric oxide (NO) and urea levels
NO and urea levels were measured in plasma samples using Nitrate/Nitrite Fluorimetric Assay Kit (Cayman) and QuantiChrom™ Urea Assay Kit (DIUR-500) (BioAssay Systems) according to the manufacturers’ protocols.
Cytokine Beads Array (CBA)
Levels of TNF and IL-6 in mouse plasma samples, peritoneal lavages and supernatants of cultured macrophages were measured using a BD Biosciences CBA mouse inflammation kit according to the manufacturer’s protocol. Data were acquired using FACS CantoII and results were analyzed using FCAP Array software (BD biosciences).
Bacterial load in peritoneal cavity and blood
Mice were killed at various times after CLP, and peritoneal lavage was collected, diluted and plated on brain heart infusion agar plates (BD Biosciences). Blood from the same animals was diluted in PBS at 1:2 before plating. Plates were incubated at 37°C overnight and colonies were counted.
Flow cytometry and phenotyping
For surface cell staining, 2−5 × 10⁵ cells were incubated for 15−20 min with anti-CD16/CD32 (FcγIII/II receptor) before labeling for 30 min with specific antibodies. All staining was done on ice in PBS supplemented with 1% BSA followed by one washing in cold PBS. Cells were next analyzed on FACS Canto II (Becton Dickson) using FlowJo (Tree star Inc.).
Protein extraction, western blot analysis and JNK kinase assay
Protein extraction, western blot analysis and JNK kinase assay were performed as previously reported (20)
RNA purification, reverse transcription and real-time PCR
RNA was extracted from peritoneal macrophages using a Roche kit (Roche) according to the manufacturer’s instructions. cDNA was synthesized using Expand reverse transcriptase according to the recommendations of the manufacturer. cDNA was amplified using Sybr Green PCR Master Mix (Roche) and 0.3 µM of specific primers for TNF-α, IL-6 and β2-microglobulin (β2M). All quantitative PCR were performed on a LightCycler® System for Real-Time PCR (Roche). The ratio between the expression level of the gene of interest and β2M in the sample was defined as the normalization factor. Relative mRNA quantities for TNF-α and IL-6 were determined by dividing the values interpolated from the standard curve by the normalization factor.
The sequences of the primers (Eurogentec; Seraing, Belgium) are as follow:
TNF: FW: CCAGTGTGGGAAGCTGTCTT RV: AAGCAAAAGAGGAGGCAACA
IL-6: FW: ATGGATGCTACCAAACTGGAT RV: TGAAGGACTCTGGCTTTGTCT
iNOS: FW: GCTTCTGGTCGATGTCATGAG RV: TCCACCAGGAGATGTTGAAC
Arg1: FW: CAGAAGAATGGAAGAGTCAG RV: CAGATATGCAGGGAGTCACC
Ym1: FW: GGGCATACCTTTATCCTGAG RV: CCACTGAAGTCATCCATGTC
β2M: FW: CACCCCACTGAGACTGATACA RV: TGATGCTTGATCACATGTCTCG
Microarray analysis and gene expression profiles
Total RNA was isolated using high pure RNA isolation kit (Roche). The yield of the extracted RNA was determined spectrophotometrically by measuring the optical density at 260nm. The purity and quality of extracted RNA were evaluated using the Experion RNA StdSens Analysis kit (Bio-Rad Laboratories). High quality RNA with RNA Quality Indicator (RQI) score greater than 8 was used for microarray experiments. Gene expression profiling was performed using Illumina’s multi-sample format Mouse WG-6 V2 BeadChip that contains 45,281 transcripts and profiles six samples simultaneously on a single chip (Illumina Inc.). Raw microarray intensity data were analyzed with the Genome Studio software normalized using the quantile normalization method according to the manufacturer’s recommendation. Differential analysis were performed for each group and the data were filtered on differential score higher than 30 or lower than −30 which equivalent to a p value lower than 0.001. The probes were considered as expressed by filtering data on detection p-value lower than 0.01. Results of the microarray analysis are accessible on NCBI GEO (GEO accession number: GSE66782. URL website: http://www.ncbi.nlm.nih.gov/geo/query/acc.cgi?acc=GSE66782)
Statistical analysis
Cytokine production, and NO and urea levels were compared between DUSP3+/+ and DUSP3−/− cells using one-way analysis of variance (ANOVA). Differences in survival were determined by Kaplan-Meier analysis. All tests were performed using GraphPad-Prism software (GraphPad Software, Inc.). A p-value <0.05 was considered significant.
Results
DUSP3 is strongly expressed in monocytes and macrophages
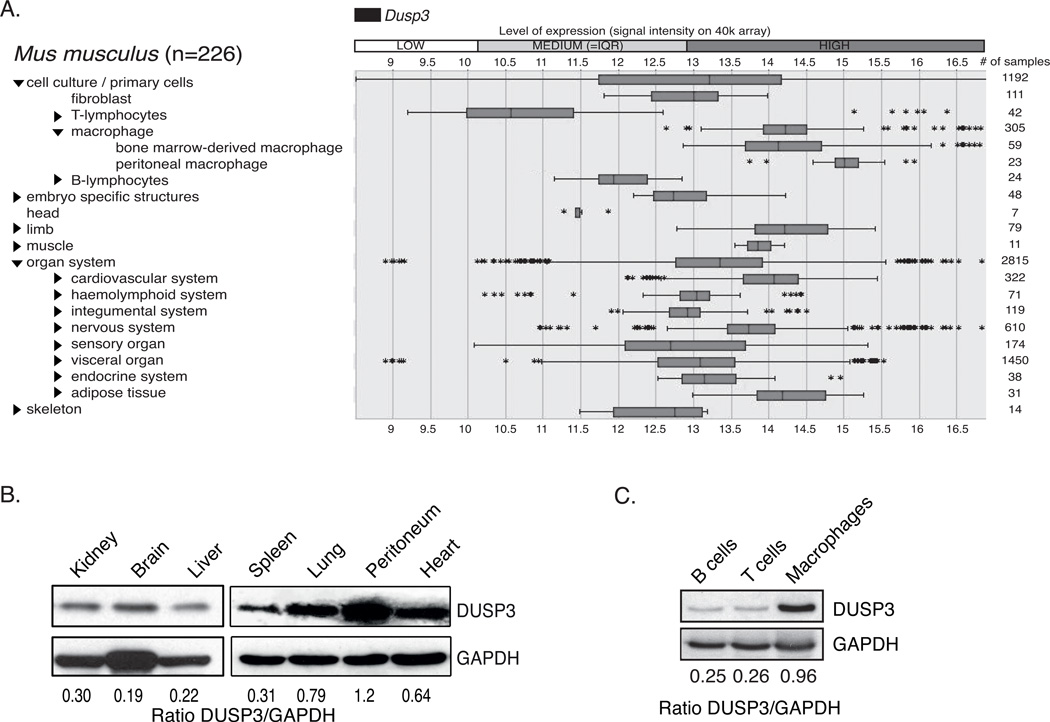
A previous study analyzing the gene expression profile of protein phosphatases in different murine immune cell types showed that Dusp3 is the most strongly expressed atypical DSP-encoding gene in macrophages (22). We performed an analysis on the Genevestigator online platform and found that DUSP3 is expressed at high levels in macrophages (Fig 1A). To confirm this finding, we quantified DUSP3 expression by western blot in lysates from different mouse organs. Cells harvested from the peritoneal cavity had a higher expression level of this phosphatase than the other organs (Fig 1B). Furthermore, we found that peritoneal macrophages (PMs) express higher levels of DUSP3 than sorted T and B cells (Fig 1C).
Figure 1. DUSP3 is strongly expressed in mouse macrophages.
(A) Dusp3 expression levels in different tissues and cell lines, extracted from the Genevestigator database (www.genevestigator.com). (B) Western blot analysis of DUSP3 protein expression in proteins extracts of mouse organs. (C) Western blot analysis of DUSP3 protein expression in sorted B lymphocytes, T lymphocytes and macrophages from mouse peritoneal cavity.
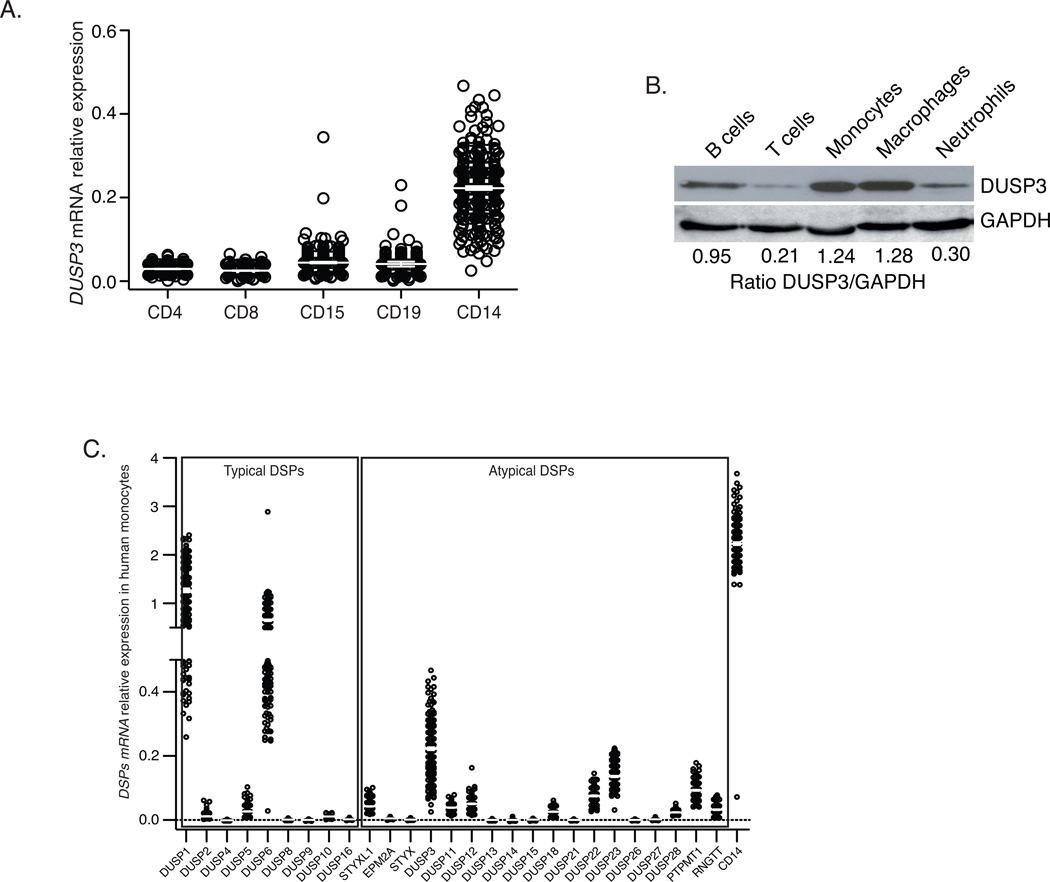
To investigate DUSP3 expression level in human monocytes, we analyzed the gene expression profiles of populations of peripheral blood cells from 256 healthy volunteers. CD14+ monocytes expressed a higher level of DUSP3 mRNA than CD4+ T cells, CD8+ T cells, CD19+ B cells, and CD15+ neutrophils (Fig 2A). We next analyzed the expression levels of all DSPs in human monocytes and found that DUSP3 was strongly expressed A-DSP as was the expression of the typical DSPs DUSP1/MKP1 and DUSP6/MKP3 (Fig 2B). At the protein level, monocytes and monocyte-derived macrophages expressed higher levels of DUSP3 than neutrophils, B cells and T cells (Fig 2C).
Figure 2. DUSP3 is strongly expressed in human monocytes and macrophages.
(A) mRNA relative expression level of DUSP3 gene in sorted human PBMC CD4+T, CD8+T, CD19+B, neutrophils (CD15+) and monocytes (CD14+). (B) Microarray analysis of the expression of genes encoding A-typical and typical DSPs in human CD14+ sorted monocytes. CD14 was used as positive control for monocytes expressed mRNA. Data are presented as ratio of the fluorescence intensity for the DSP probe of interest and the mean fluorescence intensity for the housekeeping genes of each sample. A negative value corresponds to an expression bellow background level. Results are presented as mean ± SEM. (C) Western blot analysis of DUSP3 protein expression in sorted human B and T lymphocytes, neutrophils, monocytes and in monocytes-derived-macrophages isolated from peripheral blood of healthy donors. GAPDH expression is shown as a loading control. Densitometric ratios of DUSP3 to GAPDH are shown for each representative western blot.
DUSP3−/− mice are resistant to inflammatory shock induced by lipopolysaccharide (LPS) or cecal ligation and puncture (CLP)
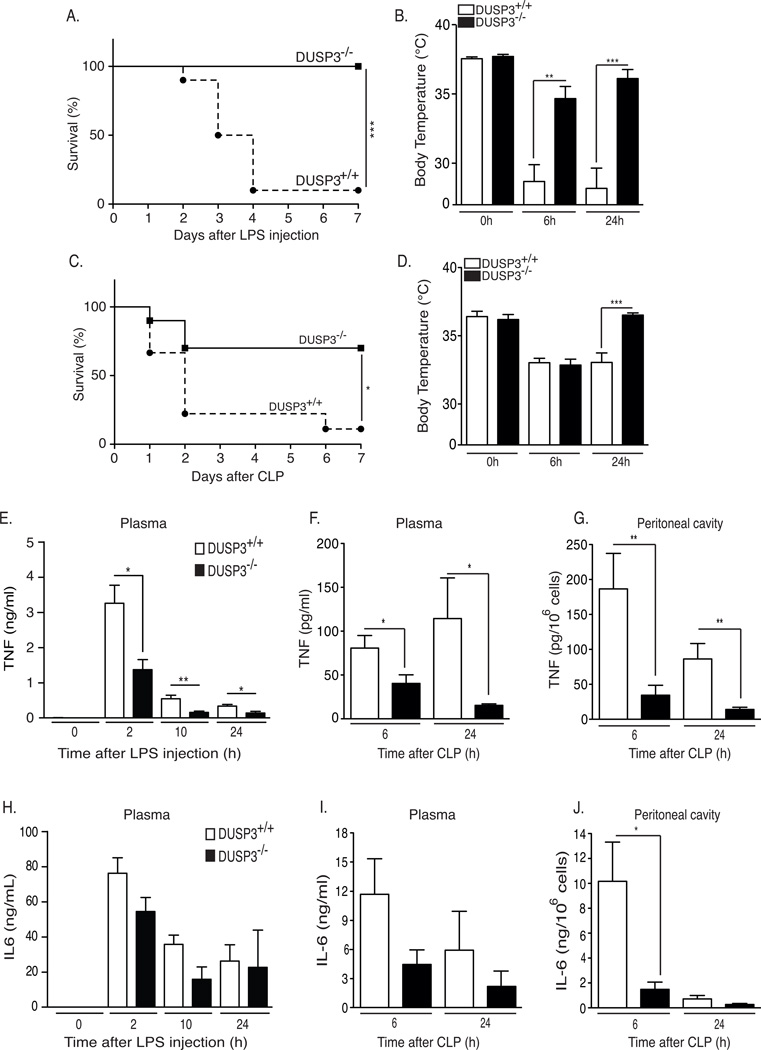
The strong expression of DUSP3 in monocytes and macrophages suggests that it plays an important role in inflammation and innate immunity. At basal levels, we found that DUSP3 deletion does not significantly affect hematological parameters such as B and T lymphocytes, neutrophils, monocytes and platelets counts (23). We examined the effect of in vivo LPS challenge in DUSP3−/− mice and their DUSP3+/+ littermates. Mice were intraperitoneally (i.p.) injected with a lethal dose of LPS and survival was monitored for seven days, after which no further deaths occured. DUSP3−/− mice were fully resistant, while DUSP3+/+ littermates were sensitive to LPS-induced endotoxic shock (Fig 3A). Body temperature of DUSP3−/− mice decreased after LPS injection but remained significantly higher than in DUSP3+/+ mice 6 h after LPS injection (Fig 3B). Eighteen hours later, DUSP3−/− mice had recovered while DUSP3+/+ mice remained hypothermic (Fig 3B).
Figure 3. DUSP3−/− mice are resistant to LPS induced-endotoxemia and to CLP-induced septic shock.
(A) DUSP3+/+ (n=17) and DUSP3−/− (n=19) mice were injected i.p. with 6 mg/kg of LPS. Percent survival was documented daily. (B) Body temperature of DUSP3+/+ and DUSP3−/− mice before, 6 h and 24 h after LPS injection. (C) DUSP3+/+ (n=20) and DUSP3−/− (n=20) mice were subjected to CLP (one puncture with 21-gauge needle). Survival was documented daily for 7 days. Mortality incidence rates were compared using Kaplan-Meir with log rank test performed by GraphPrism. (D) Body temperature of DUSP3+/+ and DUSP3−/− mice before, 6h and 24h after CLP. Results presented are a combination of two independent experiments. (E–J) Cytokine beads array (CBA) for IL-6 and TNF on serum samples from DUSP3−/− and DUSP3+/+ mice at basal levels and 2h, 10h and 24h after i.p. injection of 6mg/kg of LPS (E and H); on serum and peritoneal cavity samples from DUSP3−/− and DUSP3+/+ mice at 6h and 24h after CLP (F and I) and on the peritoneal cavity cell-free liquid (G and J). Results are presented as mean ± SEM. n=5 mice per group/time point. *P<0.05, **P<0.01, ***P<0.001.
Since the LPS injection model has a limited value to investigate TLR4-induced inflammatory responses, we used the more relevant polymicrobial sepsis model based on cecal ligation and puncture (CLP) and monitored the body temperature and survival of the mice. All mice received two doses of antibiotics (25 mg/kg ceftrioxane and 15 mg/kg metronidazole) 8 h and 24 h after CLP. DUSP3−/− mice survived significantly better after CLP than DUSP3+/+ mice. Indeed, at the end of the experiment (7 days), 70% of DUSP3−/− mice had survived compared to only 10% of DUSP3+/+ mice (Fig 3C). Both groups of mice were hypothermic 6 h after surgery, but 24 h after CLP, DUSP3−/− mice had recovered while DUSP3+/+ mice had not recovered (Fig 3D).
We next measured the systemic levels of IL-6 and TNF in plasma samples after LPS challenge and CLP. In the latter case, we also measured cytokine production in the peritoneal cavity. TNF production levels were significantly lower in DUSP3−/− mice than in DUSP3+/+ mice at all the time points analyzed, after LPS challenge (Fig 3E) as well as after CLP (Fig 3F-3G). IL-6 production was also significantly lower in the peritoneum of DUSP3−/− mice 6 h after CLP (Fig 3J). Plasma IL-6 levels were also lower in DUSP3−/− mice but the difference was not statistically significant (Fig 3H and 3I).
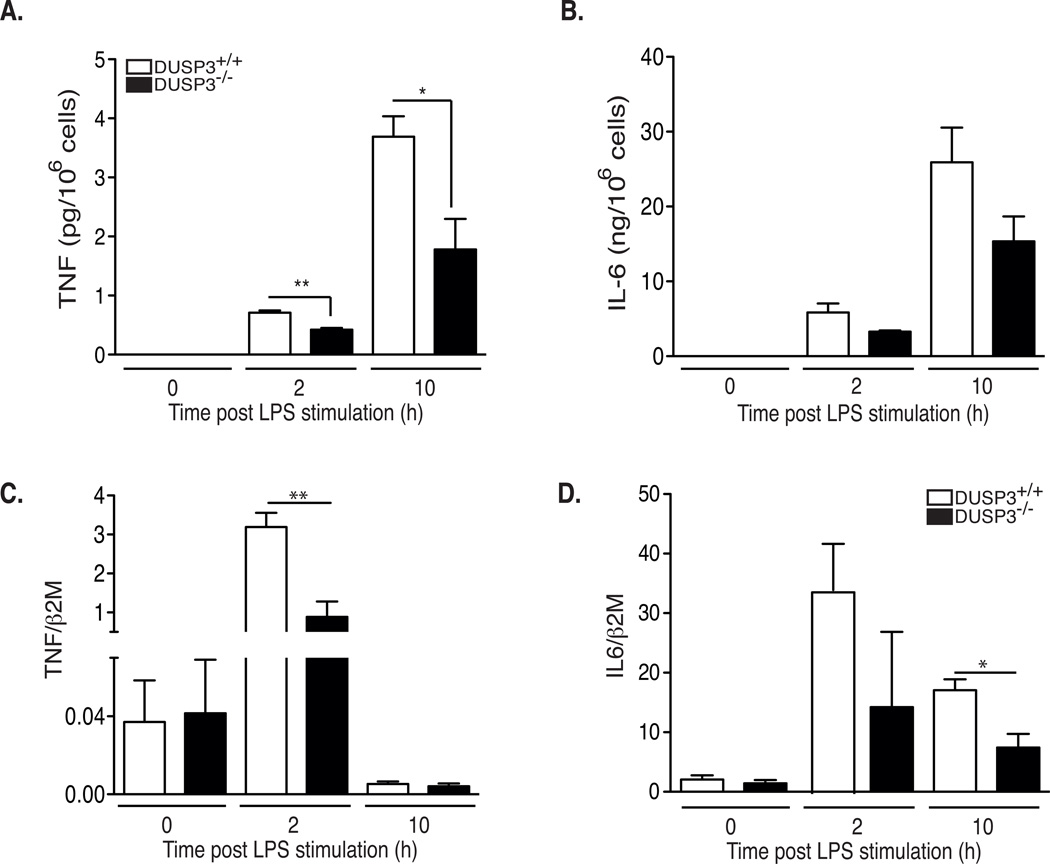
To determine whether the defective TNF production in DUSP3−/− mice after LPS injection or CLP was due to an intrinsic defect in PMs, we collected these cells from mice, activated them ex vivo with LPS (1 µg/mL), and then measured TNF and IL-6 transcripts and proteins. DUSP3-deficient macrophages produced significantly less TNF and IL6 after LPS stimulation (Fig 4A-4B). The lower level of TNF protein was due at least partially to reduced mRNA levels.
Figure 4. DUSP3−/− macrophages produce less TNF than DUSP3+/+ in response to LPS.
(A–B) DUSP3+/+ and DUSP3−/− peritoneal macrophages were activated ex vivo with LPS (1µg/mL). Cells supernatants were collected at 0h, 2h and 10h after activation. TNF (A) and IL6 (B) concentration were determined using CBA. (C–D) IL-6 and TNF relative to β2M mRNA expression levels in peritoneal macrophages of DUSP3+/+ and DUSP3−/− activated ex vivo with LPS (1µg/mL) for 2h and 10h. Results are presented as mean ± SEM. *P<0.05, **P<0.01. Three macrophage pools prepared from three mice each were analyzed separately.
DUSP3−/− mice show signs of tolerance to shock after LPS and CLP
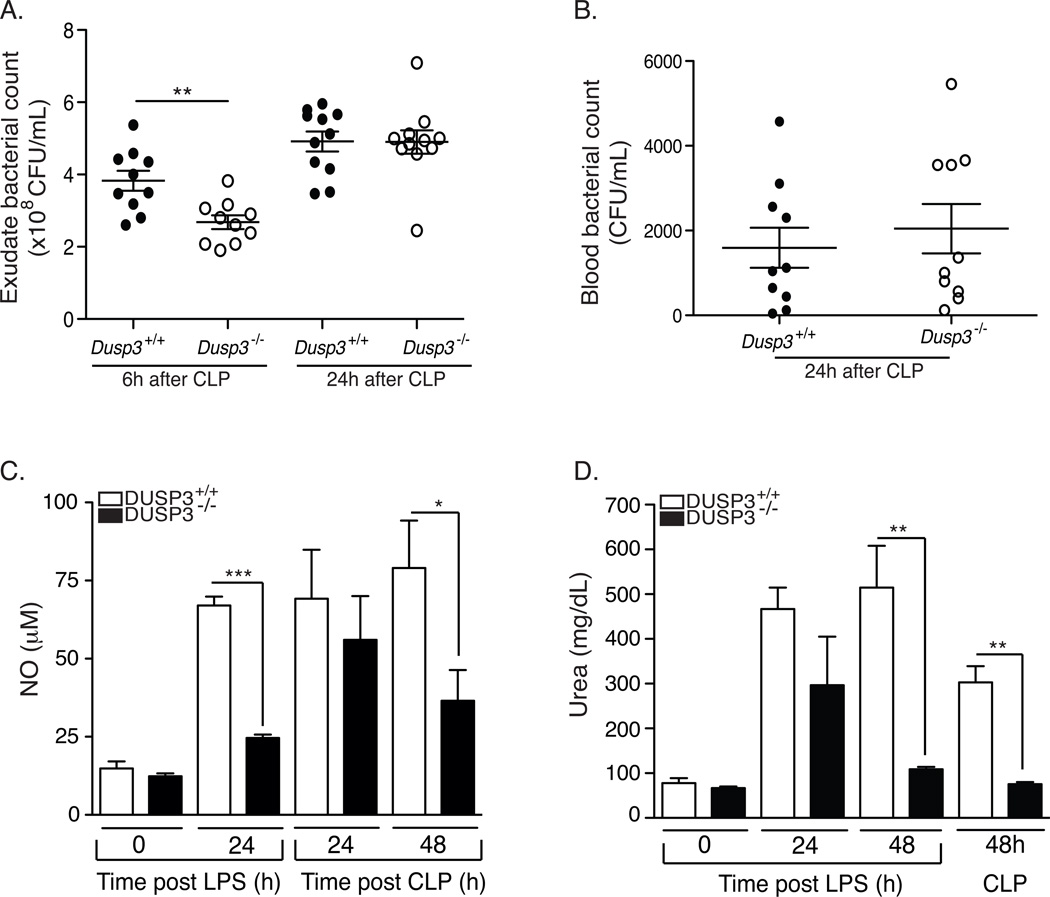
To investigate if the observed resistance of DUSP3−/− mice to CLP-induced septic shock was associated with more efficient bacterial clearance, we compared bacterial counts in DUSP3−/− and DUSP3+/+ mice after CLP. Six hours after surgery, the bacterial count was significantly lower in the peritoneal cavity of DUSP3−/− compared to DUSP3+/+ mice (Fig 5A). However, there was no difference 24 h after CLP. Bacterial counts in peripheral blood were equal in DUSP3−/− and DUSP3+/+ mice 24 h after surgery (Fig 5B). Since DUSP3−/− mice significantly survived CLP, our data suggest that they are tolerant to bacteria. This hypothesis was supported by the reduced systemic TNF and IL-6 production in DUSP3−/− mice after CLP (Fig 3F–G and Fig 3I–J). Furthermore, the concentration of urea and NO, prominent macrophages products generated by arginase and iNOS, respectively and both associated with tissue damage, remained at significantly lower levels in DUSP3−/− mice compared to DUSP3+/+ mice, after CLP or LPS challenge (Fig 5C and 5D).
Figure 5. DUSP3 deficiency promotes tolerance to septic shock.
(A–B) Bacterial colonies count in the peritoneum (A) and in the peripheral blood (B) of DUSP3+/+ and DUSP3−/− mice at the indicated time points after CLP. All mice used for the 24h time point received one dose of antibiotics (25 mg/kg ceftrioxane and 15 mg/kg metronidazole) eight hours after surgery. Each circle represents a single mouse. Open circles represent DUSP3+/+ and dark circles represent DUSP3−/− mice. Horizontal lines represent mean ± SEM. (C–D) Plasma nitrate (C) and Urea (D) levels of DUSP3+/+ and DUSP3−/− mice at basal levels and at the indicated time points after CLP surgery or after LPS i.p administration. (n=5 mice per group/time point). Results are presented as mean ± SEM. * p<0.05, **<0,001***P<0.001.
In DUSP3−/− mice, resistance to LPS and CLP is associated with increased presence of M2-like alternatively activated macrophages
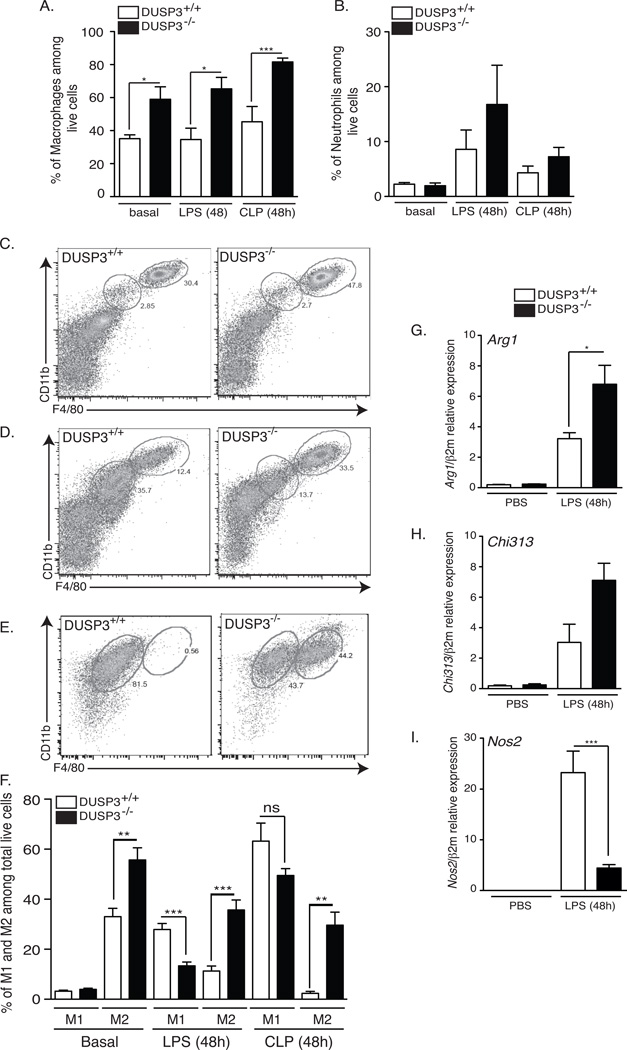
Since macrophages and neutrophils play important roles during microbial infection and in response to endotoxin, we quantified them in the peritoneum of DUSP3+/+ and DUSP3−/− mice in basal conditions and after LPS challenge or CLP. The percentage of total macrophages, out of total live cells, (Ly6G−/CD11b+/F4–80+) was significantly higher in DUSP3−/− than in DUSP3+/+ mice at basal levels (Fig 6A). This difference remained significant after LPS challenge or CLP (Fig 6A). However, the percentages of neutrophils (Fig 6B) and myeloperoxidase (MPO) production by activated neutrophils (data not shown) were similar in the two mouse groups in all the conditions analyzed.
Figure 6. DUSP3 deficiency is associated with a dominance of M2-like over M1-like peritoneal macrophages.
Peritoneal cells harvested from PBS treated, LPS (6mg/kg) or CLP challenged DUSP3−/− (dark bares) and DUSP3+/+ (open bares) mice and analyzed by flow cytometry for CD11b, F4/80 and Ly6G to discriminate between macrophages (Ly6G/CD11b+/F4–80+) and neutrophils (Ly6G+/CD11b+/F4/80−). Percentage of macrophages (A) and neutrophils (B) out of total live cells are presented as histogram of means ± SEM. (C–F) Peritoneal cells from PBS treated, LPS (6mg/kg) or CLP challenged DUSP3−/− and DUSP3+/+ mice analyzed by flow cytometry to discriminate macrophages subtypes. F4/80highCD11bhigh (M2-like) and F4/80intCD11bint (M1-like) were gated out of total live cells extracted from PBS (C), 48h LPS (6mg/kg) challenged (D) or 48h after CLP challenged (E) DUSP3−/− and DUSP3+/+ mice. (F) Quantification of M1-like and M2-like cells extracted from PBS, LPS or CLP challenged mice. n: 6 to 10 mice in each group. PMs were extracted from DUSP3+/+ and DUSP3−/− mice PBS or LPS treated for 48h (6mg/kg). qRT-PCR was performed to quantify the expression of Arg1 (G), Chi313 (H) and Nos2 (I) and The expression of gene of interest was relative to beta macroglobulin (β2M). n=3 mice in each experimental group. Results are presented as a mean ± SEM. *<0.05; **p<0.01; ***p<0.001.
Given the reduced pro-inflammatory response in DUSP3−/− mice and since this feature is characteristic of alternatively activated macrophages (M2/M2-like) (24), we hypothesized that DUSP3 deficiency could be associated with a dominance of M2-like anti-inflammatory macrophages. To investigate this hypothesis, we phenotyped DUSP3−/− and DUSP3+/+ PMs based on the characterization described by Ghosn et al. (25). M1-like macrophages were F4/80intCD11bintLy6G−CD11c−MHCII+CCR2+ while M2-like macrophages were F4/80hiCD11bhiLy6G−CD11c−MHCIIlowCCR2+ (Fig 6C and data not shown).
Under resting conditions, the percentage of M2-like macrophages (out of total macrophages) was significantly higher in the peritoneum of DUSP3−/− (55.68 ± 4.924%) than in DUSP3+/+ mice (32.98 ± 3.31%), while no difference was observed for M1-like macrophages (Fig 6C and 6F). Forty eight hours after LPS injection, DUSP3+/+ mice showed a highly significant increase of M1 macrophages and a significant decrease of M2 macrophages. However, the shift toward M1-like cells was less prominent in DUSP3−/− mice. M2-like macrophages remained the most dominant population in DUSP3−/− mice after LPS administration (Fig 6D and 6E). Furthermore, in CLP-induced septic shock, there was a striking shift to the M1-like phenotype (61.2% ± 7.209) and almost complete absence of M2-like cells (2.378% ± 0.7929) in DUSP3+/+ mice. In contrast, DUSP3−/− PMs were a mixture of both M1-like and M2-like cells, although M1-like macrophages were dominant (Fig 6E and 6F). We also measured the expression of the genes associated with M1-like and M2-like peritoneal macrophages, namely Nos2, Arg1 and Chi313 (Ym1). After LPS challenge, Arg1 (Fig 6G) and Chi313 (Fig 6H) expression was increased in DUSP3−/− mice while Nos2 (Fig 6I) was markedly increased in DUSP3+/+ macrophages.
Monocytes and macrophages confer resistance to LPS-induced shock in DUSP3−/− mice
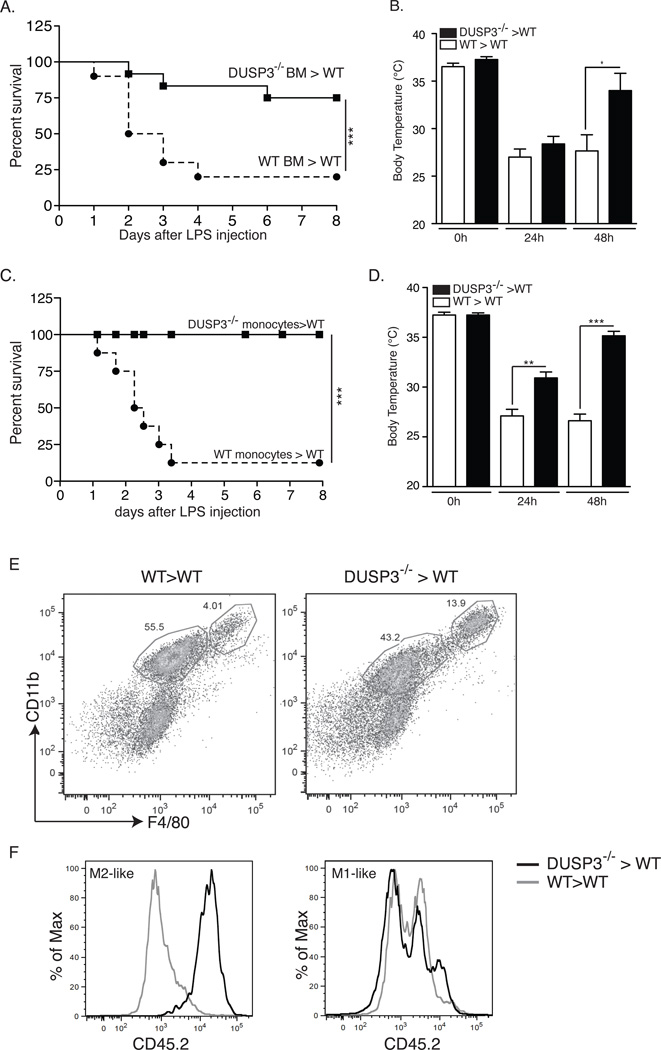
To investigate the role of DUSP3−/− myeloid cells in the observed phenotype, we generated chimeric mice by transplantation of bone marrow (BM) from DUSP3−/−-C57BL/6-CD45.2 mice into lethally irradiated WT-C57BL/6-CD45.1 mice (DUSP3−/−>WT). Successful hematolymphoid reconstitution was verified by flow cytometry three weeks after transplantation (data not shown). The chimeric mice were challenged with LPS. As a control, irradiated WT-C57BL/6-CD45.1 mice were transplanted with DUSP3+/+-C57BL/6-CD45.2 BM cells (WT>WT). Survival after LPS challenge was monitored for seven days. Notably, more than 70% of DUSP3−/−>WT mice survived till the end of the experiment compared to only 9% of DUSP3+/+>WT mice (Fig 7A). Body temperature decreased 24 h after LPS challenge in all mice but then increased significantly to almost normal values in DUSP3−/−>WT mice (Fig 7B). To investigate if monocytes contributed to the resistance to LPS, we transferred DUSP3−/− BM sorted monocytes (1.5 × 10⁶ cells) to WT-(C57BL/6-CD45.1) mice (DUSP3−/−>WT). As a control, DUSP3+/+ BM sorted monocytes were transferred to WT (C57BL/6-CD45.1) mice (WT>WT). After 24 h, recipient mice were i.p. challenged with LPS, and survival and body temperature were monitored. As shown in figure 7C, transfer of DUSP3−/− monocytes to WT mice conferred full resistance to LPS. Variations of body temperatures of mice were compatible with survival outcome (Fig 7D). Interestingly, the resistance of DUSP3−/−>WT mice to LPS was associated with increased presence of donor-derived (CD45.2+) M2-like macrophages (F4/80hiCD11bhi) in the peritoneal cavity of recipient mice (Fig 7E–F). However, M1-like macrophages (F4/80intCD11bint) were a mixture of CD45.1 (recipient) and CD45.2 (donor) (Fig 7E–F).
Figure 7. Adoptive transfer of DUSP3−/− bone marrow or monocytes confers resistance of WT mice to LPS.
(A–B) Percent survival to LPS challenge (A) and body temperature (B) of irradiated WT-CD45.1 mice transplanted with DUSP3−/−-CD45.2 (DUSP3−/−BM>WT) or DUSP3+/+-CD45.2 (WT BM>WT) derived bone marrow (BM) cells. (C–D) Percent survival to LPS challenge (6mg/mL) (C) and body temperature (D) of WT-CD45.1 mice transplanted with monocytes (1.5×10⁶) from DUSP3−/−-CD45.2 (DUSP3−/−>WT) or DUSP3+/+-CD45.2 (WT>WT) mice. Incident of lethality were compared and analyzed using Kaplan-Meir with log rank test performed by graph prism. N=6 mice in each experimental group. (E) Representative FACS dot plots showing the staining for CD11b and F4/80 gated on live singlets peritoneal cavity cells 48 hours after LPS (6mg/kg) challenge of WT>WT and DUSP3−/−>WT. (F) CD45.2 surface expression on gated M1-like and M2-like cells shown in (E). Results are shown as percent of maximum (% of Max) of overlayed histograms of the gated populations shown in (E).
DUSP3 deficiency affects ERK1/2 activation but not JNK, p38 nor NF-κB pathways after TLR4 triggering
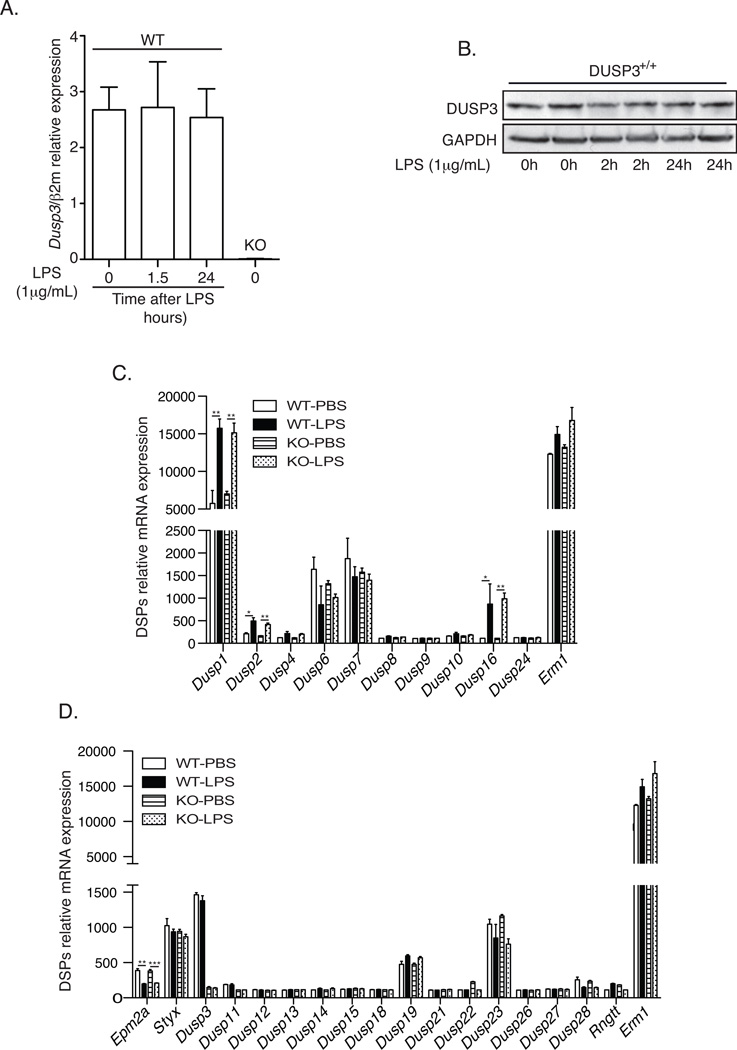
Several DSPs have been reported as early responsive genes induced upon LPS stimulation. The most documented is probably DUSP1/MKP1 (Patterson et al 2009). Therefore, we wanted to investigate if DUSP3 expression is also regulated after TLR4 stimulation. We compared DUSP3 expression at basal levels and at 1.5h and 24h after ex vivo activation of DUSP3+/+ peritoneal macrophages with LPS (1µg/mL). In contrast to other LPS-induced DSPs, DUSP3 expression is not induced after TLR4 activation (Fig 8A and 8B). To investigate if the observed phenotype is due to a simple redundancy of another DSP in the absence of DUSP3 in vivo, we performed a microarray analysis to evaluate the expression levels of all DSPs transcripts in the peritoneal macrophages retrieved form DUSP3−/− and DUSP3+/+ mice 36 hours after LPS or PB injection. We found that Dusp3 deletion does not affect the expression of the other DSPs, both typical and atypical. Furthermore and in DUSP3 expression independent manner, we found that LPS challenge increased significantly the expression of the MKP transcripts Dusp1 (MKP1), Dusp2 (MKP2) and Dusp16 (MKP7) and decreased significantly the expression of the A-DSP transcript Epm2a (Laforin) (Fig 8C and 8D).
Figure 8. DUSP3 deletion does no affect other DSPs expression.
(A–B) PMs isolated from 10–12 weeks old DUSP3+/+ and DUSP3−/− mice were stimulated ex vivo with 1µg/mL of LPS for the indicated time points. (A) qRT-PCR was performed to quantify the expression of Dusp3 gene. The expression was relative to beta macroglobulin (β2M). n=3 mice in each experimental group. (C–D) Total RNA was isolated from peritoneal macrophages of DUSP3+/+ and DUSP3−/− 36 hours after PBS or LPS (6mg/kg) injection. Gene expression profiling was performed using Illumina’s multi-sample format Mouse WG-6 V2 BeadChip. The expression of all typical DSPs (MKPs) (C) and atypical (D) are shown. Erm1 (F4/80) was used as positive control for macrophages expressed mRNA. Data are presented as mean ± SEM of the fluorescence intensity for the DSP probe of interest. N= 3 mice in each group. *, p<0,05, **, p<0,01, ***, p<0,001 determined using unpaired t-test.
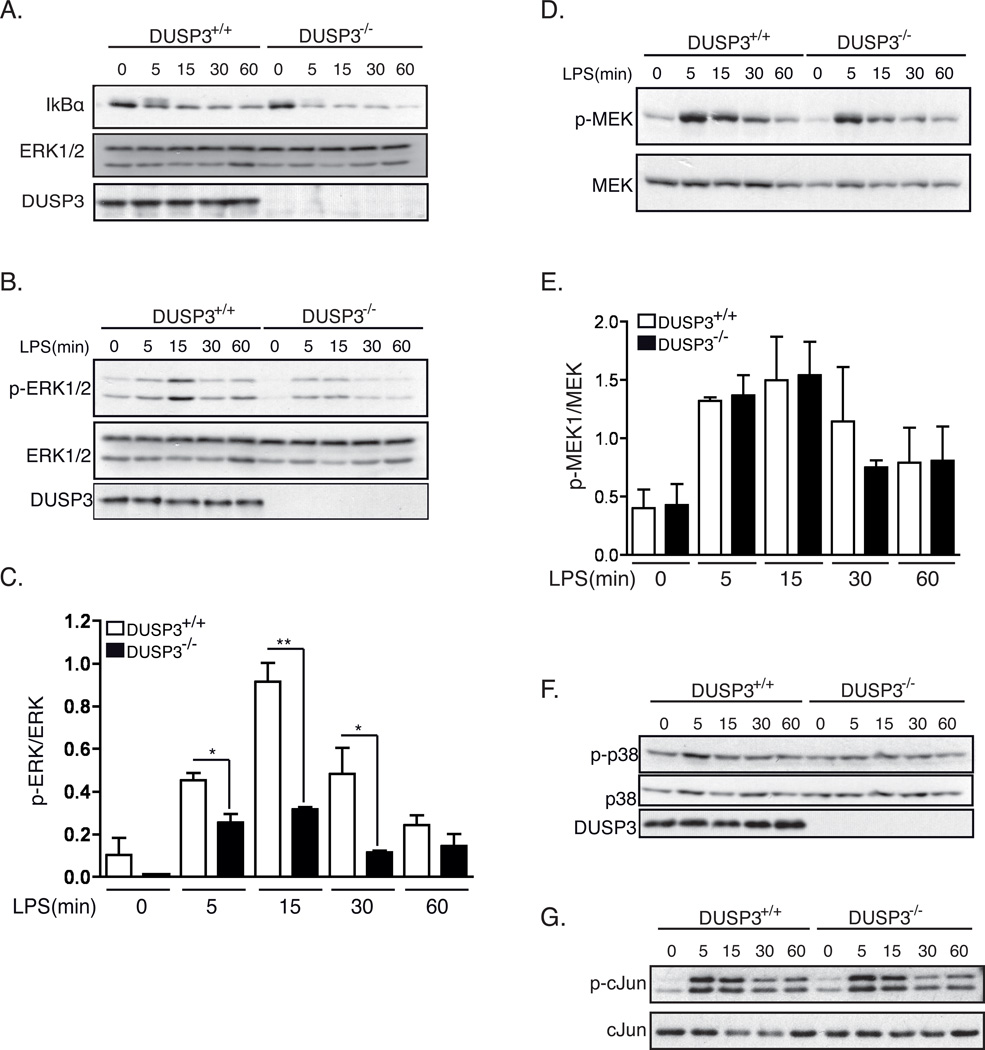
One of the major inflammatory signaling pathways activated after TLR4 triggering is the NF-κB pathway (5). To investigate if DUSP3 deficiency is associated with a defect in this signaling pathway, we evaluated the expression level of IκBα (which is degraded to allow NF-κB activation) before and at several time points after stimulation of PMs with LPS (1µg/mL). As shown in figure 7A, TLR4 activation induced a rapid IκBα degradation in both DUSP3−/− and DUSP3+/+ mice (Fig 9A). These results suggest that NF-κB activation, in response to LPS, is not affected by DUSP3 deletion.
Figure 9. DUSP3 deficiency affects ERK1/2 phosphorylation but not JNK, p38 nor NF-κB pathways after TLR4 triggering.
PMs isolated from 10–12 weeks old DUSP3+/+ and DUSP3−/− mice were stimulated ex vivo with 1µg/mL of LPS for the indicated time points. Equal amount of proteins were loaded on SDS-PAGE and western blots were performed using (A) anti-IκB antibody and anti-ERK1/2 as a loading control; (B) anti-phospho-ERK1/2 (Thr202/Tyr204) and anti-ERK1/2 as a loading control; (D) anti-phospho-MEK1/2 (Ser217/221) and anti-MEK1/2; anti-phospho-p38 (Thr180/Tyr182) and (F) anti-p38. (C and E) Densitometry quantification of p-ERK1/2/ERK1/2 (B) and p-MEK/MEK (D) were performed using Imaje J software. Results are presented as a ratio of p-ERK/ERK and p-MEK/MEK from 3 independent experiments. Data are shown as mean ± SEM. *, p<0,05, **, p<0,01 determined using unpaired t-test. (G) JNK activity assay. Phospho-SAPK/JNK (Thr183/Tyr185) was immunoprecipitated from non-activated and LPS activated PMs lysates. Recombinant c-Jun was used as a substrate for the kinase assay. JNK activity was revealed using anti-phospho-c-Jun (Ser63). Representative JNK assay is shown.
Earlier studies indicated that DUSP3 dephosphorylates ERK1/2 and JNK2 but not p38 (16). In addition, TLR4 activation leads to the activation of MAPKs signaling pathways (26, 27). Therefore, we investigated if the activation of these MAPKs was affected by DUSP3 deficiency in PMs. We probed ERK1/2 with phospho-specific antibodies at basal levels and after stimulation of DUSP3+/+ and DUSP3−/− PMs with 1 µg/mL LPS. Surprisingly, and in contradiction to all in vitro studies published so far, DUSP3-deficiency in vivo was not associated with increased ERK1/2 phosphorylation. Indeed, the basal phosphorylation level of ERK1/2 in the DUSP3−/− PMs was lower than in DUSP3+/+ PMs. After LPS treatment, ERK1/2 phosphorylation increased slightly in DUSP3−/− PMs but remained significantly lower than in DUSP3+/+ PMs (Fig 9B–C). We next checked for the activation of the ERK1/2 upstream MAPK, MAPKK1/2 or MEK1/2 phosphorylation status (28). Western blot analysis using anti-phospho-MEK1/2 antibody showed that MEK1/2 activation was not altered in DUSP3-deficient PMs either at the basal level or after ex vivo LPS activation (Figure 9D–E). DUSP3 deficiency did not affect p38 and JNK1/2 activation either (Fig 9F–G).
Discussion
We report that DUSP3 is strongly expressed in monocytes and macrophages and plays a critical role as a positive regulator of the innate immune response. We show that genetic deletion of DUSP3 confers strong protection against endotoxin shock and polymicrobial septic shock. This protection is associated with decreased systemic production of the pro-inflammatory cytokine TNF and dominance of M2-like macrophages. Interestingly, transfer of DUSP3−/− BM or monocytes to WT mice appears sufficient to transfer LPS resistance to the recipients. In the recipient mice, inflammatory responses associated with DUSP3 knockout are dominant over the WT response, as demonstrated by the dominance of CD45.2-DUSP3−/− M2-like macrophages over the recipient CD45.1-WT macrophages.
These findings suggest that the anti-inflammatory responses observed in DUSP3-deficient mice are, at least partially, due to suppression of cytokine production by macrophages and demonstrate an essential role for DUSP3 in regulating macrophage polarization and inflammation.
The bacterial load in the blood of DUSP3-deficient mice subjected to CLP did not differ from that in WT mice, yet DUSP3−/− mice resisted CLP, suggesting that DUSP3 deficiency confers disease tolerance without affecting the pathogen load. We also found that DUSP3 deficiency protected mice from lethal shock in the absence of bacteria, i.e. when LPS challenge was used. In both cases (LPS and CLP), survival of the DUSP3−/− mice was associated with a lower level of systemic NO and urea, markers of tissue damage, in addition to a lower level of inflammatory mediators, such as TNF and IL-6, compared to controls. Tolerance to disease as a defense strategy was demonstrated decades ago in plants (29) and more recently in flies and in different mouse models of infection (30), including polymicrobial infection in severe sepsis (31, 32). However, the mechanisms of disease tolerance are poorly understood. In our model, tolerance to LPS and to CLP was associated with dominance of M2-like macrophages in the peritoneal cavity of DUSP3−/− mice. These macrophages were almost absent in DUSP3+/+ mice after LPS or CLP challenge. In addition, we demonstrated that DUSP3-dependent resistance to shock was transferable via monocytes to WT mice and was associated with dominance of M2-like macrophages in the peritoneal cavity of recipient mice. These data clearly suggest that the tolerance to disease caused by DUSP3 deficiency is mediated by M2-like macrophages. The role of these macrophages in sepsis and septic shock is not well understood. However, it has been reported that tolerance and M2 alternative macrophage polarization are related processes regulated by NF-κB p50 (33), and most probably also by other unknown molecular mechanisms. In addition, a mixed M1/M2 population has been observed in baboons surviving experimental peritonitis, whereas baboons that died had an exclusive M1 signature (34).
In contrast to DUSP1, DUSP3 expression is not regulated after TLR4 triggering. On the other hand, DUSP3 deletion does not affect the expression of any other member of DSPs group excluding a redundancy effect of another DSP is the observed phenotype.
DUSP3 depletion does not affect TLR4/CD14 expression (data not shown) and IκB degradation and so it does not affect NF-κB signaling either. This indicates that TLR4 signaling molecules such as MyD88, IRAK1–4, TRAF6 and TAK1 are not altered by DUSP3 deficiency because IκB degradation requires their activation after TLR4 stimulation (4).
In contradiction to previous findings (12–15), DUSP3 deletion was associated with decreased activity of ERK1/2 in peritoneal macrophages, while JNK1/2 and p38 activities were not affected. This was observed only in macrophages. Indeed, ERK1/2 and JNK1/2 activation in B cells, T cells and platelets in response to BCR, TCR and GPVI ligands was not affected by DUSP3 deletion (Musumeci et al. under revision). We cannot exclude the possibility that other phosphatases might compensate for the absence of DUSP3 in these cells in vivo.
Several studies, including ours, reported that ERK1/2 and JNK1/2, but not p38, were targeted by DUSP3 in different in vitro cellular models (12–15). However, ours is the first report on the physiological role of DUSP3 in macrophages and the consequences of its deletion on the activation of MAPKs.
The decrease in ERK1/2 activation in DUSP3-deficient macrophages is compatible with the decreased TNF production (transcript and protein) in both CLP and LPS models. Since the NF-κB activation pathway is not affected by DUSP3 deficiency, hypo-phosphorylation of ERK1/2 could explain the low TNF production in these cells. In line with this, a previous report showed that blocking ERK1/2 activation by pharmacological inhibitors was sufficient to substantially reduce TNF secretion (35). In this sense, by indirectly activating ERK1/2, DUSP3 controls the window of synthesis of pro-inflammatory cytokines such as TNF.
In conclusion, our results are the first demonstration that DUSP3 plays a non-redundant role in the innate immune response. DUSP3 controls macrophage polarization by regulating TNF production and ERK activity not only in a sterile inflammation model but also in a polymicrobial model of sepsis. DUSP3 deficiency protected mice from sepsis and septic shock induced by bacterial products by mechanisms involving M2-like macrophages. This finding suggests that regulation of the immune response by DUSP3 is more complex than a simple down-regulation of pro-inflammatory cytokine production.
Acknowledgements
The authors are grateful to the GIGA-animal, GIGA-imaging and GIGA-genotranscriptomics core facilities for excellent technical assistance and support and to Dr Amin Bredan for editing the manuscript.
Grant support: This work was supported by the Fonds Léon Fredericq, the FRS-FNRS, the Fonds Spéciaux Pour la Recherche de l’Université de Liège (to SR), the Fonds Wetenschappelijk Onderzoek (FWO to CL and LD) and Interuniversity Attraction Poles (IUAP to CL) and the National Institutes of Science (grants 5R01AI035603 to TM). PS, MA and MV are FNRS-Télévie PhD fellows.
References
- 1.Lopez-Bojorquez LN, Dehesa AZ, Reyes-Teran G. Molecular mechanisms involved in the pathogenesis of septic shock. Arch Med Res. 2004;35:465–479. doi: 10.1016/j.arcmed.2004.07.006. [DOI] [PubMed] [Google Scholar]
- 2.Cohen J. The immunopathogenesis of sepsis. Nature. 2002;420:885–891. doi: 10.1038/nature01326. [DOI] [PubMed] [Google Scholar]
- 3.Rittirsch D, Flierl MA, Ward PA. Harmful molecular mechanisms in sepsis. Nat Rev Immunol. 2008;8:776–787. doi: 10.1038/nri2402. [DOI] [PMC free article] [PubMed] [Google Scholar]
- 4.Akira S, Takeda K. Toll-like receptor signalling. Nat Rev Immunol. 2004;4:499–511. doi: 10.1038/nri1391. [DOI] [PubMed] [Google Scholar]
- 5.Kawai T, Akira S. The role of pattern-recognition receptors in innate immunity: update on Toll-like receptors. Nat Immunol. 2010;11:373–384. doi: 10.1038/ni.1863. [DOI] [PubMed] [Google Scholar]
- 6.Kyriakis JM, Avruch J. Mammalian MAPK signal transduction pathways activated by stress and inflammation: a 10-year update. Physiol Rev. 2012;92:689–737. doi: 10.1152/physrev.00028.2011. [DOI] [PubMed] [Google Scholar]
- 7.Alonso A, Sasin J, Bottini N, Friedberg I, Osterman A, Godzik A, Hunter T, Dixon J, Mustelin T. Protein tyrosine phosphatases in the human genome. Cell. 2004;117:699–711. doi: 10.1016/j.cell.2004.05.018. [DOI] [PubMed] [Google Scholar]
- 8.Tautz L, Critton DA, Grotegut S. Protein tyrosine phosphatases: structure, function, and implication in human disease. Methods Mol Biol. 2013;1053:179–221. doi: 10.1007/978-1-62703-562-0_13. [DOI] [PMC free article] [PubMed] [Google Scholar]
- 9.Liu Y, Shepherd EG, Nelin LD. MAPK phosphatases--regulating the immune response. Nature reviews. Immunology. 2007;7:202–212. doi: 10.1038/nri2035. [DOI] [PubMed] [Google Scholar]
- 10.Jeffrey KL, Camps M, Rommel C, Mackay CR. Targeting dual-specificity phosphatases: manipulating MAP kinase signalling and immune responses. Nat Rev Drug Discov. 2007;6:391–403. doi: 10.1038/nrd2289. [DOI] [PubMed] [Google Scholar]
- 11.Salojin K, Oravecz T. Regulation of innate immunity by MAPK dual-specificity phosphatases: knockout models reveal new tricks of old genes. Journal of leukocyte biology. 2007;81:860–869. doi: 10.1189/jlb.1006639. [DOI] [PubMed] [Google Scholar]
- 12.Ishibashi T, Bottaro DP, Chan A, Miki T, Aaronson SA. Expression cloning of a human dual-specificity phosphatase. Proc Natl Acad Sci U S A. 1992;89:12170–12174. doi: 10.1073/pnas.89.24.12170. [DOI] [PMC free article] [PubMed] [Google Scholar]
- 13.Yuvaniyama J, Denu JM, Dixon JE, Saper MA. Crystal structure of the dual specificity protein phosphatase VHR. Science. 1996;272:1328–1331. doi: 10.1126/science.272.5266.1328. [DOI] [PubMed] [Google Scholar]
- 14.Alonso A, Saxena M, Williams S, Mustelin T. Inhibitory role for dual specificity phosphatase VHR in T cell antigen receptor and CD28-induced Erk and Jnk activation. J Biol Chem. 2001;276:4766–4771. doi: 10.1074/jbc.M006497200. [DOI] [PubMed] [Google Scholar]
- 15.Rahmouni S, Cerignoli F, Alonso A, Tsutji T, Henkens R, Zhu C, Louis-dit-Sully C, Moutschen M, Jiang W, Mustelin T. Loss of the VHR dual-specific phosphatase causes cell-cycle arrest and senescence. Nat Cell Biol. 2006;8:524–531. doi: 10.1038/ncb1398. [DOI] [PubMed] [Google Scholar]
- 16.Cerignoli F, Rahmouni S, Ronai Z, Mustelin T. Regulation of MAP kinases by the VHR dual-specific phosphatase: implications for cell growth and differentiation. Cell Cycle. 2006;5:2210–2215. doi: 10.4161/cc.5.19.3267. [DOI] [PubMed] [Google Scholar]
- 17.Arnoldussen YJ, Lorenzo PI, Pretorius ME, Waehre H, Risberg B, Maelandsmo GM, Danielsen HE, Saatcioglu F. The mitogen-activated protein kinase phosphatase vaccinia H1-related protein inhibits apoptosis in prostate cancer cells and is overexpressed in prostate cancer. Cancer Res. 2008;68:9255–9264. doi: 10.1158/0008-5472.CAN-08-1224. [DOI] [PubMed] [Google Scholar]
- 18.Henkens R, Delvenne P, Arafa M, Moutschen M, Zeddou M, Tautz L, Boniver J, Mustelin T, Rahmouni S. Cervix carcinoma is associated with an up-regulation and nuclear localization of the dual-specificity protein phosphatase VHR. BMC Cancer. 2008;8:147. doi: 10.1186/1471-2407-8-147. [DOI] [PMC free article] [PubMed] [Google Scholar]
- 19.Hao L, ElShamy WM. BRCA1-IRIS activates cyclin D1 expression in breast cancer cells by downregulating the JNK phosphatase DUSP3/VHR. Int J Cancer. 2007;121:39–46. doi: 10.1002/ijc.22597. [DOI] [PubMed] [Google Scholar]
- 20.Amand M, Erpicum C, Bajou K, Cerignoli F, Blacher S, Martin M, Dequiedt F, Drion P, Singh P, Zurashvili T, Vandereyken M, Musumeci L, Mustelin T, Moutschen M, Gilles C, Noel A, Rahmouni S. DUSP3/VHR is a pro-angiogenic atypical dual-specificity phosphatase. Mol Cancer. 2014;13:108. doi: 10.1186/1476-4598-13-108. [DOI] [PMC free article] [PubMed] [Google Scholar]
- 21.Rittirsch D, Huber-Lang MS, Flierl MA, Ward PA. Immunodesign of experimental sepsis by cecal ligation and puncture. Nat Protoc. 2009;4:31–36. doi: 10.1038/nprot.2008.214. [DOI] [PMC free article] [PubMed] [Google Scholar]
- 22.Arimura Y, Yagi J. Comprehensive expression profiles of genes for protein tyrosine phosphatases in immune cells. Sci Signal. 2010;3 doi: 10.1126/scisignal.2000966. rs1. [DOI] [PubMed] [Google Scholar]
- 23.Musumeci L, Kuijpers MJ, Gilio K, Hego A, Theatre E, Maurissen L, Vandereyken M, Diogo CV, Lecut C, Guilmain W, Bobkova EV, Rascon J, Eble JA, Dahl R, Drion P, Mostofi Y, Yuan H, Sergienko E, Chung TD, Thiry M, Senis Y, Moutschen M, Mustelin T, Lancellotti P, Heemskerk JW, Tautz L, Oury C, Rahmouni S. DUSP3 Phosphatase Deficiency or Inhibition Limit Platelet Activation and Arterial Thrombosis. Circulation. 2014 doi: 10.1161/CIRCULATIONAHA.114.010186. [DOI] [PMC free article] [PubMed] [Google Scholar]
- 24.Biswas SK, Mantovani A. Macrophage plasticity and interaction with lymphocyte subsets: cancer as a paradigm. Nat Immunol. 2010;11:889–896. doi: 10.1038/ni.1937. [DOI] [PubMed] [Google Scholar]
- 25.Ghosn EE, Cassado AA, Govoni GR, Fukuhara T, Yang Y, Monack DM, Bortoluci KR, Almeida SR, Herzenberg LA. Two physically, functionally, and developmentally distinct peritoneal macrophage subsets. Proc Natl Acad Sci U S A. 2010;107:2568–2573. doi: 10.1073/pnas.0915000107. [DOI] [PMC free article] [PubMed] [Google Scholar]
- 26.Takeda K, Akira S. TLR signaling pathways. Seminars in immunology. 2004;16:3–9. doi: 10.1016/j.smim.2003.10.003. [DOI] [PubMed] [Google Scholar]
- 27.Yamamoto M, Takeda K. Current views of toll-like receptor signaling pathways. Gastroenterology research and practice. 2010;2010:240365. doi: 10.1155/2010/240365. [DOI] [PMC free article] [PubMed] [Google Scholar]
- 28.Symons A, Beinke S, Ley SC. MAP kinase kinase kinases and innate immunity. Trends in immunology. 2006;27:40–48. doi: 10.1016/j.it.2005.11.007. [DOI] [PubMed] [Google Scholar]
- 29.Schafer JSJF. Tolerance to plant disease. Annu Rev Phytopathol. 1971;9:235–252. [Google Scholar]
- 30.Schneider DS, Ayres JS. Two ways to survive infection: what resistance and tolerance can teach us about treating infectious diseases. Nat Rev Immunol. 2008;8:889–895. doi: 10.1038/nri2432. [DOI] [PMC free article] [PubMed] [Google Scholar]
- 31.Larsen R, Gozzelino R, Jeney V, Tokaji L, Bozza FA, Japiassu AM, Bonaparte D, Cavalcante MM, Chora A, Ferreira A, Marguti I, Cardoso S, Sepulveda N, Smith A, Soares MP. A central role for free heme in the pathogenesis of severe sepsis. Sci Transl Med. 2010;2 doi: 10.1126/scitranslmed.3001118. 51ra71. [DOI] [PubMed] [Google Scholar]
- 32.Figueiredo N, Chora A, Raquel H, Pejanovic N, Pereira P, Hartleben B, Neves-Costa A, Moita C, Pedroso D, Pinto A, Marques S, Faridi H, Costa P, Gozzelino R, Zhao JL, Soares MP, Gama-Carvalho M, Martinez J, Zhang Q, Doring G, Grompe M, Simas JP, Huber TB, Baltimore D, Gupta V, Green DR, Ferreira JA, Moita LF. Anthracyclines induce DNA damage response-mediated protection against severe sepsis. Immunity. 2013;39:874–884. doi: 10.1016/j.immuni.2013.08.039. [DOI] [PMC free article] [PubMed] [Google Scholar]
- 33.Porta C, Rimoldi M, Raes G, Brys L, Ghezzi P, Di Liberto D, Dieli F, Ghisletti S, Natoli G, De Baetselier P, Mantovani A, Sica A. Tolerance and M2 (alternative) macrophage polarization are related processes orchestrated by p50 nuclear factor kappaB. Proc Natl Acad Sci U S A. 2009;106:14978–14983. doi: 10.1073/pnas.0809784106. [DOI] [PMC free article] [PubMed] [Google Scholar]
- 34.Mehta A, Brewington R, Chatterji M, Zoubine M, Kinasewitz GT, Peer GT, Chang AC, Taylor FB, Jr, Shnyra A. Infection-induced modulation of m1 and m2 phenotypes in circulating monocytes: role in immune monitoring and early prognosis of sepsis. Shock. 2004;22:423–430. doi: 10.1097/01.shk.0000142184.49976.0c. [DOI] [PubMed] [Google Scholar]
- 35.Dumitru CD, Ceci JD, Tsatsanis C, Kontoyiannis D, Stamatakis K, Lin JH, Patriotis C, Jenkins NA, Copeland NG, Kollias G, Tsichlis PN. TNF-alpha induction by LPS is regulated posttranscriptionally via a Tpl2/ERK-dependent pathway. Cell. 2000;103:1071–1083. doi: 10.1016/s0092-8674(00)00210-5. [DOI] [PubMed] [Google Scholar]


