Abstract
Presently, there are no effective treatments for several diseases involving the central nervous system (CNS). While several novel molecular approaches are being developed, many of them require delivery of macromolecular or supramolecular agents to the CNS tissues protected by the blood–brain and blood–arachnoid barriers. A variety of approaches that are being developed for overcoming or bypassing the barriers are based on complex transfer processes. The delivery of biopharmaceuticals and other macromolecules and particulates to the CNS, especially through the leptomeningeal (intrathecal) route, includes a variety of stages, such as leptomeningeal propagation, drainage to the systemic circulation, and penetration into the CNS. The investigation of complex pharmacokinetics that includes convective, as well as diffusional and active transfer processes, greatly benefit from real-time non-invasive in vivo monitoring of the drug transport. Pharmacological positron emission tomography (PET) imaging, which enables such monitoring, plays an increasingly significant role in drug delivery and biopharmacology. PET is a powerful tool for quantitative in vivo tracking of molecules labeled with positron-emitting radionuclides. The high sensitivity, format, and accuracy of the data (similar to those of conventional tissue sampling biodistribution studies) make PET a readily adoptable pharmacological technique. In contrast to the conventional studies, PET also allows for longitudinal nonterminal same-animal studies. The latter may not only improve the data statistics, but also enable preclinical studies (especially in large and/or rare animals) not feasible under the conventional approach. This paper is intended to demonstrate the character of data that can be obtained by PET and to demonstrate how the main patterns of the leptomeningeal route pharmacokinetics can be investigated using this method. Examples of data processing are taken from our recent studies of five model proteins in rats and nonhuman primates.
Keywords: PET Imaging, Pharmacokinetics, Biopharmaceuticals, Macromolecules, Brain, Central nervous system, Drug delivery, Iodine-124
Introduction
The leptomeningeal route to the central nervous system (CNS) starts from drug administration (injection or infusion) into the cerebrospinal fluid (CSF) at one of the clinically feasible locations. The latter generally include lumbar spinal region and brain ventricles. Intrathecal lumbar (ITL) administration can be carried out via either needle insertion through an intervertebral disk or a surgically implanted catheter equipped with a subcutaneous injection port or a pump. Intracerebroventricular (ICV) administration is carried out through a surgically implanted cannula connected to an injection port anchored to the skull.
Upon mixing with CSF, the drug is then transported with the latter and can be either delivered to the target CNS tissues (brain, spinal cord, and nerve routes) or drained to the systemic circulation along with CSF in which it is dissolved.
The interface of CSF with CNS is not protected by any barriers. The layer of pia mater lining the brain surface is not continuous, and the continuity of the leptomeningeal space with the perivascular (Virchow–Robin) spaces penetrating deep into the parenchyma [1] is the major prerequisite for the potential efficacy of this delivery route. The leptomeningeal route includes the following major transport stages: (a) convectional transport in the CSF, (b) drug penetration into the brain parenchyma and spinal cord, (c) transport inside the CNS tissues, (d) drainage outside of the leptomeningeal compartment, and (e) uptake by cells lining the leptomeningeal space or otherwise residing therein. The fraction of the drug reaching the target region(s) in the CNS depends on the kinetics of all these processes.
The ITL drug delivery route was originally developed for small molecules, primarily anesthetics [2]. The behavior of macromolecules and nanoparticles in the leptomeningeal space has not been extensively studied. Thus, the leptomeningeal route to CNS, although promising due to the absence of a CSF–CNS barrier, consists of processes that depend on many insufficiently studied (for large molecules and nanoparticles) factors working at various levels and on different time frames, such as, remixing of CSF by the pulsatile movement of CNS tissues, drainage of CSF, and intraparenchymal transport.
Investigation of the complex combinations of transfer processes, as above, would benefit from methods enabling: (1) whole-body quantitative registration of all transfer processes on all time frames; (2) real-time data acquisition in the same animal; and (3) using any animal as its own control, which removes the individual variances from the kinetic data.
Positron emission tomography (PET), as a powerful tool for quantitative in vivo imaging of the transport of pharmaceuticals labeled with positron-emitting radionuclides, meets the above requirements. With the growing number of drugs and drug delivery systems that have nontrivial pharmacokinetics, PET imaging will play an increasingly significant role in preclinical (especially nonhuman primate) and, possibly, human studies.
The present studies were intended to investigate the pharmacokinetics of human recombinant enzymes after intrathecal (IT) administration in rats and nonhuman primates, to evaluate the relevance of rodent vs. primate models, and develop methodology for fully quantitative non-invasive pharmacokinetics studies by PET with 124I.
Experimental methods
Imaging principles
Radionuclide-based imaging methods generally surpass all other in vivo imaging methods in sensitivity, and presently deliver enough resolution to delineate small organs in humans and experimental animals, including rodents. However, PET, which is based on a photon pair registration principle [3], has two technical advantages that make it superior to methods based on single photon acquisition.
In all radionuclide-based methods, the image is built on the basis of the experimentally acquired set of “lines” (lines of response or LORs in PET), along which each gamma photon has traveled before hitting a detector (a scintillating crystal).
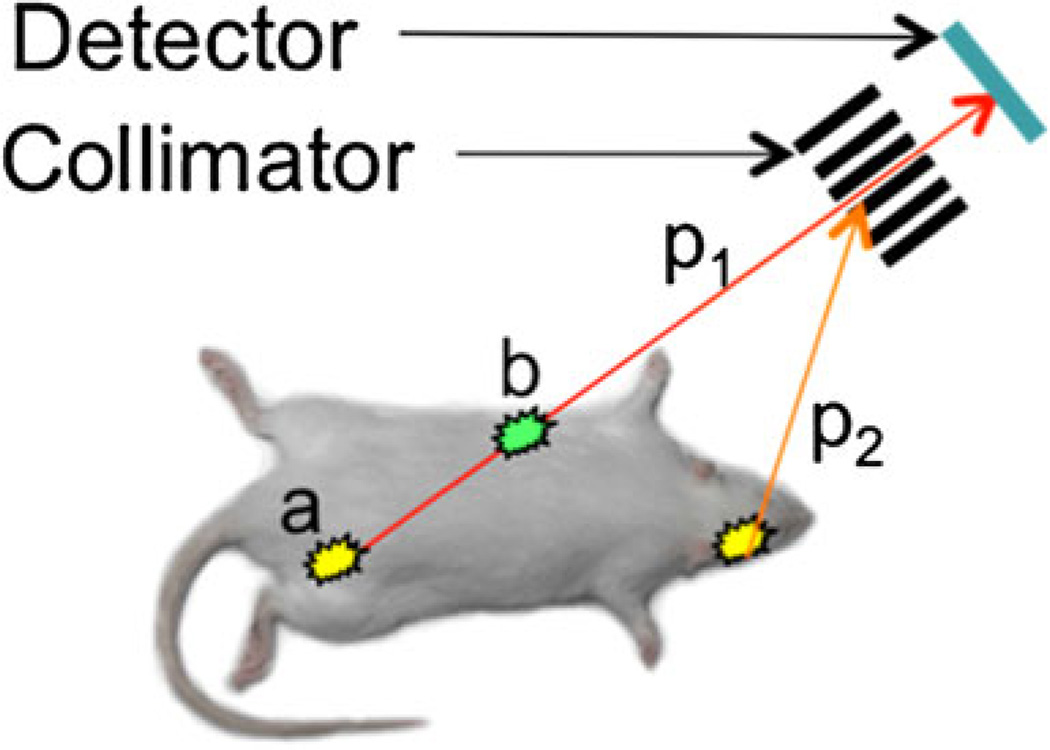
In single-photon methods, i.e., planar imaging and gamma photon emission tomography (SPECT), the lines are defined via the use of collimators—metal (usually lead) blocks with channels, absorbing all photons except the ones traveling along the channels (Fig. 1). In planar imaging, a 2D image is formed essentially from the density of scintillations in the collimator crystal. In SPECT, the collimator/detector pair (“head”) rotates around the source of radiation, and a 3D image is reconstructed from the acquired set of lines.
Fig. 1.
Single-photon data acquisition. The detector registers only gamma photons (p1) coming along the lines defined by the collimator, while other photons (p2) are absorbed. It is impossible to determine whether photon p1 came from point a, or point b, or any point in between. Thus, it is impossible to correct the data for photon absorption (attenuation) in the tissues
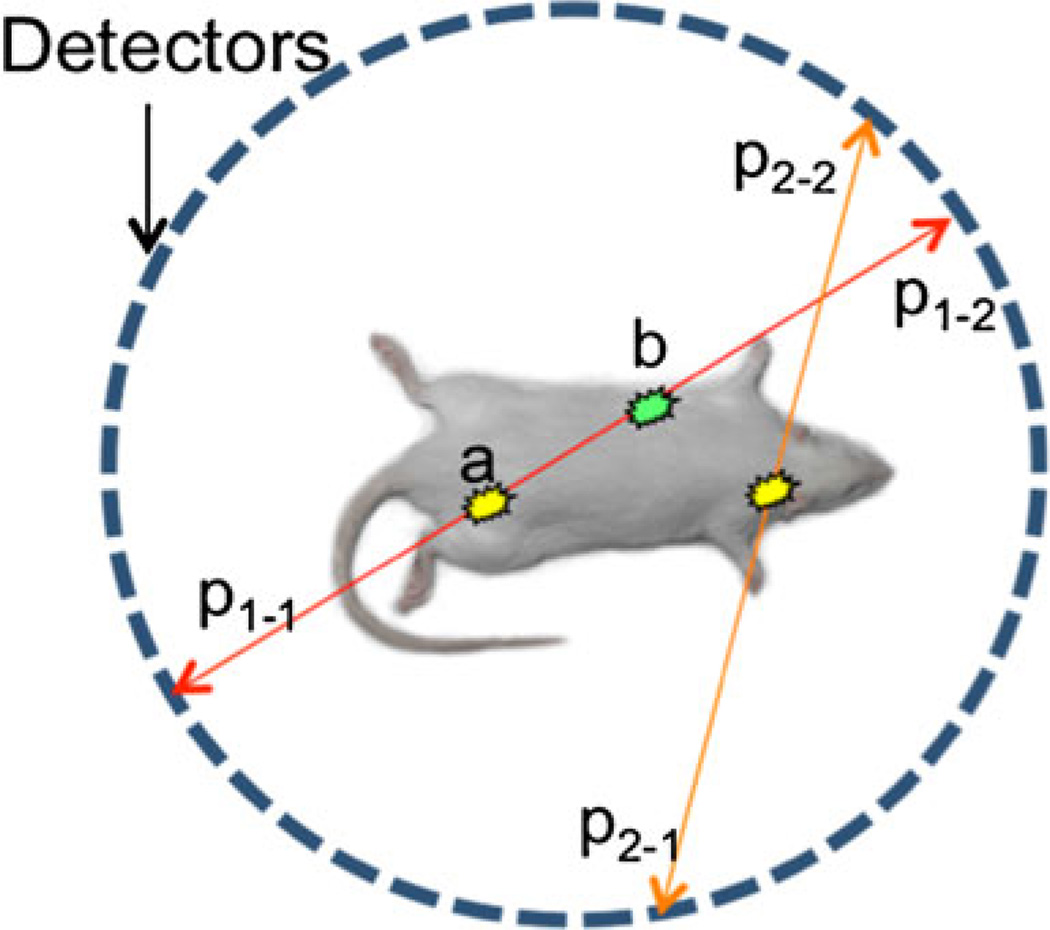
In PET (Fig. 2), gamma photons are produced as a result of annihilation of the positron emitted by the radionuclide used as a label. Annihilation results in two gamma photons with peak energy of 511 keV, traveling in exactly opposite directions. Simultaneous detection of the pair by two detectors (the latter usually positioned as a set of rings) produces the LOR. The method does not require a collimator and, thus, is much more sensitive than single-photon modalities, where photon loss in the collimator generally exceeds 99 % (higher at higher resolutions). Photon scatter in the collimator is another factor complicating image formation in single-photon modalities.
Fig. 2.
Photon pair data acquisition in PET. Positron annihilates with emission of two gamma photons traveling in opposite directions along the same line. It is impossible to determine whether photon pair p1–1/p1−1 came from point a, or point b, or any point in between. However, it is possible to correct the data for photon absorption in the tissues based on experimentally determined attenuation values
The major advantage of PET, however, is in the relative simplicity of accounting for photon absorption in the tissues (attenuation). It is easy to see (Figs. 1 and 2) that there is no way of knowing from which point on the LOR a photon has come. Thus, in single-photon modalities, it is impossible to correct the data for absorption. In PET, the photons (as a pair) always pass the entire segment of LOR located between the detectors. Photon absorption in this segment can be easily measured experimentally, and thus the data can be readily corrected for attenuation. The attenuation data is produced from transmission images obtained using a rotating gamma radiation source or (in PET-computed tomography (CT)) from X-ray transmission data acquired by an X-ray CT imager.
There are several less significant differences in the data collection and processing, in particular those affecting resolution and artifact formation, but they are outside the scope of this paper. The combination of higher sensitivity and quantitative data acquisition are the two major advantages of PET. The quality of PET data (for a given tomograph), in turn, depends on many other factors, in particular on the positron emitting radionuclide used in the studies.
Iodine-124 as PET label
Imaging of slow PK, which is characteristic of many “large molecule” drugs and drug delivery systems, requires positron-emitting labels (radionuclides) with long physical half-lives. 18F is by far the most widely used positron emitter due to the high diagnostic value of clinical PET imaging with [18F]-fluorodeoxygucose. However, the physical half-life of 18F is only 110 min. To date, there are no satisfactory methods for labeling biomolecules (in aqueous phase) with this radionuclide. Thus, 18F is a suboptimal choice for studies requiring long (>5–6 h) observations. Other radionuclides used in PET imaging, 11C, 13N, 15O, 82Rb and 68Ga, have even shorter physical half-lives: 20, 10, 2, 68, and 1.3 min, respectively. Copper-64 has a somewhat longer physical half-life (12.7 h) and can be used for labeling of compounds premodified with a chelating group, but the insufficiently studied fate of the label in vivo after metabolization of the labeled compound presently makes it useful mostly for studying of the early stages of biomolecules pharmacokinetics.
Recently, 124I, a cyclotron-produced radionuclide, has become commercially available. Among positron emitters available and suitable for PET, 124I has the longest physical half-life of 4.2 days. This, combined with the well-investigated behavior of iodinated biomolecules and iodide in vivo [4–6], makes 124I very attractive for long-term (several days) imaging studies.
The decay scheme of 124I is complex; its emission spectrum includes high-energy positrons (23 %) and high-energy single photons (60.5 % at 603 keV). Both the high energy of the positrons and the presence of single photons in the range close to the 511 keV of annihilation photon pairs may lead to degradation of sensitivity, spatial resolution, and image quality. However, we have shown that proper use of 124I provides fully quantitative data suitable for pharmacological research [7]. Therefore, 124I (IBA Molecular, VA, USA) was the main radionuclide in our studies. The radionuclide was supplied in the form of sodium 124I solution in 0.02 M NaOH, 0.3–2.7 µL/MBq. Nominal radiochemical purity: 95 % (<5 % of iodate and diiodate by high-performance liquid chromatography (HPLC)). Nominal radionuclidic purity is >99 % at calibration (<0.5 % of 123I; 125I: none detected, by HPGe gamma spectroscopy). Chemical purity is Te <1 µg/mL by UV–VIS spectroscopy.
Enzymes and labeling
Three human recombinant enzymes, idursulfase, arylsulfatase A, and sulfamidase, were produced and characterized by Shire HGT. The proteins were labeled with 124I up to 185 MBq/mg and administered at various doses, via intravenous and intrathecal routes, in rats and (the former two proteins) in cynomolgus monkeys.
Protein labeling was carried out via direct iodination in the presence of Iodogen (Thermo Scientific Pierce, IL, USA). The iodination procedure was optimized for each protein to ensure >95 % radiochemical purity with preservation of enzyme structure, activity, and cell uptake characteristics. After the labeling, the proteins were briefly treated with metabisulfite (1 mg/ml, 1 min) to reduce iodoamines, desalted on Sephadex G-25, and characterized by size exclusion HPLC with dual (gamma, UV) detection.
Imaging equipment
Imaging was carried out using either microPET P4 primate PET scanner (Concorde Microsystems/Siemens, TN, USA), or a custom PET/CT imaging system consisting of a Micro-PET Focus 220 PET scanner and a CereTom NL 3000 CT scanner (Neurologica, MA, USA). In the latter system, the imagers were aligned and equipped with a custom imaging bed extending through both imagers along the alignment axis, ensuring reliable PET/CT image registration [8].
Both microPET P4 and Focus 220 worked in 3D mode and featured a 22 cm animal opening, axial field of view (FOV) 7.6 cm and transaxial FOV 19 cm. The scanner’s detection systems enabled 2.5 mm (P4) and 2.1 mm (Focus 220) spatial resolution for 124I. The energy window of the PET imagers was set for the entire study to 350–650 keV, and the coincidence timing window was set to 6 ns.
CereTom NL 3000 is a six-slice tomograph with high-contrast resolution of 0.4 mm (developed for human head imaging in ICU). The image acquisition settings were: tube voltage, 100 kV; tube current, 5 mA; resolution, 6 s/projection; and axial mode with slice thickness of 1.25 mm. Image pixel size was set to 0.49×0.49×1.25 mm. The image sharpness was optimized to soft tissue. CT images were used for both anatomical reference and attenuation correction of the PET images. Fiducial markers (Eckert&Ziegler, Germany) were employed for PET/CT image co-registration that was carried out manually using ASIProVM software (Siemens/CTI Concorde Microsystems, Knoxville, TN, USA).
PET data acquisition, histogramming, and reconstruction were executed with the aid of microPET software (Siemens Medical Solutions, Inc., Malvern, PA, USA). Corrections for isotope decay, detector dead time, random coincidences, and tissue attenuation were applied. CT image reconstruction was carried out using Neurologica software. All subsequent image processing and analysis were performed on nonhost workstations using the ASIProVM software running under 32-bit Windows XP and Inveon Research Workplace 3.0 (Siemens Medical Solutions, Inc., Malvern, PA, USA) running under 64-bit Windows XP.
The PET data were reconstructed using a 3D ordered-subset expectation maximization/maximum a posteriori (OSEM3D/MAP) protocol with the smoothing resolution of 1.5 mm, nine OSEM3D subsets, two OSEM3D, and 15 MAP iterations. The data were also reconstructed with Fourier rebinning 2D filtered backprojection (FORE-2DFBP) [9] to ensure that the numerical data derived from OSEM3D/MAP and FORE-2DFBP reconstructed images were identical and thus to exclude the possible reconstruction artifacts (none were identified). FORE-2DFBP was performed with a ramp filter cutoff at the Nyquist spatial sampling frequency (0.5 mm−1). Whole body images were assembled of the acquired section images with a 12 mm overlap.
Animals
All animal studies were carried out in accordance with institutionally approved animal protocols.
Rats
IV administration
Animals were set in a restrainer. A heparinized 3″ catheter (BD 387334) was inserted into the tail vein and connected with a T connector (Abbott 1157218). Sodium pentobarbital, 35 mg/kg, was injected through the T connector cap and flushed with 0.5 mL saline. Then, animals were set on a MicroPET bed and injected with 124I-labeled model protein through the T connector cap (flushed with 0.5 mL of saline) simultaneously with the start of dynamic imaging procedure.
IT administration
Animals were anesthetized with sodium pentobarbital (50 mg/kg, IP injection). Nonsurgical intracisternal injection was carried out using a technique developed by Jeffers and Griffith [10]. Immediately after the injection, rats were placed on the MicroPET bed, and data were acquired for the cranial region for 20 min.
Nonhuman primates
Over the entire duration of the study, the animals were segregated from other NHPs and housed in a separate room at the MGH primate facility. At the housing site, the animals were sedated with Ketamine/Xylazine IM and then transported to the imaging site, where the animals were temporarily housed in standard NHP cages.
At the imaging site, each animal was first sedated with Ketamine IM (if and as needed), positioned on a custom polycarbonate imaging bed (MicroPET P4) or extended Focus 220 bed, and given continuous Isoflurane/O2 anesthesia. Heart rate, breathing rate, and CO2 content in the exhaled air were monitored continuously; isoflurane flow was adjusted as needed. Animals were given non-radioactive iodine (0.2 mL, 15 mM NaI) as a SC injection immediately before the study to suppress 124I uptake in the thyroid. The radioiodinated proteins were administered intravenously (IV) or intrathecally.
IV administration
A catheter equipped with a T connector was installed in the saphenous vein. The animals were set on a MicroPET bed and positioned for dynamic imaging of the lower thoracic (heart and liver) area. A transmission image was acquired before the injection. Then, the protein solution was administered through the T connector cap and flushed with 1 ml saline simultaneously with the start of the dynamic imaging procedure.
ITL administration (direct injection)
The animals were sedated; the injection point was shaved, wiped with 70 % alcohol, and treated with Betadine. Injections were carried out in a prone position with a support providing a vertically bent, exposed injection area (atlanto-occipital joint for ICM, L4-L5 area for IL). A 27 G 1″ needle equipped with a 3″ transparent catheter with a T-cap was inserted between the vertebra until CSF flow is detected in the catheter. A small volume (0.1–0.2 mL) of CSF was drawn through the catheter. Then, the 124I-labeled model protein solution was injected through the T-cap, and the latter was flushed with 0.05 mL of the previously drawn CSF. The needle was withdrawn and the injection site was immediately imaged.
ITL and ICV administration (catheterized animals)
The animals with surgically installed catheters equipped with subcutaneous injection ports (Northern Biomedical Research, MI, USA) were sedated; skin over the injection port wiped with 70 % alcohol, and treated with Betadine. Animals were set on the imaging bed in supine position. Injections were carried out through a 27 G 1″ needle equipped with a 3″ catheter with a T-cap. A small volume (0.1–0.2 mL) of CSF was drawn through the catheter. Then, the 124I-labeled model protein solution was injected through the T-cap, and the latter was flushed with isotonic saline, 0.5 ml/kg body weight. The needle was withdrawn and the injection site was immediately imaged for 20 min.
Both rats and nonhuman primates were imaged following essentially the same procedure. First, data was acquired for 20 min for the body section including the injection site (or catheter opening for ITL and ICV injections), and a section including the heart and the anterior edge of the liver. (The data was subsequently used for dynamic reconstruction). Then, full body section-by-section PET scans were carried out, 5 min (rats, monkeys) or 10 min (monkeys) per body section. Scans were performed on various schedules, in most studies at 1, 2, 4, 8, 24, 48, 96, and 192 h in rats and 1–5 h continuously with subsequent (12 or 24), (24 or 48), and 72 h points in monkeys. The data was subsequently used for static reconstruction. The numerical data from manually selected regions of interest were processed to determine protein concentration in the tissues.
Other methods
Fluorescein isothiocyanate-labeled sulfamidase was utilized to investigate by photoimaging the microdistribution of the protein delivered to the brain in rats. The protein was injected into cysterna magna; animals were euthanized and the brains were cryosectioned 24 h after the injection. The cryosections were photoimaged (phase contrast, fluorescein 490/520 nm channel, custom blue 375/450 nm channel) without fixation or staining. Other control experiments were carried out in nonhuman primates (to be reported separately for each studied protein; partially published in [11]).
Results and discussion
Macromolecule transfer in CSF
The objective of our studies was to determine whether PET, as a quantitative imaging modality, could be used to investigate the general features of the leptomeningeal pharmacokinetics of macromolecules. Although the intrathecal route of drug delivery is not new, and vast data has been accumulated on the intrathecal administration of small molecules (mostly anesthetics), and several clinical applications have been successfully developed, both the properties of the prospective drugs and the mechanistic objectives of their delivery through the intrathecal route differ very significantly.
The main objective of the ITL administration of anesthetics is to achieve high drug concentration in the spinal cord and/or nerve roots locally to the injection point, whereas drug transfer to the cerebral leptomeningeal compartment can be detrimental to the subject (e.g., opiate drug transport to the respiratory center). In contrast, the target of enzyme replacement therapeutics and other macromolecular drugs is in the brain parenchyma, and their delivery to the cerebral leptomeningeal compartment is not undesirable but necessary.
The physicochemical properties of biomolecules generally should facilitate wide spread in the leptomeningeal compartment: they are too large to freely diffuse into the arachnoid and spinal cord parenchyma, and too hydrophilic to interact with the lipidic components of the tissue. Consequently, their behavior in CSF is expected to be entirely different from most anesthetics. On the other hand, the functions of the mesothelial and other cells have not been studied enough to predict how rapidly they will take up certain biomolecules dissolved in CSF. The flows and fluxes of CSF were also not sufficiently studied to predict how rapidly and in what directions biomolecules can be propagated in the leptomeningeal compartment from the injection site (ITL or ICV), although it is clear that, considering the size of the molecules, diffusion cannot be expected to play a significant if any role in this process.
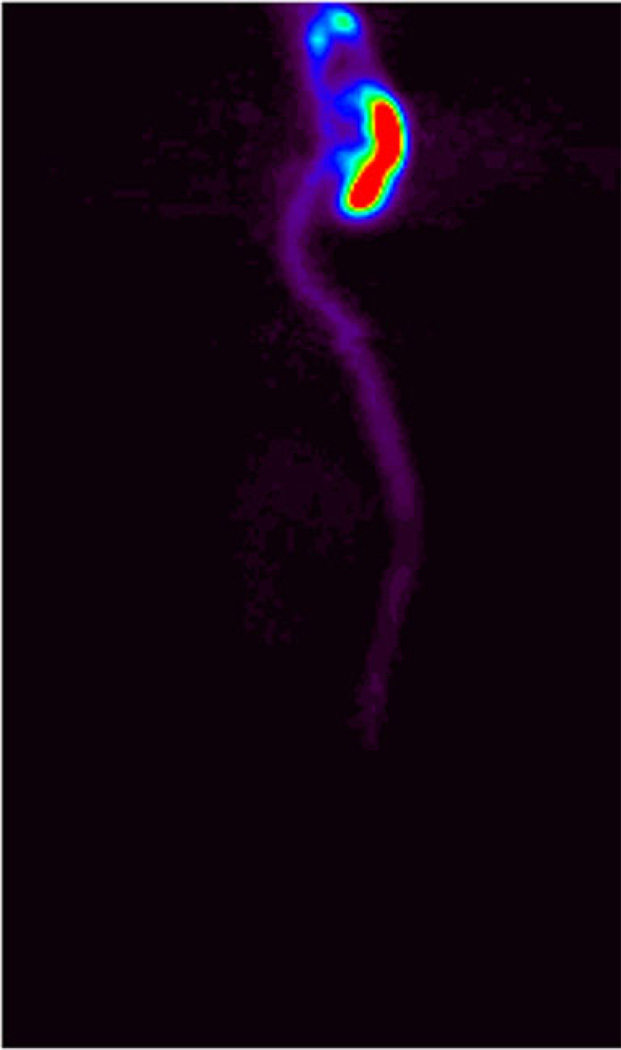
PET data demonstrated that in rats, all intracisternally administered proteins rapidly (within 5 min) spread over the entire cerebral CSF volume and into the proximal spinal leptomeningeal compartment (Fig. 3). In monkeys, the distribution process was dependent on the administered volume. Subcutaneous port administration generally suggests port flushing with relatively large volumes to ensure that the internal space of the port does not retain any significant fraction of the injected drug. The required volume for the ports used in this study (P.A.S. Port Elite, Smiths Medical ASD, Inc., MN, USA) to achieve <1 % dose remaining in the port was found to be about 1 ml. This is probably because the flush volume mixes with, rather than displaces, the internal port volume. Since the studies were carried out in animals with a wide range of body weights, from approximately 2–5 kg, the flush volume was adjusted for body weight to achieve the same intraspinal flushing effect in large animals as in smaller ones and was equal to 0.5 ml per 1 kg body weight. This is well below the injection volume that, as literature data suggests, is safe for primates, both human and nonhuman (up to 30 % of the total estimated CSF volume [11]).
Fig. 3.
Distribution of idursulfatase in rat 1 h after intracisternal administration. Dose, 10 mg/kg. Projection PET image (the sum of all sagittal slices). Relative color scale
According to our data, lumbar protein administration with 0.5 ml/kg body weight port flush (monkeys), which is <20 % of the estimated CSF volume, results in the immediate transfer of 55±20 % of the injected dose to the cerebral CSF. The movement of the protein in the spinal CSF is predominantly in the cranial direction, presumably because cranial and spinal leptomeningeal compartment (surrounded by bones) are not expandable, and the only expandable region of the dura is located in the cervical area, which accommodates the added volume.
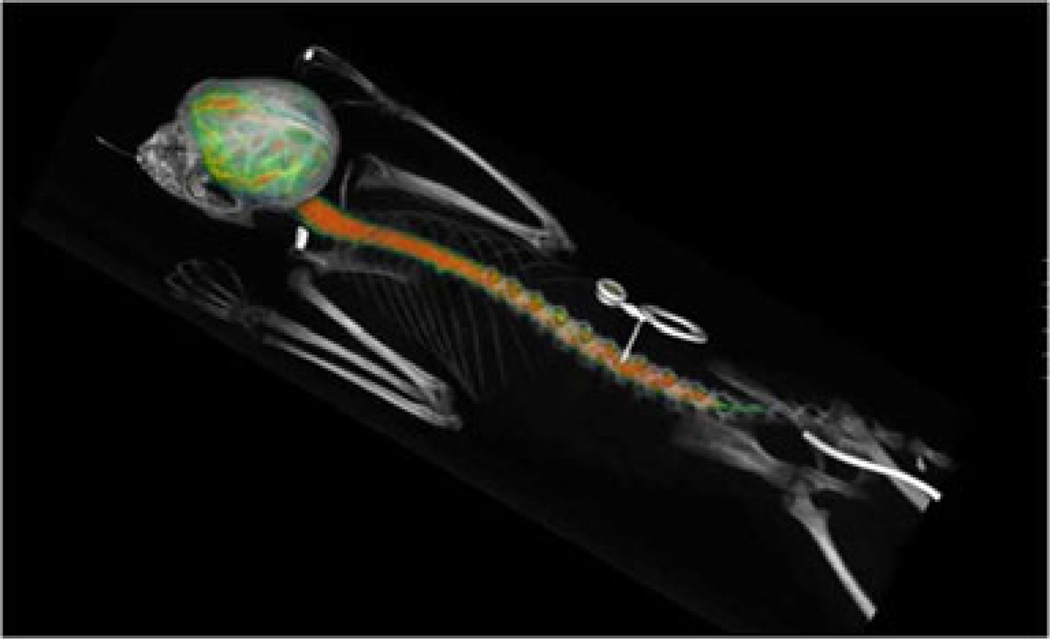
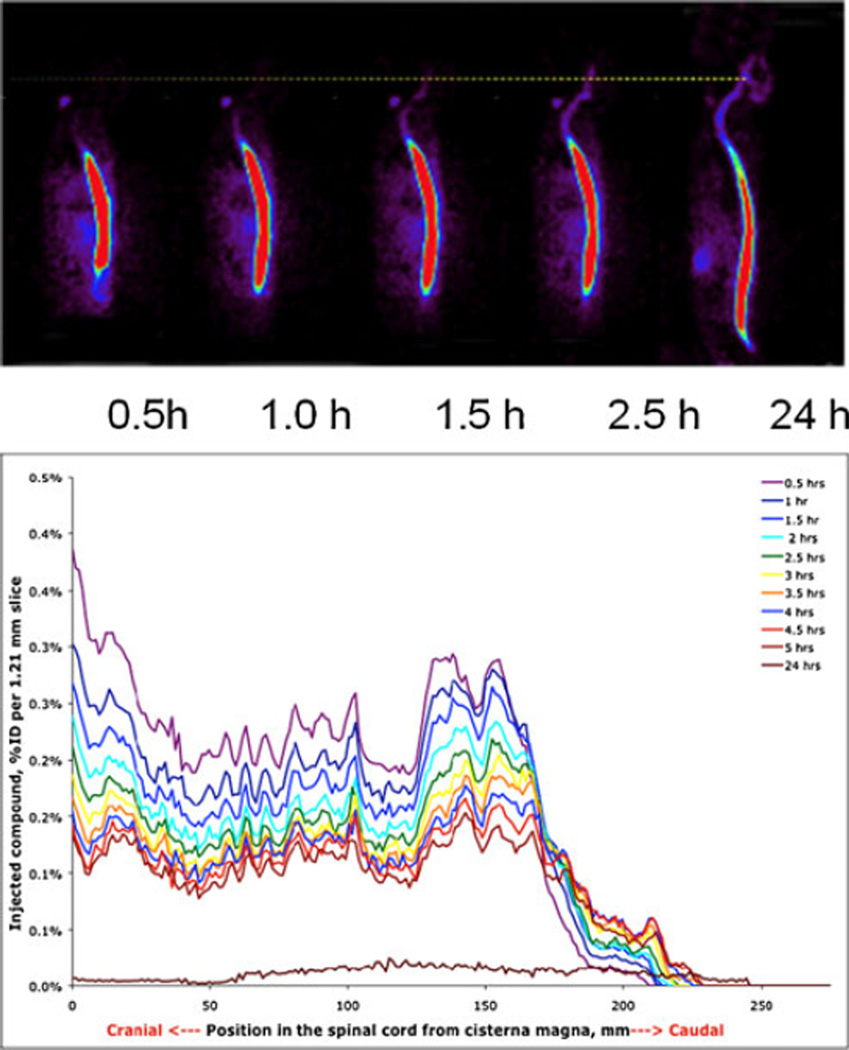
Based on the imaging data, by 1–3 h, the administered protein fills all minor channels and tissue folds (Fig. 4). Lumbar administration in smaller volumes results in a slower but still efficient protein transfer to the cerebral CSF without deposition at the catheter opening site (Fig. 5, top). Visual analysis of the image shows that the protein spreads in both directions from the injection point, much faster than may be expected from a diffusion-based mechanism. We hypothesize that the transfer is convectional and is assisted by pulsatile movement of the arteries in the leptomeningeal space and CNS tissues.
Fig. 4.
Protein distribution 3 h after ITL administration through a subcutaneous port (center) connected through a subcutaneous catheter with the leptomeningeal space. PET/CT image. Color represents 3D map of the protein concentration as measured by PET
Fig. 5.
Top visual representation of PET data on idursulfase (10 mg/animal) spread from the lumbar injection point in a monkey (color concentration). Bottom numerical graphic representation of the same data (% of ID per unit of spine length as a function of time)
Figure 5 (bottom) is a numerical graphic representation of the same data as is in the images. The graphs represent the amount of protein in the leptomeningeal compartment per unit of length of the spine from neck (left) to dorsal area. As can be clearly seen in the dorsal region, the rate of translocation of the “front” of the protein in the dorsal direction in this particular animal exceeds 10 mm per hour, which cannot be explained by diffusion, but is in agreement with the propagation of protein in CSF through constant remixing of CSF by local turbulences induced by the pulsation of tissues. In humans, the layer of CSF is thicker than in nonhuman primates, and the rate of propagation can be expected to be higher (which is important for the pharmacokinetics of ITL administered drugs and require farther investigation).
The data in Fig. 5 suggests that the uptake of the administered idursulfatase by the leptomeningeal tissues is relatively low. However, this may not be predictive of the behavior of other biomolecules. Detailed data on the receptor-specific endocytosis in the leptomeningeal space would be of great value for the development of drugs intended for the leptomeningeal route.
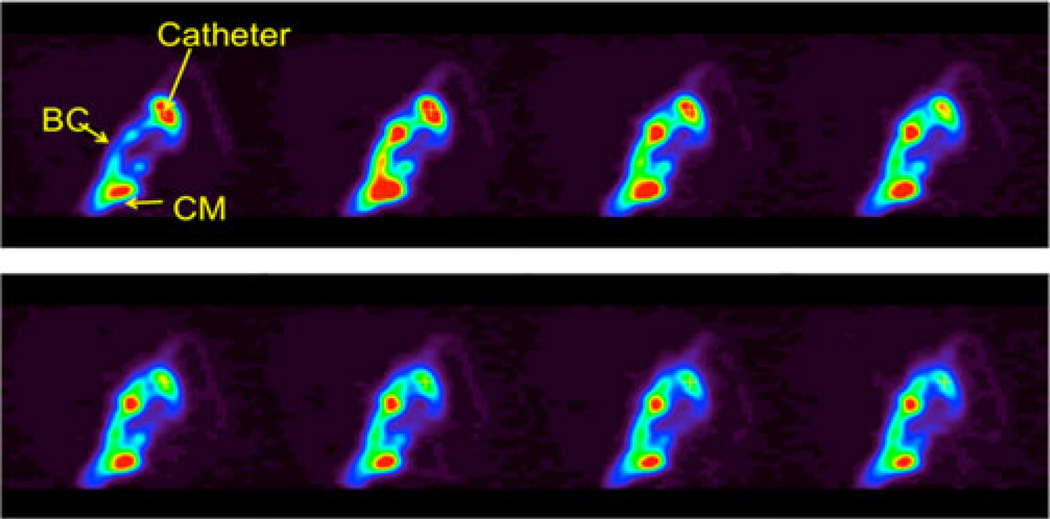
Protein injected ICV rapidly (within 15 min) translocated into the cisternae and basal channels (Fig. 6). The resultant protein distribution in CSF was very similar to that of large volume ILT administration without the deposition in the distal spine (Fig. 7a, described in more detail in our earlier publication [12]). Thus, notwithstanding some previous data [13], there is apparently no significant CSF descent (contrary to the pulsatile remixing of CSF), at least in this species. This, however, may be a matter of individual variations and may be influenced by pathological conditions as well as the nature of the labeled solute used in the studies. The issue of CSF movement (especially the general directions of the fluid flux vs. solute movements) as a result of local turbulences generated by pulsation, appears to be insufficiently studied and requires further investigation. PET, as a quantitative imaging modality, can be instrumental in such studies.
Fig. 6.
Time course of ICV administration, 2 min per frame. PET dynamic reconstruction, sagittal slice through the catheter tip (catheter), central-basal channel (BC), and cisterna magna (CM)
Fig. 7.
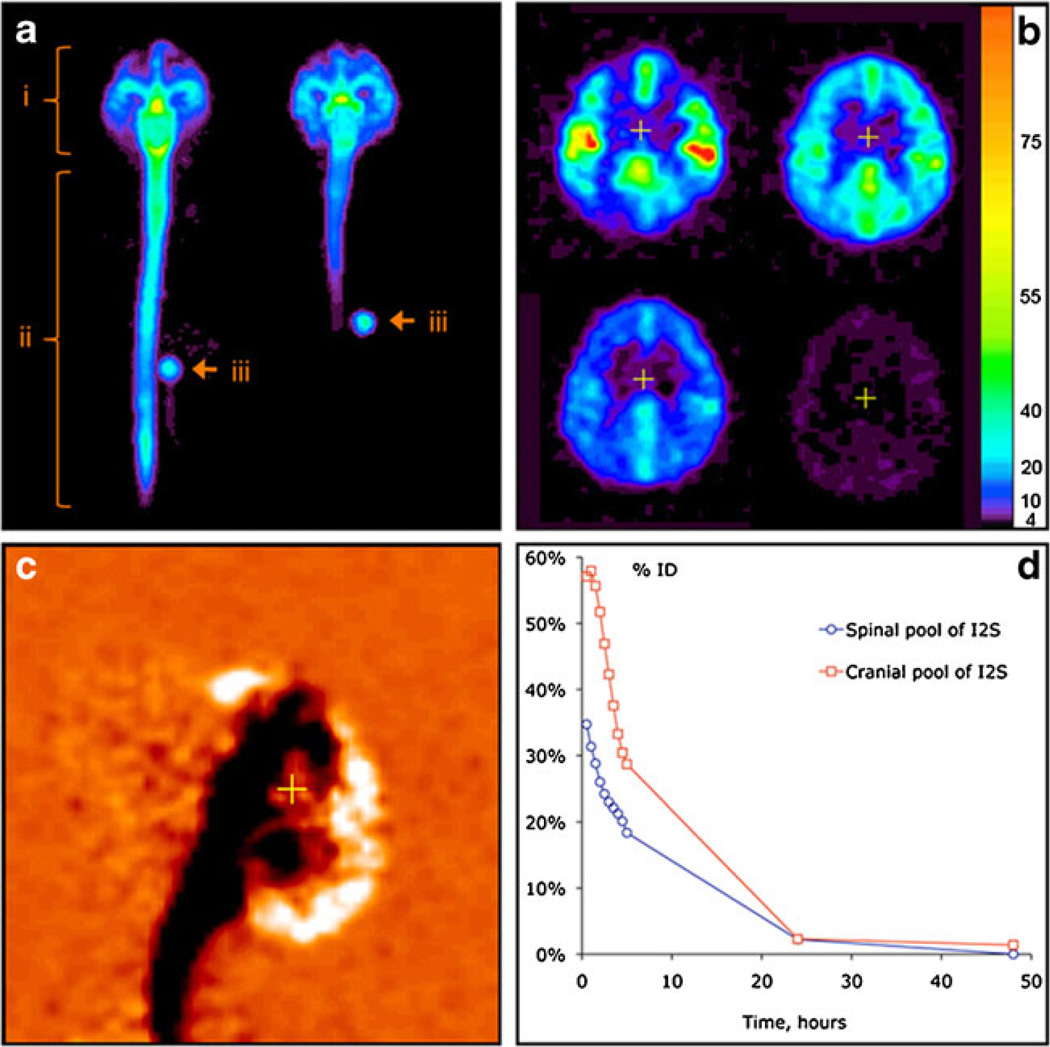
In vivo distribution of 124I-labeled I2S (3 mg/animal) in cynomolgus monkeys by PET. (a) Distribution of I2S administered through the lumbar (left) and ICV (right) catheters 30 minutes after the administration as demonstrated by a projection PET image (sum of all slices). Relative linear color scale. (b) The distribution of I2S in the brain at 0.5, 2.5, 5 and 24 hours after lumbar administration; PET image, 1.2 mm slice through the corpus callosum region in the plane parallel to the occipital bone. The color scale is calibrated in mg/ml of I2S. (c) Changes in the cerebral I2S distribution between 0.5 and 5 hours after lumbar administration shown in monochrome linear color scale. The image was obtained by subtraction of the quantitative data matrix obtained at 5 hours from the one obtained at 0.5 hours. Neutral orange color represents no change. Clearance of I2S from the CSF is seen as black, and accumulation in the parenchyma and arachnoid as white color. (d) An example of single-animal dynamics of I2S clearance from the leptomeningeal compartment and CNS [12]
Thus, both ICV and ITL administration routes appear to enable efficient delivery of macromolecules to the cerebral leptomeningeal space. The kinetics of the delivery depends on the injection (and port flush) volume.
Macromolecule penetration from CSF into the brain parenchyma
Rats
The small size of the rat brain prevented data analysis beyond calculating whole brain averages. For the three model enzymes, the label content in the brain was 45, 70, and 35 % after ITL administration for Idursulfase, arylsulfatase A, and sulfamidase, respectively (for comparison, IV administration resulted in 0.20, 0.15, and 0.05 % of injected dose/g, respectively). Idursulfase was cleared from both the brain and spinal cord with a half-life of ~7 h, while for the other two enzymes the half-life was ~24 h. Photoimaging studies indicated enzyme deposition in pia mater as well as in the brain parenchyma (not shown).
Monkeys
In monkeys, protein penetration from CSF into the brain can be quantified from the imaging data in more detail due to the larger size of the brain. The rate of protein transfer was maximal during the first 2–5 h; by this time, a significant fraction (30–50 %, depending on the protein) was cleared from the CSF to the systemic circulation. Figure 7b illustrates the process of protein deposition in the brain for Idursulfatase.
Sequential PET imaging of the brain after the IT lumbar injection (Fig. 7b) demonstrated that I2S had moved from the CSF into the superficial (20–100 mcg/ml as estimated from PET data) and then into deeper brain tissues (3–20 mcg/ml). The inflow continued for 461 h, as exemplified by the differential (0.5–5 h) PET image in Fig. 7c. In the cranial segments, the clearance was faster (Fig. 7c), which is consistent with CSF drainage to the system predominantly in the arachnoid granulations of the superior longitudinal sinus [14]. No residual protein deposition was detected near the catheter opening.
Similar pharmacokinetics was observed for arylsulfatase and for nanoparticulate materials (not shown, will be published in detail elsewhere).
The mechanism(s) of protein translocation into the brain parenchyma from CSF require farther investigation. The rate of translocation suggests participation of active transport mechanisms. To date, PET and photoimaging data suggest that two mechanisms may be at work, (a) pulsation-assisted translocation along perivascular (Virchow–Robin) spaces [15] and (b) axonal transport [16].
Macromolecule clearance from CSF
Transfer of proteins dissolved in CSF to the systemic circulation started immediately after the injection, without a lag, which is not consistent with CSF drainage to the lymphatic system with subsequent transfer to the blood, and suggests transfer directly to the blood.
Lymphatic transfer would also suggest protein accumulation in lymph nodes draining cerebral, cervical and spinal regions. Any lymphatic accumulation would be readily detectable by PET. However, none of the studied monkeys (n = 20) or rats (n = 64) demonstrated any lymphatic accumulation along the spine, with exception of single nodes sentinel to the lumbar injection sites. In monkeys, no significant lymphatic accumulation was found in cervical lymph nodes as well. In rats, cervical and submandibular nodes showed some accumulation (generally <1 % of ID), but this could be a result of minor CSF leakages from the intracisternal injection sites and thus further investigation is necessary.
Thus, the PET data suggest that, at least in nonhuman primates, there is no physiologically significant CSF drainage into the lymphatic system, and in rats there is no such drainage from the spinal pool of CSF. This data further suggests that in primates, penetration of CSF through the cribriform plate into the olfactory epithelium is insignificant, because from there it would have to drain into the cervical lymph nodes, which has not been observed. There was no indication of significant radioactivity accumulating anywhere in or around the nasal airways at any time point as well.
Thus, the kinetics of protein drainage from the leptomeningeal space is in the agreement with direct drainage with CSF to the blood (presumably in arachnoid villi) [14], and the rate of protein transfer to the systemic circulation is in agreement with the rate of CSF exchange [17] (Fig. 7d).
Conclusions
PET provides a variety of image and quantitative data suitable for both visual and numerical analysis. Overall, our data demonstrate that the leptomeningeal (intrathecal) route is suitable and promising for protein delivery to the brain parenchyma, including both gray and white matter. Biologically significant levels of the studied proteins were found in all brain compartments. Considering the mechanistic context, this suggests that other macromolecules and nanoparticles may also be delivered to CNS via this route.
Several mechanistic aspects of leptomeningeal drug transport, such as parenchymal transfer, CSF drainage and mesothelial uptake, are important for understanding of the data, and warrants further investigation. The data demonstrate that the initial transfer of intrathecally administered proteins can significantly depend on the injection (and port flush) volume, which also warrants further investigation.
Acknowledgments
This work was supported by NIH grant R21 CA152384, DoD grant BC100684, and grants from Shire HGT. Shire HGT also provided model proteins and imaging equipment.
Contributor Information
Mikhail I. Papisov, Email: papisov@helix.mgh.harvard.edu, Massachusetts General Hospital, Bartlett Hall 500R, 55 Fruit Street, Boston, MA 02114, USA; Harvard Medical School, Boston, MA, USA; Shriners Hospitals for Children-Boston, Boston, MA, USA.
V. Belov, Massachusetts General Hospital, Bartlett Hall 500R, 55 Fruit Street, Boston, MA 02114, USA Harvard Medical School, Boston, MA, USA; Shriners Hospitals for Children-Boston, Boston, MA, USA.
A. J. Fischman, Harvard Medical School, Boston, MA, USA Shriners Hospitals for Children-Boston, Boston, MA, USA.
E. Belova, Massachusetts General Hospital, Bartlett Hall 500R, 55 Fruit Street, Boston, MA 02114, USA Harvard Medical School, Boston, MA, USA; Shriners Hospitals for Children-Boston, Boston, MA, USA.
J. Titus, Massachusetts General Hospital, Bartlett Hall 500R, 55 Fruit Street, Boston, MA 02114, USA
M. Gagne, Massachusetts General Hospital, Bartlett Hall 500R, 55 Fruit Street, Boston, MA 02114, USA
C. Gillooly, Massachusetts General Hospital, Bartlett Hall 500R, 55 Fruit Street, Boston, MA 02114, USA
References
- 1.Rennels ML, Gregory TF, Blaumanis OR, Fujimuto K, Grady PA. Evidence for a paravascular fluid circulation in the mammalian central nervous system, provided by rapid distribution of tracer protein throughout the brain from the subarachnoid spaces. Brain Res. 1985;326:47–63. doi: 10.1016/0006-8993(85)91383-6. [DOI] [PubMed] [Google Scholar]
- 2.Yaksh T, editor. Spinal drug delivery. Amsterdam: Elsevier; 1999. [Google Scholar]
- 3.Sweet WH, Brownell GL. Localization of brain tumors with positron emitters. Nucleonics. 1953;11:40–45. [Google Scholar]
- 4.Friedman JE, Watson JA, Jr, Lam DW-H, Rokita SE. Iodotyrosine deiodinase is the first mammalian member of the NADH oxidase/flavin reductase superfamily. J Biol Chem. 2006;281:2812–2819. doi: 10.1074/jbc.M510365200. [DOI] [PubMed] [Google Scholar]
- 5.Ullberg S, Ewaldsson B. Distribution of radio-iodine studied by whole-body autoradiography. Acta Radiol Ther Phys Biol. 1964;2:24–32. doi: 10.3109/02841866409134127. [DOI] [PubMed] [Google Scholar]
- 6.Hays MT, Solomon DH. Influence of the gastrointestinal iodide cycle on the early distribution of radioactive iodide in man. J Clin Invest. 1965;44:117–127. doi: 10.1172/JCI105118. [DOI] [PMC free article] [PubMed] [Google Scholar]
- 7.Belov VV, Bonab AA, Fischman AJ, Heartlein M, Calias P, Papisov MI. Iodine-124 as a label for pharmacological PET imaging. Mol Pharm. 2011;8(3):736–747. doi: 10.1021/mp100358f. [DOI] [PubMed] [Google Scholar]
- 8.Carney JPJ, Flynn JL, Cole KS, Fisher D, Schimel D, Via LE, Cordell M, Longford CPD, Nutt R, Landry C, Tybinkowski AP, Bailey EM, Frye LJ, Laymon CM, Lopresti BJ. Preclinical PET/CT system for imaging non-human primates; IEEE Medical Imaging Conference; 2009. abstract M06-67. [Google Scholar]
- 9.Defrise M, Kinahan PE, Townsend DW, Michel C, Sibomana M, Newport DF. Exact and approximate rebinning algorithms for 3-D PET data. IEEE Trans Med Imag. 1997;16:145–158. doi: 10.1109/42.563660. [DOI] [PubMed] [Google Scholar]
- 10.Farris, Griffith, editors. The rat in laboratory investigation. Philadelphia: Lippincott; 1949. pp. 196–197. [Google Scholar]
- 11.Rieselbach RE, Di Chiro G, Freireich EJ, Rall DP. Subarachnoid distribution of drugs after lumbar injection. N Engl J Med. 1962;267:1273–1288. doi: 10.1056/NEJM196212202672502. [DOI] [PubMed] [Google Scholar]
- 12.Calias P, Papisov M, Pan J, Savioli N, Belov V, et al. CNS penetration of intrathecal-lumbar idursulfase in the monkey, dog and mouse: implications for neurological outcomes of lysosomal storage disorder. PLoS One. 2012;7(1):e30341. doi: 10.1371/journal.pone.0030341. [DOI] [PMC free article] [PubMed] [Google Scholar]
- 13.Chiro GD, Hammock MK, Bleyer WA. Spinal descent of cerebrospinal fluid in man. Neurology. 1976;26:1–8. doi: 10.1212/wnl.26.1.1. [DOI] [PubMed] [Google Scholar]
- 14.Segal MB. Fluid compartments of the central nervous system. In: Zheng W, Chodobski A, editors. The blood–cerebrospinal fluid barrier. Boca Raton: CRC; 2005. pp. 83–99. [Google Scholar]
- 15.Rennels M, Gregory TF, Blauymanis OR, Fujimoto K, Grady PA. Evidence for a paravascular fluid circulation in the mammalian central nervous system, provided by the rapid distribution of tracer protein throughout brain from the subarachnoid space. Brain Res. 1985;326:47–53. doi: 10.1016/0006-8993(85)91383-6. [DOI] [PubMed] [Google Scholar]
- 16.Passini MA, Lee EB, Heuer GG, Wolfe JH. Distribution of a lysosomal enzyme in the adult brain by axonal transport and by cells of the rostral migratory stream. J Neurosci. 2002;22:6437–6446. doi: 10.1523/JNEUROSCI.22-15-06437.2002. [DOI] [PMC free article] [PubMed] [Google Scholar]
- 17.Davison H, Segal MB, editors. Physiology of the CSF and the blood–brain barriers. Boca Raton: CRC; 1996. p. 201. [Google Scholar]


