Abstract
TP53 , a well-known tumour suppressor gene, is frequently inactivated by mutation or deletion in a majority of human tumours1,2. A tremendous effort has been made to restore p53 activity in cancer therapies3–7. However, no effective p53-based therapy has been successfully translated into clinical cancer treatment due to the complexity of p53 signalling. Here, we demonstrate that genomic deletion of TP53 frequently encompasses neighbouring essential genes, rendering cancer cells with hemizygous TP53 deletion vulnerable to further suppression of such genes. POLR2A is identified as such a gene that is almost always co-deleted with TP53 in human cancers. It encodes the largest and catalytic subunit of RNA polymerase II complex, which is specifically inhibited by α-Amanitin8,9. Our analysis of The Cancer Genome Atlas (TCGA) and Cancer Cell Line Encyclopaedia (CCLE) databases reveals that POLR2A expression levels are tightly correlated with its gene copy numbers in human colorectal cancer (CRC). Suppression of POLR2A with α-Amanitin or small interfering RNAs, selectively inhibits proliferation, survival and tumorigenic potential of CRC cells with hemizygous TP53 loss in a p53-independent manner. Previous clinical applications of α-Amanitin have been limited due to its liver toxicity10. However, we found that α-Amanitin-based antibody drug conjugates (ADCs) are highly effective therapeutic agents with reduced toxicity11. Here, we show that low doses of α-Amanitin-conjugated anti-EpCAM (Epithelial Cell Adhesion Molecule) antibody lead to complete tumour regression in murine models of human CRC with hemizygous deletion of POLR2A. We anticipate that inhibiting POLR2A will be a novel therapeutic approach for human cancers harbouring such common genomic alterations.
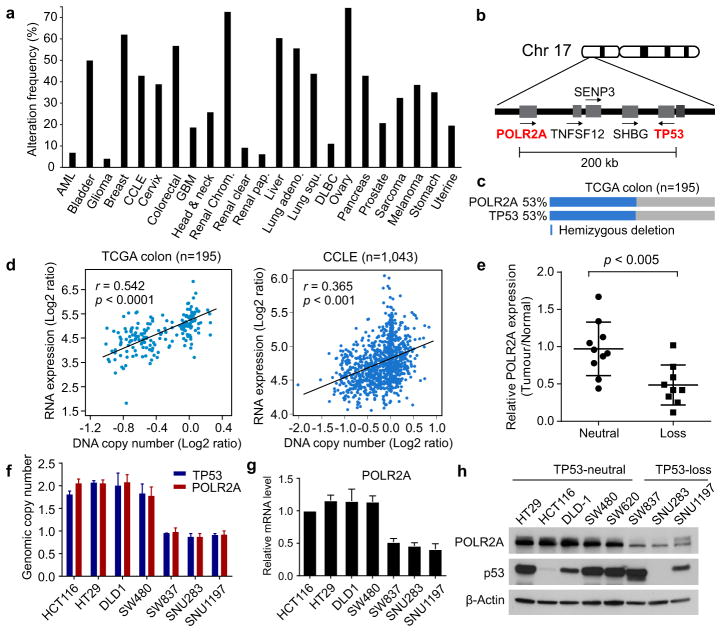
Genomic deletion of a tumour suppressor gene often encompasses multiple neighbouring genes that may not contribute to cancer development, but are essential for cell proliferation and survival12. This partial loss of essential genes has been postulated to render cancer cells highly vulnerable to further inhibition of those genes13,14. Analysis of TCGA revealed that hemizygous deletion of the TP53 gene occurs frequently in human cancers (Fig. 1a). We identified POLR2A as an essential gene in the proximity of TP53 (Fig. 1b). Concomitant deletion of POLR2A occurs in virtually all the human colorectal tumours harbouring hemizygous deletion of TP53 (Fig. 1c).
Figure 1. Expression of POLR2A, but not TP53, is correlated with the gene copy number.
a, Frequencies of hemizygous deletion of TP53 in human cancers. b, Schematic diagram of genes adjacent to TP53 in human genome. c, Concomitant deletion of POLR2A in human CRCs harbouring hemizygous loss of TP53. d, Scatterplots of POLR2A copy number versus mRNA expression in TCGA and CCLE databases. Pearson correlation coefficient (r) and p value are displayed. e, POLR2A protein levels in matched normal and CRC tissue samples. Error bars, s.d. f, g, Copy numbers (f) and relative mRNA expression levels (g) of POLR2A in human CRC cell lines. Data are mean and s.d. of three independent experiments. h, Protein levels of POLR2A and p53 in human CRC cell lines.
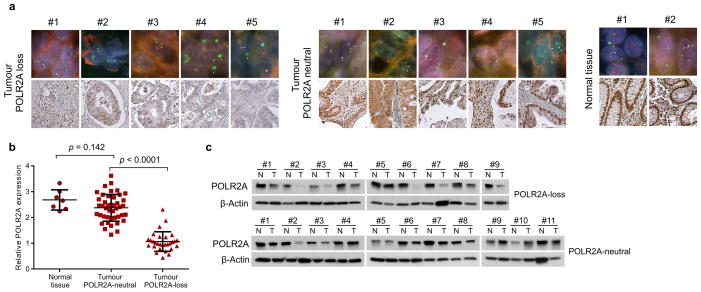
Among the twelve subunit in human RNA polymerase II complex, POLR2A encodes the largest subunit that is indispensable for the polymerase activity in mRNA synthesis. Inhibiting POLR2A with a specific inhibitor, α-Amanitin, causes extensive cell death, and homozygous deletion of POLR2A is lethal in human cells9,15. We found that 104 (53%) out of 195 CRC cases bear hemizygous loss of the 17p13 region, resulting in concomitant deletion of TP53 and POLR2A (Fig. 1c). However, no homozygous deletion of POLR2A was observed, consistent with the notion that POLR2A is essential for cell survival. Analysis of TCGA and CCLE databases revealed that expression of POLR2A is tightly correlated with its gene copy number (Fig. 1d). This positive correlation was also validated in twenty pairs of matched normal and CRC tissue samples and human CRC tissue microarray (Fig. 1e and Extended Data Fig. 1). POLR2Aloss (hemizygous loss) cell lines expressed POLR2A proteins at significantly lower levels than POLR2Aneutral cell lines (Fig. 1f–h). Unlike POLR2A, p53 levels are determined by post-transcriptional and post-translational events16. Despite a correlation between TP53 copy number and mRNA expression, p53 protein levels are not associated with its gene copy numbers in human CRC (Extended Data Fig. 2 and Fig. 1h).
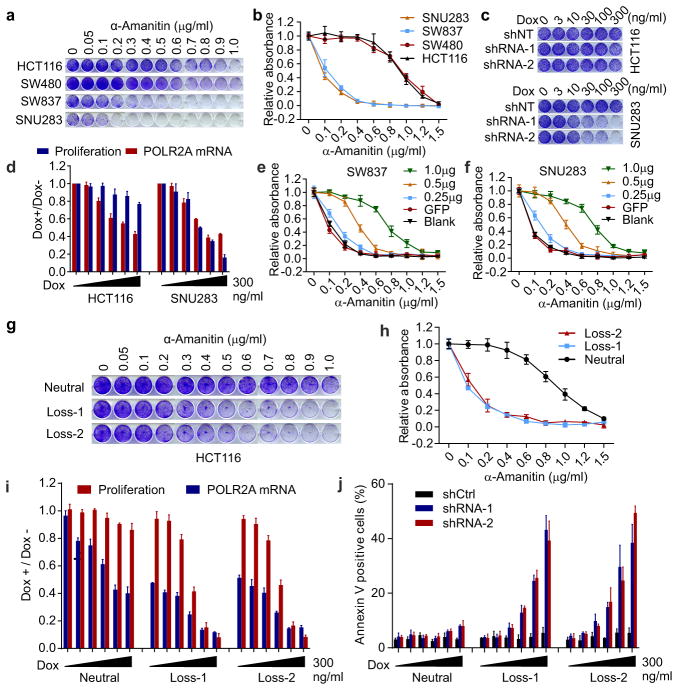
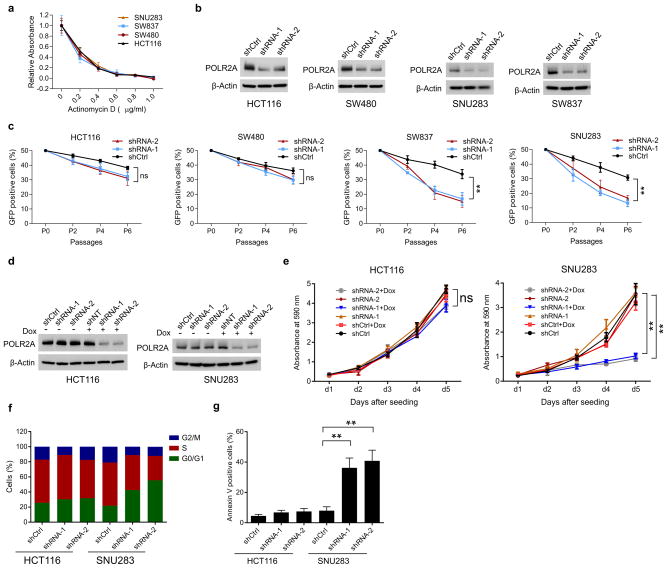
To assess the sensitivity of cells to POLR2A inhibition, a panel of POLR2Aneutral (HCT116, SW480) and POLR2Aloss (SW837, SNU283) cells were treated with α-Amanitin. Treatment of α-Amanitin at high concentrations (≥ 1μg ml−1) caused complete cell death in all four cell lines. However, at concentrations from 0 to 1.0 μg ml−1, α-Amanitin inhibition had significantly higher levels of cell-killing effect on the POLR2Aloss cells than on the POLR2Aneutral cells (Fig. 2a, b). The half-maximum inhibitory concentration (IC50) was ~1.0 μg ml−1 for the POLR2Aneutral cells, which was ~10-fold greater than that of the POLR2Aloss cells. By contrast, the POLR2Aloss cells did not show any greater sensitivity to the treatment of actinomycin D, a nonspecific transcription inhibitor (Extended Data Fig. 3a). In direct competition assays, the POLR2Aneutral cells (HCT116, SW480) stably expressing POLR2A shRNAs only had modestly reduced proliferation, in comparison with that of the corresponding cells expressing control shRNAs (Extended Data Fig. 3b, c). However, silencing POLR2A in the POLR2Aloss cells (SNU283, SW837) led to markedly reduced proliferation. We generated HCT116 and SNU283 cell lines stably expressing doxycycline (Dox)-inducible POLR2A shRNAs (Extended Data Fig. 3d). Despite significant knockdown of POLR2A, HCT116 cells continued to proliferate, whereas SNU283 cells exhibited severe G1 cell cycle arrest and apoptosis (Fig. 2c, d and Extended Data Fig. 3e–g). Approximately 50% of decrease in POLR2A expression (30–100 ng ml−1 of Dox) remarkably reduced the proliferation of SNU283 cells, but only had a modest effect on HCT116 cells (Fig. 2d). Results of rescue experiments demonstrated that gradual re-expression of exogenous POLR2A in SNU283 and SW837 cells restored their resistance to α-Amanitin up to a level comparable to that of the POLR2Aneutral cells (Fig. 2e, f and Extended Data Fig. 4).
Figure 2. POLR2Aloss cells are highly sensitive to the POLR2A inhibition.
a, b, POLR2Aloss cells (SW837, SNU283) are significantly more sensitive to α-Amanitin treatment than POLR2Aneutral cells (HCT116, SW480). Crystal violet staining of cells (a) and quantification analyses (b) are shown. c, Dox-induced suppression of POLR2A inhibited the proliferation of SNU283 cells, but not of HCT116 cells. d, Correlation between POLR2A mRNA expression and cell proliferation in HCT116 and SNU283 cells expressing Dox-inducible POLR2A shRNA. e, f, Survival curves of SW837 (e) and SNU283 (f) cells treated with α-Amanitin after transfection with increasing amounts of PORL2A expression vector DNA. g, h, POLR2Aloss HCT116 cells are significantly more sensitive to α-Amanitin treatment than the parental POLR2Aneutral cells. Crystal violet staining of cells (g) and quantification analyses (h) are shown. i, j, Correlation between POLR2A mRNA expression and cell proliferation (i) or apoptosis (j) in POLR2Aneutral and POLR2Aloss HCT116 cells. Data are mean and s.d. of three independent experiments in the figure.
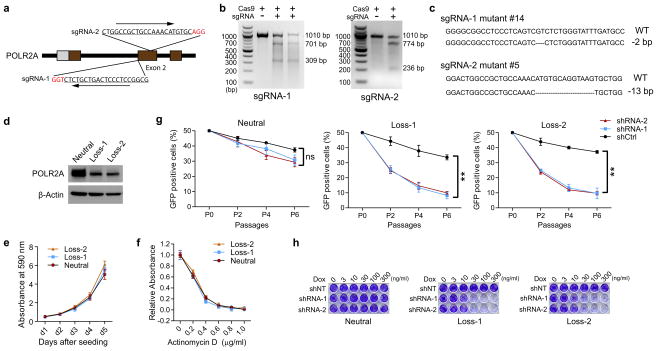
To exclude genetic difference across cell lines, we employed CRISPR (clustered regularly interspaced short palindromic repeat)/Cas9 system to generate an isogenic HCT116 cell line with hemizygous loss of POLR2A17,18 (Extended Data Fig. 5a–c). POLR2A expression was significantly reduced in the POLR2Aloss HCT116 cells (Extended Data Fig. 5d). The POLR2Aloss and parental HCT116 cells exhibited similar proliferation rates (Extended Data Fig. 5e), indicating that one allele of POLR2A is sufficient to maintain cell proliferation. However, hemizygous deletion of POLR2A dramatically sensitized HCT116 cells to α-Amanitin treatment with an IC50 of ~ 0.1 μg ml−1, which is 8-fold lower than that of parental HCT116 cells (Fig. 2g, h). As a control, no substantial difference on their sensitivity to actinomycin D was observed (Extended Data Fig. 5f). Knockdown of POLR2A resulted in profoundly reduced proliferation in the POLR2Aloss cells, but not in the isogenic POLR2Aneutral cells (Extended Data Fig. 5g). In the isogenic pair of HCT116 cell lines expressing Dox-inducible POLR2A shRNAs, a low-dose of Dox (100 ng ml−1) was sufficient to remarkably kill the POLR2Aloss cells, while high doses of Dox only had minimal effects on the POLR2Aneutral cells (Fig. 2i, j and Extended Data Fig. 5h).
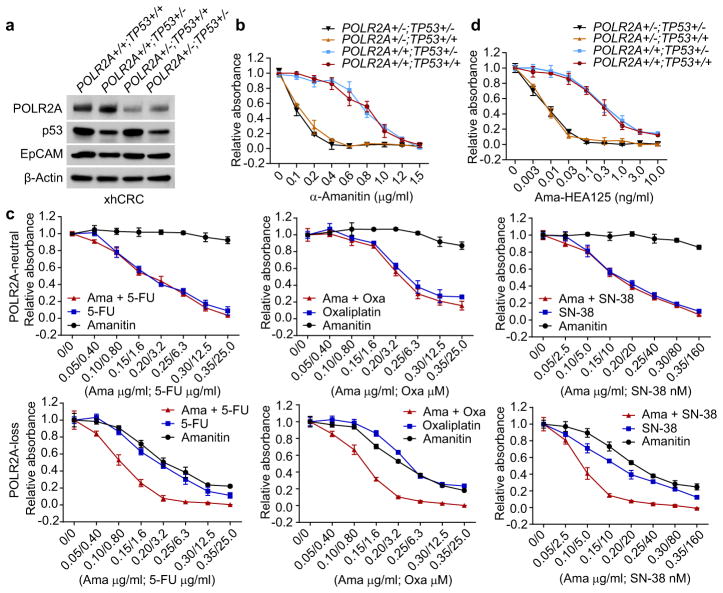
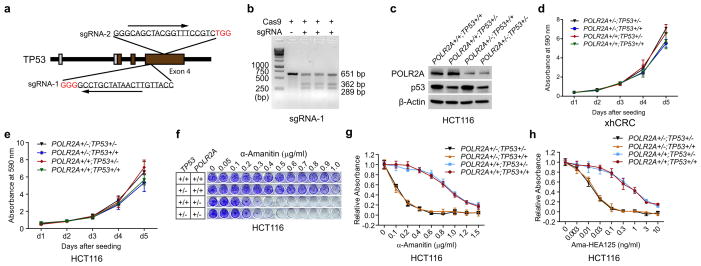
Blockage of RNA polymerase may lead to p53 accumulation and activation19. To examine the effects of p53, we recapitulated the concomitant deletion of TP53 and POLR2A in HCT116 and xhCRC cell lines (Fig. 3a and Extended Data Fig. 6a–c). The xhCRC cell line (TP53+/+;POLR2A+/+), established from a freshly isolated xenografted human colon tumour, demonstrated enhanced tumourigenicity in vivo20. Except for slightly increased cell proliferation, no significant changes in their sensitivity to α-Amanitin were observed in either xhCRC or HCT116 cells with hemizygous deletion of TP53. By contrast, hemizygous loss of POLR2A markedly sensitized these cells to α-Amanitin treatment regardless of their TP53 status (Fig. 3b and Extended Data Fig. 6d–g). The mRNA synthesis activity of the RNA polymerase II is essential to any type of cells including therapy-resistant tumour cells. We examined the drug sensitivity of POLR2Aneutral and POLR2Aloss cells to three major chemotherapy drugs for CRC: 5-fluorouracil (5-FU), oxaliplatin, and SN-38. Inhibition of POLR2A by α-Amanitin significantly enhanced cell-killing effects of all three drugs in the POLR2Aloss xhCRC cells, but had no notable effects on the POLR2Aneutral cells (Fig. 3c), suggesting therapeutic vulnerability of POLR2Aloss colorectal tumours. Free α-Amanitin is toxic to liver due to its interaction with OATP1B3, a transporter exclusively expressed on the membrane of hepatocytes10. However, α-Amanitin, when conjugated with specific antibodies, is no longer a substrate for OATP1B310,11,21. This strategy overcomes the toxicity of α-Amanitin for clinical applications. We used α-Amanitin conjugated to a monoclonal antibody (HEA125) against EpCAM, a cancer antigen overexpressed in adenocarcinomas11,22. The Ama-HEA125 conjugate selectively killed the POLR2Aloss xhCRC and HCT116 cancer cells in a p53-independent manner and reduced the effective doses of α-Amanitin by at least 10,000-fold (IC50 ~ 0.01 ng ml−1) in vitro (Fig. 3d and Extended Data Fig. 6h).
Figure 3. The sensitivity of POLR2Aloss cells to POLR2A inhibition is independent of p53.
a, Protein levels of POLR2A, p53 and EpCAM in a panel of isogenic human xhCRC cell lines. b, Cell proliferation of isogenic xhCRC cells treated with α-Amanitin. c, Sensitivity of isogenic xhCRC cells to 5-FU, Oxaliplatin (Oxa) or SN-38 treatment combined with or without α-Amanitin. d, Cell proliferation of isogenic xhCRC cells treated with Ama-HEA125. Data are mean and s.d. of three independent experiments in the figure.
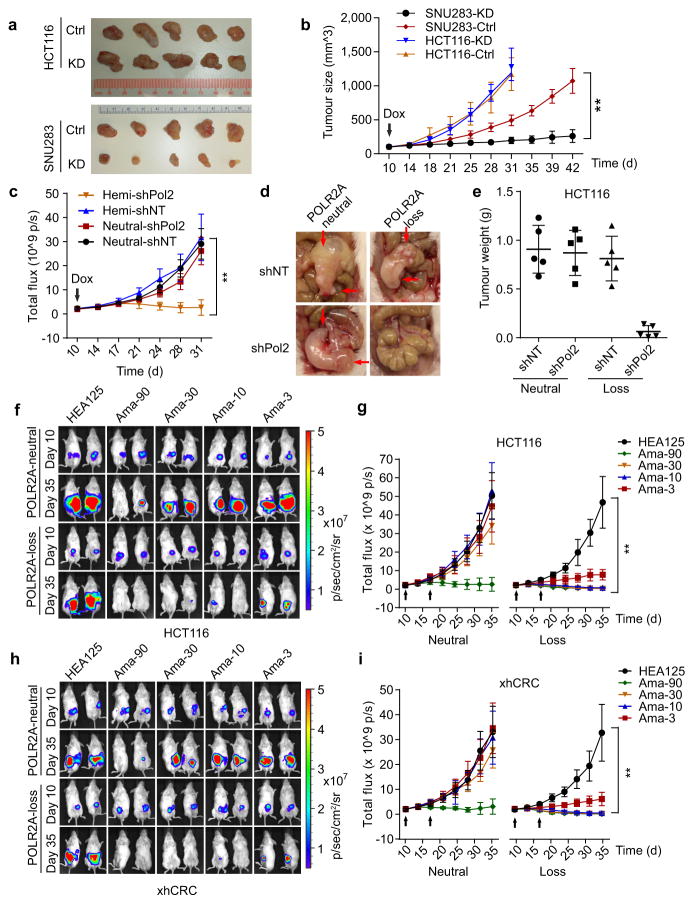
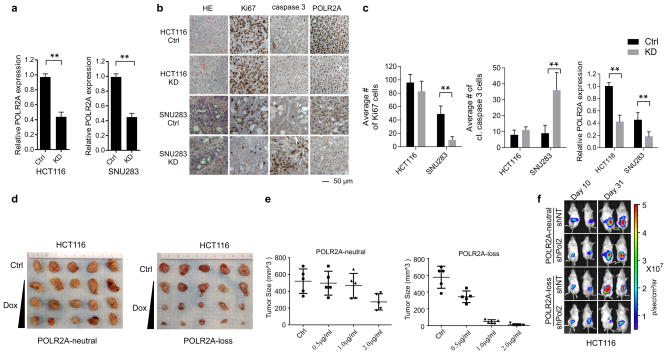
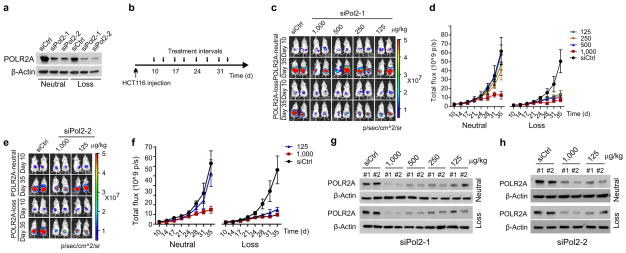
To test the anti-tumour effect of POLR2A inhibition in vivo, HCT116 and SNU283 cells expressing Dox-inducible POLR2A shRNA were injected subcutaneously into NOD/SCID mice. Following initial tumour establishment, administration of Dox (1.0 μg ml−1) in drinking water suppressed POLR2A expression and consequently inhibited the growth of SNU283-derived tumours (Fig. 4a, b and Extended Data Fig. 7a). However, no substantial differences were observed between control and POLR2A-knockdown HCT116-derived tumours. Histopathologic analyses demonstrated that POLR2A-knockdown SNU283 tumours had significantly reduced cell proliferation, but more apoptotic cells, as compared with the corresponding control tumours (Extended Data Fig. 7b, c). By contrast, no significant changes were observed in the control or POLR2A-knockdown HCT116 tumours. However, hemizygous deletion of POLR2A sensitized HCT116-derived tumours to Dox treatment (Extended Data Figure 7d, e). Next, we employed an orthotopic tumour model by injecting POLR2Aneutral and POLR2Aloss HCT116 cells into the cecal wall of NOD/SCID mice. In-vivo tumour imaging demonstrated that Dox-induced POLR2A inhibition led to a significant decrease in tumour growth kinetics in the POLR2Aloss tumours, but not in the control POLR2Aneutral tumours (Fig. 4c–e, and Extended Data Fig. 7f). To further test the efficacy of POLR2A silencing in vivo, we used a nanoliposomal delivery platform, DOPC (1,2-dioleoyl-sn-glycero-3-phosphatidylcholine), for systemic delivery of POLR2A siRNAs23 (Extended Data Fig. 8a, b). Following four weeks of systemic therapy, compared with control siRNA-DOPC treatment, mice in the 125 μg kg−1 of POLR2A siRNA-DOPC treatment groups had pronounced growth reduction of POLR2Aloss tumors, while POLR2Aneutral tumors only had significant growth inhibition even at the dose of 1,000 μg kg−1 (Extended Data Fig. 8c–h).
Figure 4. Suppression of POLR2A selectively inhibits the POLR2Aloss tumour growth.
a, b, Gross tumour images (a) and growth curves (b) of xenograft tumours derived from subcutaneously implanted HCT116 or SNU283 cells expressing control or Dox-inducible POLR2A shRNA. n = 5 mice per group. Error bars, s.e.m. c–e, Tumour growth curves (c, **p < 0.01, error bars, s.e.m.), gross tumour images (d) and weights (e, error bars, s.d.) of xenograft tumours derived from orthotopically implanted POLR2Aneutral and POLR2Aloss HCT116 cells expressing Dox-inducible control or POLR2A shRNA. n = 5 mice per group. f–i, Representative bioluminescent images (f, h)and tumour growth curves (g, i)of orthotopic xenograft tumours derived from POLR2Aneutral and POLR2Aloss HCT116 (f, g) or xhCRC cells (h, i) that received dual intraperitoneal injections of HEA125 antibody or Ama-HEA125 antibody-drug conjugate (3, 10, 30 and 90 μg kg−1). n = 10 mice per group. Error bars, s.e.m.
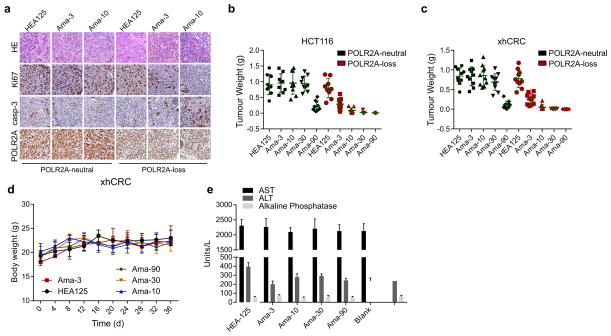
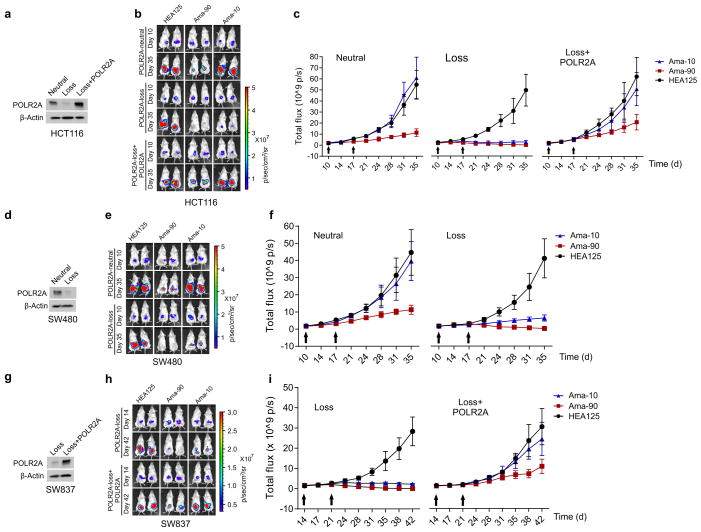
Next, we investigated the anti-tumour activity of Ama-HEA125 in orthotopic tumour models established by isogenic pairs of xhCRC and HCT116 cells (TP53/POLR2Aneutral and TP53/POLR2Aloss) (Fig. 4f–i and Extended Data Fig. 9a–c). In a dose escalation experiment, Ama-HEA125 was administered to the tumour-bearing mice as dual intraperitoneal injections at the dose of 3, 10, 30, or 90 μg with respect to α-Amanitin per kg of mouse body weight. In the mice bearing POLR2Aloss tumours, control HEA125-treated mice showed continuous tumour growth within 25 days after antibody injection. The treatment of Ama-HEA125 showed strong inhibition on tumour growth even at the lowest dose of 3 μg kg−1. All the POLR2Aloss tumours responded to Ama-HEA125 treatment, and tumour volume regressed dramatically (Fig. 4f–i). Complete tumour regression was observed in 10 of 10 (90 μg kg−1), 8 of 10 (30 μg kg−1), and 6 of 10 (10 μg kg−1) mice bearing POLR2Aloss HCT116 tumours 25 days after the first administration of Ama-HEA125 (Fig. 4f, g). By contrast, significant tumour inhibition was observed in the mice bearing POLR2Aneutral tumours only at the highest dose of 90 μg kg−1, but not at the doses of 3–30 μg kg−1. Similar results were observed in the mice bearing xhCRC-derived tumours (Fig. 4h, i). Consistent with our previous study11, treatment of Ama-HEA125 at the tested doses had no notable toxicity in vivo. Analysis of body weights and blood liver enzymes did not reveal any substantial differences between the Ama-HEA125-treated group and control HEA125-treated group (Extended Data Fig. 9d, e), suggesting negligible systemic toxicity of the Ama-HEA125 conjugate. In addition, we also tested the anti-tumour activity of Ama-HEA125 in orthotopic tumours derived from the POLR2Aneutral SW480 cells and the POLR2Aloss SW837 cells (Extended Data Fig. 10). Treatment of Ama-HEA125 at the dose of 10 μg kg−1 was sufficient to inhibit tumour growth in all the POLR2Aloss tumours, while POLR2Aneutral (SW480) or POLR2A-restored (SW837 expressing exogenous POLR2A) tumours were only significantly inhibited by Ama-HEA125 at the dose of 90 μg kg−1.
Much effort has been directed towards restoring p53 activity in human cancer cells3,4,7,24. Instead of pharmacologic intervention of p53 signalling, the principle of collateral vulnerability to POLR2A inhibition provides a novel strategy for cancer therapy. Our preclinical studies with α-Amanitin demonstrate therapeutic efficacy of the strategy for treating CRC. Given that hemizygous loss of TP53 is a frequent genomic event in many human cancers, the therapeutic strategy described herein may have broad applications. While clinical applications of α-Amanitin are limited by its liver toxicity, conjugation of α-Amanitin to antibodies against tumour-specific biomarkers minimizes its systemic toxicity and moreover, increases the efficacy of treatment. The identification of new pharmacologic agents that target POLR2A should significantly impact personalized cancer therapies.
END NOTES
Methods and extended data display items are available in the online version of the paper; references unique to these sections appear only in the online paper.
METHODS
Cell culture, antibodies and Western blot analysis
HCT116, SW480, SW837, HT29, DLD1, and HT29 cell lines were obtained from the American Type Culture Collection and cultured under standard conditions specified by the manufacturer. SNU283 and SNU1197 cell lines were obtained from the Korean Cell Line Bank and cultured in RMPI 1640 medium supplemented with 10% FBS and 2 mmol L−1 L-Glutamine. Isolation, culture and maintenance of xenografted human primary CRC (xhCRC) cells were performed as previously described20. Briefly, patient-derived xenografts were harvested under sterile conditions and mechanically dissociated, followed by 30 min of incubation in collagenase II at 37°C. The specimen was filtered through a sterile 100-μm strainer. Red blood cells were eliminated with a hypo-osmotic red blood cell lysis buffer (eBioscience). Mouse cells in xenografted human CRC specimens were removed by negative selection using a mouse MHC class I molecule H-2K antibody followed by use of a magnetic bead purification kit (Miltenyi). Fibroblasts were removed by negative selection using a MACS magnetic bead separation kit (Miltenyi). The freshly isolated xhCRC cells were maintained on collagen-1-coated culture plates (BD Biosciences) and cultured in MEM supplemented with 10% FBS, vitamins (1×), nonessential amino acids (1×), Pen-Strep (1×), sodium pyruvate (1×), and L-glutamine (1×). All medium supplements were purchased from Sigma.
Anti-POLR2A antibodies were purchased from Santa Cruz (#sc-47701) and Abcam (#ab140509). Anti-Ki67 antibody (#D3B5) and anti-cleaved Caspase-3 (Asp175, #5A1E) antibody were obtained from Cell Signalling. Anti-p53 (#sc-126), anti-β-actin (#sc-1616), HRP-anti-goat IgG (#sc-2020), HRP-anti-rabbit IgG (#sc-2054), and HRP-anti-mouse IgG (#sc-2055) antibodies were purchased from Santa Cruz. Cell lysate preparation, SDS-PAGE and Western blotting were performed as previously described25.
RNA isolation and quantitative PCR
Total RNA was isolated using TRIzol reagent (Life Technologies) and then reverse-transcribed using iScript cDNA Synthesis Kit (Bio-Rad). The resulting cDNA was used for qPCR using iTaq Universal SYBR Green Supermix (Bio-Rad) with gene-specific primers and the results were normalized to β-actin control. In RT-PCR assays, the primer sequences for TP53 are: 5′-GAGGTTGGCTCTGACTGTACC-3′ and 5′-TCCGTCCCAGTAGATTACCAC-3′, and for POLR2A are: 5′-TTGTATCCGTACCCACAGCA-3′and 5′-CATGATCAGCTCCCCATTCT-3′.
shRNA-mediated knockdown of POLR2A
POLR2A-specific shRNA clones were obtained from the MD Anderson shRNA and ORFeome Core Facility (originally from Open Biosystems). Twelve shRNAs targeting POLR2A were screened, of which two shRNAs knocked down protein levels by at least 50% in all four colorectal cancer cell lines tested. Their clone identification numbers and shRNA sequences are V3LHS_645674 (5′-TTAGCTTTGTTCTTCCCGA-3′) and V3LHS_64029 (5′-TGTTGTCCATCTCCTCCCC-3′). The hairpin sequences in the GIPZ vector were cloned into the TRIPZ vector (Dharmacon) using a protocol provided by the manufacturer. The TRIPZ vector is a Dox-inducible system with a red fluorescent protein reporter.
Generation of cells stably expressing Dox-inducible shRNAs
Recombinant lentiviral particles were produced from 293T cells. Briefly, 72 μg of shRNA-encoding vector DNA, 54 μg of Delta 8.9 vector DNA and 18 μg of VSVG-encoding vector DNA were transfected into 293T cells (plated in the 245-mm2 dish) using X-tremeGENE (Roche). Supernatant containing virus particles was collected and filtered 72 h after transfection, concentrated by ultracentrifugation at 90,000g, and resuspended in cell growth medium. To generate stable Dox-inducible cells, HCT116 and SNU283 cells were infected with shRNA-expressing viral particles at the multiplicity of infection (MOI) of 1. Viral solutions were added to cell culture medium containing 4 μg ml−1 polybrene. Cells were selected 48 h after infection by 2 μg ml−1 puromycin. Single colonies were cultured and propagated, and colonies bearing a single copy of lentiviral DNA insert were identified and analysed for knockdown efficiency.
Direct competition assay using POLR2A shRNA
A single lentiviral copy expressing either shRNA-1 or shRNA-2 was sufficient to suppress POLR2A expression levels in all the four colorectal cell lines tested (Extended Data Fig. 3b). Cancer cells were infected with control or POLR2A shRNA-expressing lentiviruses (pGIPZ backbone expressing GFP) at the MOI of 2. Two days after infection, GFP-positive cells were sorted using a BD FACSJazz™ cell sorter (BD Biosciences) at the MD Anderson Flow Cytometry and Cellular Imaging Core. Next, GFP-positive cells were mixed with non-infected and GFP-negative cells at the ratio of 1:1 and cultured for six passages. The numbers of GFP-positive and total cells at each passage were analysed and quantified by flow cytometry and the percentages of GFP-positive cells were calculated.
Generation of sgRNA-expressing vectors and Suveryor assay
Bicistronic expression vector expressing Cas9 and sgRNA was digested with BbsI and treated with alkaline phosphatase, and then the linearized vector was gel purified for cloning sgRNA-encoding DNA26. The pair of oligo DNA for each sgRNA targeting TP53 or POLR2A was annealed, phosphorylated, and ligated to the linearized vector. The sequences of oligo DNA are listed in Supplementary Table 1. Suveryor assay was performed to test the genome editing efficacy as previously described27,28. Briefly, cells were seeded into six-well plates at a density of 2×10⁵ cells per well. One day after initial seeding, cells were transfected with 2 μg of Cas9/sgRNA-expressing vector DNA and harvested 48 h after transfection. Genomic DNA was isolated and a 1kb DNA fragment containing the sgRNA-targeting site was amplified by high-fidelity PCR and digested by T7 endonuclease I. Genomic DNA isolated from HCT116 cells transfected with control vector DNA was used as control. To allow complementary but mismatched strands to anneal, PCR products were incubated at 95 °C for 5 min, 95 °C to 85 °C at the rate of −2 °C s−1 and 85 °C to 25 °C at the rate of −0.1 °C s−1. T7 endonuclease I was added and samples were incubated at 37 °C for 60 min to digest the annealed PCR products at the mismatch sites. T7 endonuclease I-digested PCR products were analysed by agarose gel electrophoresis. Oligonucleotide sequences used for PCR amplification are listed in Supplementary Table 1. The PCR products from positive clones were ligated to pGEM-T Easy Vector (Promega) and further confirmed by DNA sequencing.
Cell proliferation and survival assay
Equal numbers of cells were plated in 12-well plates in triplicate. Cells were fixed with 10% methanol and stained with 0.1% crystal violet (dissolved in 10% methanol) at indicated times. After staining, wells were washed three times with PBS and destained with acetic acid. The absorbance of the crystal violet solution was measured at 590 nm. For cell survival assay, cells were seeded at a concentration of 1,000 cells per well in 96-well plates and treated with indicated concentrations of α-Amanitin or actinomycin D 24 hours later. Cell viability was quantified using WST-1 reagent (Roche) according to the manufacturer’s instructions. All experiments were performed in triplicate.
Apoptosis and cell cycle analysis
The HCT116 and SNU283 cell lines were treated with or without α-Amanitin for 2d or doxycycline for 4d at indicated concentrations and stained with annexin V-PE and 7-AAD (Biovision). Apoptosis was analysed by flow cytometry using a Guava EasyCyte Flow Cytometer (Millipore) according to the manufacturer’s protocol. Both pre-apoptotic (annexin V-positive and 7-AAD-negative) and apoptotic (annexin V-positive and 7-AAD-positive) cells were included in the analyses. For cell cycle analysis, cells were fixed in 75% ethanol at −20 °C overnight. The cells were washed with cold PBS, treated with 100 μg of RNase A (Qiagen), and stained with 50 μg of propidium iodide (Roche). Cell cycle profiles were analysed by flow cytometry using the Guava EasyCyte Flow Cytometer (Millipore).
Fluorescence in situ hybridization (FISH)
FISH analysis was performed using Fluorescein-labelled POLR2A (red) and control centromere (Chr 17, green) probes from Empire Genomics. Hybridization and detection were performed according to the manufacturer’s protocols. The slides were counterstained with DAPI, and the images were captured using a Nikon E800 microscope equipped with a cooled-charge coupled device (CCD) camera. To determine hemizygous loss of the POLR2A gene, 100 individual nuclei were analysed for each case. The interphase nuclei were captured and processed using the Quantitative Image Processing System (Applied Imaging).
Patient samples
Matched normal and colorectal tumour tissue samples from patients were obtained from the MD Anderson Cancer Center (MDACC) through appropriate informed consents after approval by the institutional review board (IRB# PA11-0767). To determine the expression levels of POLR2A protein, tissue samples (20–40 mg) were placed in tubes containing ceramic beads and were homogenized using a Precellys 24 homogenizer device (Bertin Technologies). The lysates were spun-down twice (15 min, 16,000 g) and the supernatant was collected.
Genomic DNA isolation and copy number validation
Total genomic DNA was extracted from human tissue specimens and cell lines using DNeasy Blood & Tissue Kit (Qiagen) according to the manufacturer’s purification instructions. All the DNA samples were stored at −20°C. The copy number variations for POLR2A were determined using TaqMan probes (Hs02023849_cn and Hs01252684_cn) and standard TaqMan PCR kit on an Applied Biosystems 7900HT Sequence Detection System. And the reference gene TERT was simultaneously quantified in the same reaction for each DNA sample.
Conjugation of α-Amanitin to anti-EpCAM antibody (HEA125)
Antibody-drug conjugate ama-HEA125 was constructed by coupling of α-Amanitin to lysine residues of HEA125 antibody by a stable linker structure. HEA125 binds to EpCAM-expressing cells with high affinity (Kd ~ 2.2 × 10⁻⁹ mol L−1) and high specificity. HEA125 was purified by affinity chromatography using a protein A-Sepharose CL-4B column (GE Healthcare). α-Amanitin was attached to immunoglobulin molecules by a plasma stable urea linkage intended to release free α-Amanitin inside the tumour cell after lysosomal degradation of the antibody moiety. The drug-antibody ratio (DAR) of the α-Amanitin:IgG molecule was 4:1. Biochemical characteristics of ama-HEA125 were evaluated by high performance liquid chromatography (HPLC) using a PlatinBlue HPLC system (Knauer). In addition, HEA125 and ama-HEA125 were analysed by reducing SDS-PAGE and Coomassie staining according to common procedures. Verification of drug-loading was done by anti-amanitin immunoblotting analysis of 30 ng HEA125 and ama-HEA125 using standard techniques.
Liposomal nanoparticle preparation
siRNAs for in vivo delivery were encapsulated into DOPC (1,2-dioleoyl-sn-glycero-3-phosphatidylcholine). DOPC and siRNA were mixed in the presence of excess tertiary butanol at a ratio of 1:10 (w/w) siRNA/DOPC. Tween 20 was added to the mixture in a ratio of 1:19 Tween 20:siRNA/DOPC. The mixture was vortexed, frozen in an acetone/dry ice bath, and lyophilized. Prior to in vivo administration, this preparation was hydrated with PBS at room temperature at a concentration of 150–1,000 μg siRNA/kg per injection (each mouse received 200 μL of DOPC:siRNA:PBS solution by the intraperitoneal route).
Xenograft tumour studies
Four- to six-week-old female NOD/SCID mice were purchased from Jackson Laboratories and housed under pathogen-free conditions. All studies were approved and supervised by the Institutional Animal Care and Use Committee of MD Anderson Cancer Center. When used in a power calculation, our sample size predetermination experiments indicated that 5 mice per group can identify the expected effect of POLR2A on tumour size and weight (p < 0.05) with 90% power. Animals were randomly divided to different groups. Dox-inducible HCT116 (1 × 10⁶) and SNU283 (2 × 10⁶) cells in 50 μl growth medium (mixed with Matrigel at 1:1) were injected subcutaneously into the flank using a 100-μl Hamilton microliter syringe. Tumour size was measured every five days using a calliper, and tumour volume was calculated using the standard formula: 0.5 × L × W2, where L is the longest diameter and W is the shortest diameter. For orthotopic mouse model, the NOD/SCID mice were anaesthetized and the skin was incised to expose cecum. Dox-inducible HCT116 cells (1 × 10⁶) expressing luciferase were injected into the cecal wall using a 100-μl Hamilton microliter syringe, and then the incision was closed using wound clips. Tumours were monitored by the IVIS system after luciferin injection for 15 min. After initial establishment of tumour (100 mm3 for subcutaneous implants and 2 × 10⁸ photons/second, total flux for orthotopic implants), mice were treated with 1μg ml−1 doxycycline in drinking water for 3 to 4 weeks. The doxycycline water was changed every other day.
For xenograft tumour studies using DOPC-encapsulated siRNAs, isogenic pairs of HCT116 (1 × 10⁶) cells were transplanted into the cecal wall using a 100-μl Hamilton microliter syringe. Ten days following cell injection, mice were randomly divided and assigned to receive either control siRNA-DOPC or POLR2A siRNA-DOPC. The siRNA sequences are as follows: control siRNA (5′-UUCUCCGAACGUGUCACGU-3′ and 5′-ACGUGACACGUUCGGAGAA-3′); POL2 siRNA-1 (5′-CCAACAUGCUGACAGAUAU-3′ and 5′-AUAUCUGUCAGCAUGUUGG-3′); POL2 siRNA-2 (5′-CCAAGAAGCGGCUCACACA-3′ and 5′-UGUGUGAGCCGCUUCUUGG-3′). A dose of 150 to 1,000 μg siRNA/kg mouse was administrated intraperitoneally at twice weekly intervals. This range of concentrations was determined by the Center for RNA Interference and Noncoding RNAs at MD Anderson Cancer Center, which ensures efficient delivery and knockdown of target genes as previously described23.
For xenograft tumour studies using α-Amanitin-HEA125 antibody-drug conjugate (ADC), isogenic pairs of HCT116 (1 × 10⁶), xhCRC (0.5 × 10⁶), SW480 (1 × 10⁶) or SW837 (2 × 10⁶) cells were transplanted into the cecal wall using a 100-μl Hamilton microliter syringe. Mice bearing 10-day-old tumors were randomized to five groups (n = 10 mice/group) and received two intraperitoneal doses (at 10 d and 17 d, 1 week apart) of the following: 1) control unconjugated HEA125 mAb at a dose of 3.6 mg kg−1 of body weight; 2) Ama-HEA125 at a dose of 90 μg kg−1 in terms of α-Amanitin (corresponding to 3.6 mg kg−1 of IgG); 3) Ama-HEA125, 30 μg kg−1 in terms of α-Amanitin (corresponding to 1.2 mg kg−1 of IgG); 4) Ama-HE125, 10 μg kg−1 in terms of α-Amanitin (corresponding to 0.4 mg kg−1 of IgG); and 5) Ama-HEA125, 3 μg kg−1 in terms of α-Amanitin (corresponding to 0.12 mg kg−1 of IgG). Tumours were monitored by the IVIS live imaging system twice a week after luciferin injection for 15 min. Body weights were recorded every four days. Blood was obtained by retro-orbital bleeding after anaesthesia on day 21 and levels of blood liver enzymes (AST: aspartate amino transferase, ALT: amino alanine transferase and alkaline phosphatase) were determined at the Clinical Pathology, Veterinary Medicine and Surgery Core of MD Anderson Cancer Center.
Mice were euthanized when they met the institutional euthanasia criteria for tumour size and overall health condition. Tumours were removed, photographed and weighed. The freshly dissected tumour tissues were fixed in 10% buffered formalin overnight, washed with PBS, transferred to 70% ethanol, embedded in paraffin, sectioned and stained with haematoxylin and eosin. The investigators were blinded to the group allocation during the experiment and when assessing the outcome.
Immunohistochemistry and human colon tissue microarray
Colon cancer tissue microarray (BC051110a) was purchased from Biomax, including 110 colon tumour samples and 10 nomral colon tissue samples. Samples were deparaffinized and rehydrated. Antigen was retrieved using 0.01 M sodium-citrate buffer (pH 6.0) at a sub-boiling temperature for 10 min after boiling in a microwave oven. To block endogenous peroxidase activity, the sections were incubated with 3% hydrogen peroxide for 10 min. After 1 h of pre-incubation in 5% normal goat serum to prevent nonspecific staining, the samples were incubated with antibody against POLR2A (#sc-47701, Santa Cruz), Ki67, (#D3B5, Cell Signaling), or cleaved Caspase-3 (#5A1E, Cell Signaling) at 4 °C overnight. The sections were incubated with a biotinylated secondary antibody (4Plus Biotinylated anti-mouse or anti-rabbit IgG, BioCARE) and then incubated with avidin–biotin peroxidase complex solution and developed using a DAB (diaminobenzidine) Substrate Kit (#550880, BD Biosciences) according to the manufacturer’s protocol. Counterstaining colour was carried out using Harris modified haematoxylin. All immunostained slides were scanned on the Automate Cellular Image System III (ACIS III) for quantification by digital image analysis.
Bioinformatic analysis
We analysed the correlation between gene copy number and the corresponding gene expression using data obtained from CCLE (www.broadinstitute.org/ccle) and TCGA (http://www.cbioportal.org/public-portal/) as previously described13. Enrichment of Pearson correlation coefficients was determined by permuting gene names. To determine whether a deleted gene functions as a housekeeping gene, we first analysed its expression profiles in tumour and normal tissues as well as its general functions from literature. Second, we checked gene conservation across species and lethality of the gene knockout by searching available databases of model organisms (Saccharomyces Genome Database, WormBase, FlyBase, and Mouse Genome Informatics). Third, we checked the proximity of the potential target gene to the TP53 gene and analysed its co-deletion with TP53 in human cancers. Finally, we searched for available cancer cell lines with the deletion of TP53 and the target gene to test our hypothesis.
Statistical analysis
Each experiment was repeated three times or more. Unless otherwise noted, data are presented as mean and s.d. or s.e.m., and Student’s t-test (unpaired, two-tailed) was used to compare two groups of independent samples. In an unpaired t-test, we assumed equal variance and no samples were excluded from the analysis. Statistical methods used for TCGA data analysis are described above. p < 0.05 was considered statistically significant.
Extended Data
Extended Data Figure 1. Expression of POLR2A correlates with its gene copy number in human colon tumours.
a, Upper row: double-colour FISH analysis using a probe for chromosome 17 centromere (green) and locus-specific probe for POLR2A (red) on human colon tissue microarray. Bottom row: Immunohistochemical staining of POLR2A in the corresponding tissue samples. Hemizygous loss of the POLR2A gene was determined and the results are shown in Supplementary Table 2. b, Quantification of POLR2A expression in human colon normal (n = 7), POLR2A-neutral (n = 43)or -loss (n = 29) tumour tissue samples. Error bars, s.d. c, Protein levels of POLR2A and β-Actin in matched normal and CRC tissue samples.
Extended Data Figure 2. Expression of TP53 is not associated with its gene copy number.
a, b, Scatterplots of TP53 copy number versus protein expression (a) or mRNA expression (b) in colorectal tumours in TCGA database. Pearson correlation coefficient (r) and p value are displayed. c, Relative mRNA expression of TP53 in human CRC cell lines (normalized to that in HCT116 cell line). Data are mean and s.d. of three independent experiments.
Extended Data Figure 3. POLR2Aloss cells are highly sensitive to POLR2A inhibition.
a, Cell proliferation of POLR2Aneutral and POLR2Aloss cells treated with actinomycin D. b, Knockdown efficiency of POLR2A-specific shRNAs in HCT116, SW480, SW837 and SNU283 cells. c, Effect of POLR2A knockdown on the proliferation of four colorectal cancer cell lines. Cells expressing GFP and control or POLR2A-specific shRNAs were sorted and mixed with control GFP-negative cells (1:1) and the GFP positive cells were quantified at passage 2, 4 and 6. **p < 0.01, ns: not significant. d, Protein levels of POLR2A in HCT116 and SNU283 cells expressing Dox-inducible POLR2A shRNAs (1.0 μg ml−1 Dox). e, Cell proliferation of HCT116 and SNU283 cells expressing Dox-inducible POLR2A shRNA in the presence of 300 ng ml−1 Dox. **p < 0.01. f, g, Cell cycle profiles (f) and apoptosis (g) of control or POLR2A shRNA-expressing HCT116 and SNU283 cells. ** p < 0.01. Data are mean and s.d. of three independent experiments in the figure.
Extended Data Figure 4. Ectopic expression of POLR2A restores the resistance of POLR2Aloss cells to α-Amanitin treatment.

a, Protein levels of POLR2A in SNU283 and SW837 cells expressing increasing amounts of exogenous POLR2A. b, Crystal violet staining of SNU283 and SW837 cells treated with α-Amanitin after transfection with increasing amounts of POLR2A expression vector DNA.
Extended Data Figure 5. Mono-allelic knockout of POLR2A sensitizes HCT116 cells to POLR2A inhibition.
a, Schematic illustration of the Cas9/sgRNA-targeting sites in the POLR2A gene. Two single-guide RNA(sgRNA)-targeting sequences are shown and the protospacer-adjacent motif (PAM) sequences are highlighted in red. b, Efficiency of the Cas9-mediated cleavage of POLR2A in HCT116 cells measured by the Surveyor assay. c, Sequences of mutant POLR2A alleles in the cell colonies #14 and #5. PAM sequences are highlighted in red. Small deletions in the targeted region led to open reading frame shift, producing only a short stretch of the N-terminal peptide without any functional domains of POLR2A. d, Protein levels of POLR2A in POLR2Aneutral and POLR2Aloss HCT116 cells. e, Growth curves of POLR2Aneutral and POLR2Aloss HCT116 cells. f, Relative proliferation of POLR2Aneutral and POLR2Aloss cells treated with actinomycin D. g, Effect of POLR2A knockdown on the POLR2Aneutral and POLR2Aloss HCT116 cells. Experiments were performed as described in Extended Data Fig. 3c. **p < 0.01, ns: not significant. h, Dox-induced partial suppression of POLR2A inhibited the growth of POLR2Aloss HCT116 cells, but not of parental POLR2Aneutral HCT116 cells. Data are mean and s.d. of three independent experiments in the figure.
Extended Data Figure 6. Sensitivity of POLR2Aloss cells to POLR2A inhibition is independent of p53.
a, Schematic illustration of the Cas9/sgRNA-targeting sites in the TP53 gene. Two sgRNA-targeting sequences are shown and the PAM sequences are highlighted in red. b, Efficiency of the Cas9-mediated cleavage of TP53 in HCT116 cells measured by Surveyor assay. c, Protein levels of POLR2A and p53 in a panel of isogenic HCT116 cells. d, Growth curves of POLR2Aneutral and POLR2Aloss xhCRC cells. e, Growth curves of POLR2Aneutral and POLR2Aloss HCT116 cells. f, g, Crystal staining images (f) and cell survival curves (g) of POLR2Aneutral and POLR2Aloss HCT116 cells treated with α-Amanitin. h, Cell survival curves of POLR2Aneutral and POLR2Aloss HCT116 cells in response to the treatment of Ama-HEA125. Data are mean and s.d. of three independent experiments in the figure.
Extended Data Figure 7. Dose-dependent suppression of POLR2A inhibits tumorigenesis in POLR2Aloss, but not POLR2Aneutral tumours.
a, Quantification of POLR2A mRNA expression levels in subcutaneously xenografted HCT116 and SNU283 tumours expressing control or POLR2A shRNA (n = 5 mice per group). ** p < 0.01. Data are mean and s.d. b, Immunohistochemical staining of the aforementioned xenograft tumours. HE: haematoxylin and eosin. c, Cells positive for Ki67 (cell proliferation) or cleaved caspase-3 (apoptosis) per field and POLR2A expression in (b) were quantified. ** p < 0.01. n = 10 fields. Data are mean and s.d. d, Gross tumour images of xenograft tumours derived from subcutaneously implanted POLR2Aneutral and POLR2Aloss HCT116 cells (1 × 10⁶ cells injected). Both cell lines express control or Dox-inducible POLR2A shRNAs. After the initial establishment of tumours (100 mm3), mice were treated with (0.5, 1 and 2 μg ml−1) Dox in drinking water. n = 5 mice per group. e, Quantification of tumour sizes as shown in (d). Data are mean and s.d. f, Representative bioluminescent images of orthotopically implanted HCT116 tumours expressing Dox-inducible control or POLR2A shRNA following Dox treatment.
Extended Data Figure 8. Suppression of POLR2A with DOPC-encapsulated POLR2A siRNA inhibits the growth of POLR2Aloss tumours.
a, Protein levels of POLR2A following transfection of control siRNA or POLR2A siRNAs (#1 and #2) in HCT116 cells. b, Schematic illustration of orthotopic injection of HCT116 cells (1 × 10⁶ cells) followed by siRNA-DOPC nanoliposome treatment. c–f, Representative bioluminescent images (c, e) and tumour growth curves (d, f) of orthotopic xenograft tumours derived from POLR2Aneutral and POLR2Aloss HCT116 cells that received intraperitoneal injections of control (1,000μg kg−1) or POLR2A siRNAs (125, 250, 500 and 1,000 μg kg−1) twice weekly. n = 10 mice per group. Error bars, s.e.m. (g, h) Representative protein levels of POLR2A in xenograft tumours following control or POLR2A siRNA treatment.
Extended Data Figure 9. Suppression of POLR2A selectively inhibits the POLR2Aloss tumour growth.
a, Immunohistochemical staining of xenografted xhCRC tumours. HE: haematoxylin and eosin. b, c, Tumour weights of orthotopically implanted HCT116 (b) and xhCRC (c) tumours. n = 10 mice per group. Data are mean and s.d. d, e, Body weights (d) and liver enzymes (e) including alanine aminotransferase (ALT), aspartate aminotransferase (AST) and alkaline phosphatase in peripheral blood. Data are mean and s.d. n = 5 mice.
Extended Data Figure 10. Suppression of POLR2A by Ama-HEA125 inhibits the growth of POLR2Aloss tumours.
a, d, g Protein levels of POLR2A in HCT116 (a), SW480 (d), or SW837 (g) cells. These cell lines are POLR2A-neutral, POLR2A-loss, or POLR2A-restored. b–c, e–f, h–i, Representative bioluminescent images (b, e, h) and tumour growth curves (c, f, i) of orthotopic xenograft tumours derived from the corresponding cells as indicated. All of them received dual intraperitoneal injections of anti-EpCAM antibody (3.6 mg kg−1) or Ama-HEA125 antibody-drug conjugate (10 and 90 μg kg−1, corresponding to 0.4 and 3.6 mg IgG kg−1). n = 10 mice per group. Error bars, s.e.m.
Supplementary Material
Acknowledgments
We thank F. Zhang and I.J. Fidler for technical support in orthotopic tumour experiments. We thank L. Huang and M. Bar-Eli for lentivirus production. This work was supported by grants to X.L. (NIH R01 CA136549, MD Anderson Moon Shots Program) and to A.K.S (NIH U54 CA151668).
Footnotes
Author Contributions
Y.L., X.Z., and X.L. directed the work and wrote the manuscript. C.H. and G.W. generated vectors and performed cell-based assays. X.H. provided technical guidance on CRISPR/Cas9 and gene knockout experiments. D.M.M. provided clinical tissue samples and technical guidance. J.D., C.R., and G.L. produced siRNA-DOPC. P.H.R. carried out FISH experiments. J.A. and A.P. provided α-Amanitin-conjugated antibodies and technical guidance in xenograft tumour experiments. L.M.E., X.H., C.I., and A.K.S. helped to analyse data. All authors discussed the results and contributed to the manuscript.
J. Anderl and A. Pahl are employees of Heidelberg Pharma GmbH. The other authors declare no conflict of interest.
References
- 1.Petitjean A, et al. Impact of mutant p53 functional properties on TP53 mutation patterns and tumor phenotype: lessons from recent developments in the IARC TP53 database. Hum Mutat. 2007;28(6):622–629. doi: 10.1002/humu.20495. [DOI] [PubMed] [Google Scholar]
- 2.Vazquez A, et al. The genetics of the p53 pathway, apoptosis and cancer therapy. Nat Rev Drug Discov. 2008;7(12):979–987. doi: 10.1038/nrd2656. [DOI] [PubMed] [Google Scholar]
- 3.Cheok CF, et al. Translating p53 into the clinic. Nat Rev Clin Oncol. 2011;8(1):25–37. doi: 10.1038/nrclinonc.2010.174. [DOI] [PubMed] [Google Scholar]
- 4.Lane DP, Cheok CF, Lain S. p53-based cancer therapy. Cold Spring Harb Perspect Biol. 2010;2(9):a001222. doi: 10.1101/cshperspect.a001222. [DOI] [PMC free article] [PubMed] [Google Scholar]
- 5.Chene P. Inhibiting the p53-MDM2 interaction: an important target for cancer therapy. Nat Rev Cancer. 2003;3(2):102–109. doi: 10.1038/nrc991. [DOI] [PubMed] [Google Scholar]
- 6.Wade M, Li YC, Wahl GM. MDM2, MDMX and p53 in oncogenesis and cancer therapy. Nat Rev Cancer. 2013;13(2):83–96. doi: 10.1038/nrc3430. [DOI] [PMC free article] [PubMed] [Google Scholar]
- 7.Haupt S, Haupt Y. Manipulation of the tumor suppressor p53 for potentiating cancer therapy. Semin Cancer Biol. 2004;14(4):244–252. doi: 10.1016/j.semcancer.2004.04.003. [DOI] [PubMed] [Google Scholar]
- 8.Bensaude O. Inhibiting eukaryotic transcription: Which compound to choose? How to evaluate its activity? Transcription. 2011;2(3):103–108. doi: 10.4161/trns.2.3.16172. [DOI] [PMC free article] [PubMed] [Google Scholar]
- 9.Lindell TJ, et al. Specific inhibition of nuclear RNA polymerase II by alpha-amanitin. Science. 1970;170(3956):447–449. doi: 10.1126/science.170.3956.447. [DOI] [PubMed] [Google Scholar]
- 10.Letschert K, et al. Molecular characterization and inhibition of amanitin uptake into human hepatocytes. Toxicol Sci. 2006;91(1):140–149. doi: 10.1093/toxsci/kfj141. [DOI] [PubMed] [Google Scholar]
- 11.Moldenhauer G, et al. Therapeutic potential of amanitin-conjugated anti-epithelial cell adhesion molecule monoclonal antibody against pancreatic carcinoma. J Natl Cancer Inst. 2012;104(8):622–634. doi: 10.1093/jnci/djs140. [DOI] [PubMed] [Google Scholar]
- 12.Negrini S, Gorgoulis VG, Halazonetis TD. Genomic instability--an evolving hallmark of cancer. Nat Rev Mol Cell Biol. 2010;11(3):220–228. doi: 10.1038/nrm2858. [DOI] [PubMed] [Google Scholar]
- 13.Nijhawan D, et al. Cancer vulnerabilities unveiled by genomic loss. Cell. 2012;150(4):842–854. doi: 10.1016/j.cell.2012.07.023. [DOI] [PMC free article] [PubMed] [Google Scholar]
- 14.Muller FL, et al. Passenger deletions generate therapeutic vulnerabilities in cancer. Nature. 2012;488(7411):337–342. doi: 10.1038/nature11331. [DOI] [PMC free article] [PubMed] [Google Scholar]
- 15.Shalem O, et al. Genome-scale CRISPR-Cas9 knockout screening in human cells. Science. 2014;343(6166):84–87. doi: 10.1126/science.1247005. [DOI] [PMC free article] [PubMed] [Google Scholar]
- 16.Toledo F, Wahl GM. Regulating the p53 pathway: in vitro hypotheses, in vivo veritas. Nat Rev Cancer. 2006;6(12):909–923. doi: 10.1038/nrc2012. [DOI] [PubMed] [Google Scholar]
- 17.Wang T, et al. Genetic screens in human cells using the CRISPR-Cas9 system. Science. 2014;343(6166):80–84. doi: 10.1126/science.1246981. [DOI] [PMC free article] [PubMed] [Google Scholar]
- 18.Wang H, et al. One-step generation of mice carrying mutations in multiple genes by CRISPR/Cas-mediated genome engineering. Cell. 2013;153(4):910–918. doi: 10.1016/j.cell.2013.04.025. [DOI] [PMC free article] [PubMed] [Google Scholar]
- 19.Derheimer FA, et al. RPA and ATR link transcriptional stress to p53. Proc Natl Acad Sci U S A. 2007;104(31):12778–12783. doi: 10.1073/pnas.0705317104. [DOI] [PMC free article] [PubMed] [Google Scholar]
- 20.Lu J, et al. Endothelial cells promote the colorectal cancer stem cell phenotype through a soluble form of Jagged-1. Cancer Cell. 2013;23(2):171–185. doi: 10.1016/j.ccr.2012.12.021. [DOI] [PMC free article] [PubMed] [Google Scholar]
- 21.Faulstich H, Fiume L. Protein conjugates of fungal toxins. Methods Enzymol. 1985;112:225–237. doi: 10.1016/s0076-6879(85)12019-7. [DOI] [PubMed] [Google Scholar]
- 22.Went PT, et al. Frequent EpCam protein expression in human carcinomas. Hum Pathol. 2004;35(1):122–128. doi: 10.1016/j.humpath.2003.08.026. [DOI] [PubMed] [Google Scholar]
- 23.Pecot CV, et al. Therapeutic Silencing of KRAS Using Systemically Delivered siRNAs. Mol Cancer Ther. 2014;13(12):2876–2885. doi: 10.1158/1535-7163.MCT-14-0074. [DOI] [PMC free article] [PubMed] [Google Scholar]
- 24.Goldstein I, et al. Understanding wild-type and mutant p53 activities in human cancer: new landmarks on the way to targeted therapies. Cancer Gene Ther. 2011;18(1):2–11. doi: 10.1038/cgt.2010.63. [DOI] [PubMed] [Google Scholar]
- 25.Liu Y, et al. Kaposi’s sarcoma-associated herpesvirus-encoded microRNA miR-K12-11 attenuates transforming growth factor beta signaling through suppression of SMAD5. J Virol. 2012;86(3):1372–1381. doi: 10.1128/JVI.06245-11. [DOI] [PMC free article] [PubMed] [Google Scholar]
- 26.Cong L, et al. Multiplex genome engineering using CRISPR/Cas systems. Science. 2013;339(6121):819–823. doi: 10.1126/science.1231143. [DOI] [PMC free article] [PubMed] [Google Scholar]
- 27.Guschin DY, et al. A rapid and general assay for monitoring endogenous gene modification. Methods Mol Biol. 2010;649:247–256. doi: 10.1007/978-1-60761-753-2_15. [DOI] [PubMed] [Google Scholar]
- 28.Ran FA, et al. Genome engineering using the CRISPR-Cas9 system. Nat Protoc. 2013;8(11):2281–2308. doi: 10.1038/nprot.2013.143. [DOI] [PMC free article] [PubMed] [Google Scholar]
Associated Data
This section collects any data citations, data availability statements, or supplementary materials included in this article.


