Abstract
A method was developed for generating crimped features in uniaxially aligned electrospun nanofibers to mimic the anatomic structure of collagen fibrils in tendon tissues. We demonstrated that nanofibers comprised of poly(lactic acid) (PLA) and its copolymers or blends would shrink to generate crimped features along the fiber axis when the sample was treated with ethanol. The degree of crimping could be readily controlled by pre-setting the extent of shrinkage allowed for the fibers. As indicated by results from both Raman spectroscopy and differential scanning calorimetry, the crimping was a result of the energy released from the residual stress contained in the electrospun nanofibers. Tensile testing indicates that the crimped nanofibers had a non-linear stiffening behavior with increasing strain, resembling the mechanical behavior of native tendon. In addition, the crimped nanofibers were able to provide better protection to the attached tendon fibroblasts under uniaxial strains when compared to their straight counterparts. Taken together, the crimped nanofibers present a promising new platform for tendon tissue engineering.
Keywords: crimping, plasticizer, electrospun nanofibers, tendon tissue engineering, scaffold
Tendon is a highly anisotropic tissue in which collagen fibrils are assembled into parallel bundles and aligned along the long axis of muscle loading.[1] This anatomic structure serves to transmit energy effectively.[2] The collagen fibrils also contain a characteristic crimp structure to facilitate non-linear stiffening of the tissue under increasing tensile strains.[3] The fibrils with a crimping morphology is capable of absorbing more strain than their straight counterparts and consequently serves to buffer mechanical loads generated by the attached muscles or bones. Furthermore, the spring-like behavior of a crimp structure can protect the muscle from tearing during contraction.[4] Like many other types of tissues, tendons do not regenerate after injury,[5] so there is a major effort in developing scaffolds capable of enhancing the healing process.[6–9] Although great progress has been made toward the fabrication of scaffolds that match the strength and stiffness of native tendons, there is little advancement in reproducing their non-linear stiffening behavior, which is mainly derived from the crimp structure of the collagen fibrils.
Electrospinning is a simple and versatile technique that has been actively explored to produce nanofibers with thickness comparable to that of the collagen fibrils in tendons.[10–14] Moreover, electrospun nanofibers can be readily collected as uniaxially aligned arrays to mimic the highly anisotropic structure of a tendon tissue.[15,16] As such, aligned nanofibers have been extensively exploited as a platform of scaffolding materials for tendon tissue engineering. The inclusion of a crimp structure in the aligned electrospun nanofibers would greatly augment tendon repair and possibly accelerate tendon healing. To this end, several methods have recently been developed for generating electrospun nanofibers with a crimp morphology.[17–21] For example, Yang et al. found that electrospun nanofibers would develop a wavy structure when a magnetic collector was used and the flow rate of the solution was sufficiently high.[17] Amsden et al. demonstrated that electrospun nanofibers could be induced to crimp when they were released from a collector at a temperature higher than the polymer’s glass-transition temperature (Tg).[18,19] Lin et al. electrospun two solutions containing different polymers from a side-by-side spinneret to generate bi-component nanofibers.[20] When the fibers were relatively thick, they tended to develop a wavy morphology due to uneven stretching of the two polymers during electrospinning. Tonin et al. obtained nanofibers with a crimp feature by manipulating the trajectory of electrospun fibers with tangential air flow fed from the top of a cylinder placed between the spinneret and the collector.[21] Although these methods have been used to generate crimped nanofibers for various applications, it is difficult to control the degree of crimping and thus realize the full potential of electrospun nanofibers for tendon repair.
Here we report a simple and versatile method for generating electrospun nanofibers with controllable degrees of crimping by exploiting the interaction between the polymer and a plasticizer. Specifically, ethanol was used as a plasticizer to treat electrospun nanofibers and thus induce the formation of a crimp structure along each nanofiber. In one example, we focused on poly(lactic acid) (PLA), a material that has been approved by the FDA for tissue engineering applications because of its excellent biocompatibility and inherent biodegradability.[22] The PLA nanofibers were collected as uniaxially aligned arrays to mimic the highly anisotropic structure of tendon tissues.[1] During electrospinning, the nanofibers were stretched by a combination of several forces, including the electrostatic force exerted by the external electric field and the repulsion force among the charges accumulated on the surface of each fiber. These forces led to the elongation of polymer chains along the long axis of each fiber and thus the generation of a significant residual stress within the fiber.[23,24] Upon contact with a plasticizer such as ethanol, the polymer chains are forced to release the residual stress and return to a conformation in lower energy, leading to the generation of a crimp structure along the fiber.
In a typical experiment, we electrospun PLA onto a rotating mandrel to obtain a mat of uniaxially aligned nanofibers. The mat was then cut into strips with dimensions 5×1 cm2, with the fibers aligned along the long axis of the strip (see the illustration in Fig. 1). The initial length of the strips was defined as “L0”. Prior to ethanol treatment, the two edges perpendicular to the alignment were fixed onto a solid support at different separations denoted by “L”. When L was set to be the same as L0, the strip maintained its initial length during ethanol treatment. In contrast, when L was set to be shorter than L0, the nanofibers were initially in a loose state and crimping would be observed along each fiber after ethanol treatment. The crimping of nanofibers forced the strip to shrink along its long axis (Video S1). The degree of crimping could be readily controlled by varying the magnitude of shrinkage pre-assigned to the strip (i.e., the L/Lo ratio).
Figure 1.
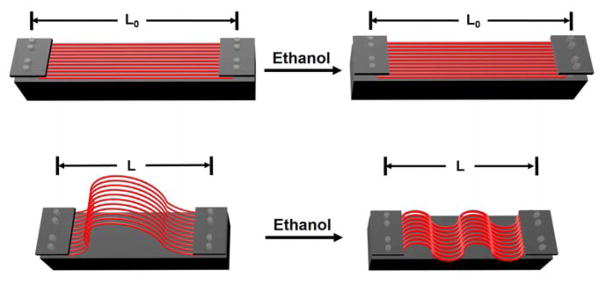
A schematic illustration of the procedure for generating nanofibers with controllable degrees of crimping. The initial length of the strip was defined as L0 while the distance between the two ends after ethanol treatment was denoted as L. For L=L0, the strips were treated with the two ends fixed at a distance equal to the original length. When L<L0, the strip initially at slack would shrink to a length of L during ethanol treatment.
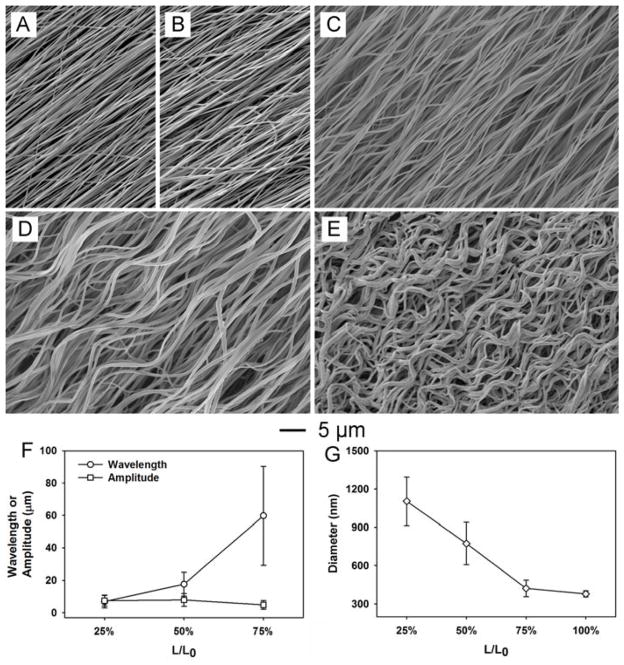
Figure 2A shows a scanning electron microscopy (SEM) image of the pristine PLA nanofibers. Figure 2, B–E, shows SEM images of the same batch of samples after treatment with ethanol at L/L0=100%, 75%, 50%, and 25%, respectively. The sample obtained at L/L0=100% showed no crimping whereas the sample obtained at L/L0=25% exhibited a substantial degree of crimping. A decrease in wavelength (i.e., an increase in the degree of crimping) was observed with decrease in L/L0. For the PLA nanofibers, a maximum shrinkage to ca. 10% of its initial length could be achieved when treated with ethanol. In Figure 2, F and G, the wavelength and amplitude of the crimped fibers are plotted as a function of L/L0. Depending on the value of L/L0, the wavelengths of the crimped fibers could dropped from ca. 100 μm to ca. 10 μm while the amplitudes remained roughly the same in the range of 3–10 μm. The thickness of the fibers also increased as the degree of crimping was increased. As shown in Figure 2G, the diameter of the fibers increased from ca. 350 nm for the pristine sample to over 1 μm after the ethanol treatment at L/L0=25%. This observation supports our initial hypothesis that the crimping was a result of retraction for the elongated polymer chains in each fiber.
Figure 2.
SEM images showing (A) the pristine PLA nanofibers, (B–E) the same batch of PLA nanofibers after treating with ethanol at L/L0= (B) 100%, (C) 75%, (D) 50%, and (E) 25%. The degree of crimping was found to depend on the value of L/L0. (F) Plot showing the relationship between wavelength/amplitude of the crimps and L/L0. The wavelength showed a positively correlation with the value of L/L0 while the amplitude of the crimp remained essentially the same. (G) Plot showing the relationship between the diameter of crimped fibers and L/L0. The diameter was negatively correlated with the value of L/L0. Roughly one hundred fibers were randomly selected from each sample for analysis, and the data are presented as mean ± standard deviation.
The ethanol treatment was also effective in crimping nanofibers made of a copolymer or a polymer blend with PLA. As shown in Figure S1, A and B, fibers electrospun from poly(lactic-co-glycolic) acid (PLGA, a copolymer of PLA) and a blend of poly(ε-caprolactone) (PCL) and PLA both showed a crimp morphology upon treatment with ethanol. Crimping was also observed when other combinations of polymers and plasticizers were involved, including poly(vinylidene fluoride) (PVDF) and dimethylformamide (DMF). Figure S1C indicates that PVDF fibers would become crimped after the sample had been treated with DMF.
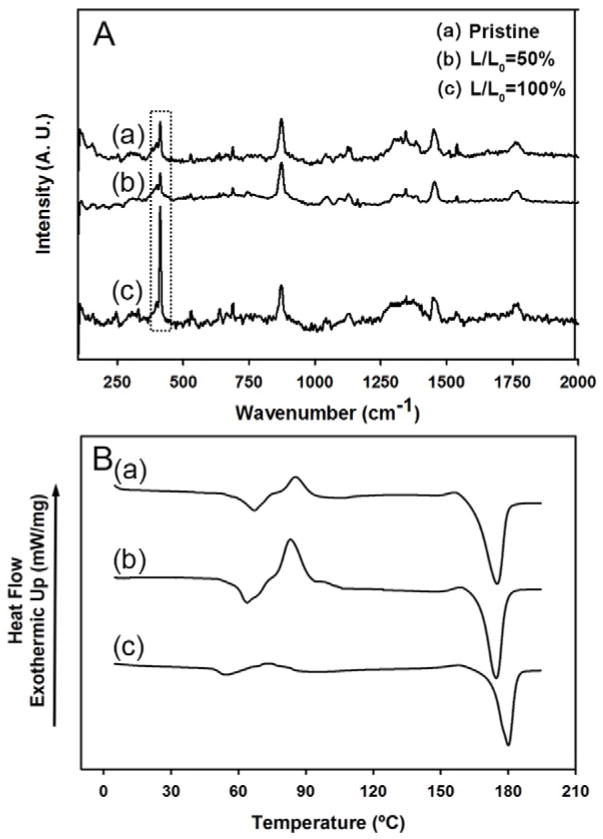
To detect any possible structural changes to the polymer chains caused by ethanol treatment, we analyzed the samples by Raman spectroscopy and differential scanning calorimetry (DSC). Figure 3A shows the Raman spectra recorded from the pristine nanofibers, an ethanol-treated sample at L/L0=50%, and an ethanol-treated sample at L/L0=100%. Many characteristic peaks were observed, and their assignments can be found in the literature.[25] The spectra for samples obtained at L/L0=100% and 50% differed most drastically in the region around 400 cm−1 (the boxed region). These differences were caused by changes to the polymer chain conformation. Specifically, the peaks between 415 and 397 cm−1 represent the in-plane bending mode of the carbon-carbonyl backbone. The band at 410 cm−1 is strongly affected by chain conformation whereas the band at 397 cm−1 is not.[26] The intensity of the band at 410 cm−1 increases with increasing crystallinity and can therefore be assigned to the crystalline phase while the intensity of the band at 397 cm−1 is not dependent on crystallinity. The ratio between the intensities of these two bands indicates the level of crystallinity. Figure 3A shows that the intensity of the 397 cm−1 band did not change when comparing the pristine sample to the two ethanol-treated samples. However, the intensity of the band at 410 cm−1 was higher for the sample obtained at L/L0=100% and lower for the sample obtained at L/L0=50% relative to the pristine sample. These results indicate that the crystallinity of the sample was increased when treated with ethanol at L/L0=100% while it decreased for the sample treated at L/L0=50%. These observations support a mechanism by which PLA polymer chains released the residual stress during ethanol treatment and thereby increased the crystallinity if the length of the stripe was retained or induced the formation of crimped features if the length was allowed to shrink.
Figure 3.
Representative Raman spectra (A) and DSC curves (B) of the pristine PLA nanofibers (sample-a) and the samples treated at L/L0=50% (b) and L/L0=100% (c), respectively. The box in (A) indicates the Raman peaks sensitive to the conformation of polymer chains.
Was also analyzed the chain conformation or crystallinity of the sample using the intensity of cold crystallization peak measured from DSC. A cold crystallization peak appears when an amorphous polymer sample is heated slowly to a temperature above its Tg. This occurs because crystalline structures will be formed when the polymer chains have sufficient kinetic energy to initiate crystal growth.[27,28] This phenomenon occurs in the range of temperature between Tg and the melting point (Tm). The degree of crystallinity, χ, can be calculated as the following:
where ΔHf is the heat of fusion, ΔHc is the heat of cold crystallization, and is the heat of fusion for 100% crystalline PLA, which is 93 J/g.[29] The intensity of the cold crystallization peak is therefore negatively correlated with the crystallinity of the sample. Three major peaks were observed in the DSC curves recorded for the pristine PLA nanofibers, the samples obtained at L/L0=50%, and the samples obtained at L/L0=100% (Fig. 3B), corresponding to the Tg, cold crystallization temperature (Tc), and Tm, from left to right, respectively. The samples obtained at L/L0=50% showed a large cold crystallization peak at 85.3 °C. The crystallinity for the pristine nanofibers, the sample obtained at L/L0=50%, and the sample obtained at L/L0=100% were around 8.8%, 1.7%, and 32.2%, respectively. Not surprisingly, the nanofibers treated with ethanol at L/L0=100% showed the highest crystallinity because the polymer chains released their residual stress but were not allowed to retract. In other words, when the length of the nanofiber strip was retained, the energy released from the fibers during ethanol treatment was used to increase the crystallinity, a process comparable to annealing. In contrast, when the length shrinkage was involved, the energy released from the fibers during ethanol treatment was used to retract the fibers and generate a crimp morphology.
To further examine the energy released from the fibers upon treatment with ethanol, we measured the forces generated when the as-prepared samples of fibers were immersed in ethanol and deionized water (Fig. S2). A rise in force was observed when ethanol was added, plateauing approximately 1 min after an initial peak. The maximum force was reached rapidly after ethanol was added (9.8 ± 2.5 s) and a value of 0.13 ± 0.05 N was obtained. The stress produced during ethanol treatment was ca. 16% of the ultimate tensile stress of the pristine nanofibers. In contrast, no change in force was observed for the same batch of sample submerged in deionized water.
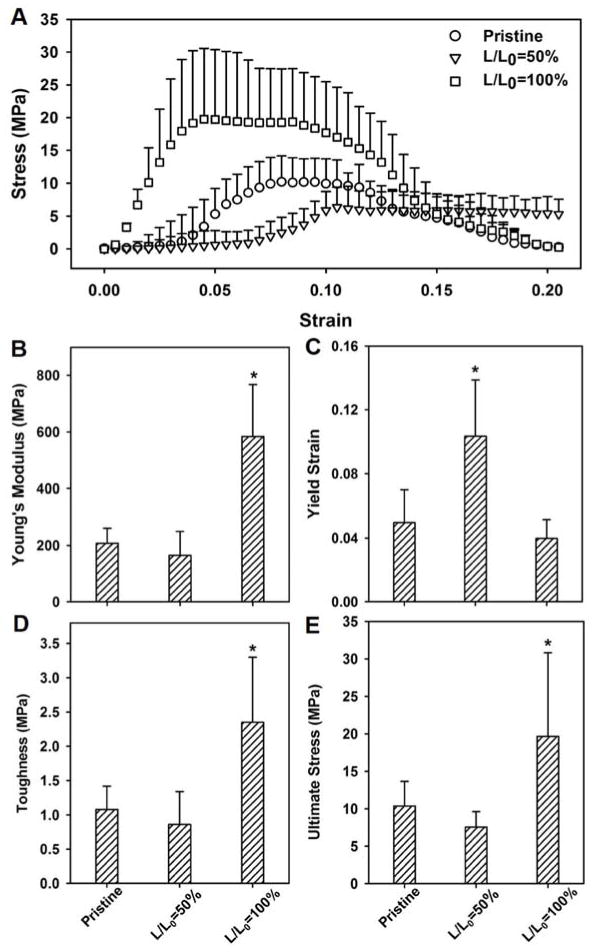
The crimped nanofibers exhibited many of the mechanical characteristics of native tendon tissues. Specifically, the crimped nanofibers obtained by ethanol treatment at L/L0=50% showed a stress-strain curve that included a non-linear toe region, followed by a linear region prior to yield. The toe region in these samples ended at a strain of ca. 7.5% (Fig. 4A). In contrast, the pristine nanofibers and the straight nanofibers obtained by ethanol treatment at L/L0=100% only showed toe regions that ended at strains of ca. 2% and 0.5%, respectively. The stress-strain curves of these three samples were also distinct from each other. Figure 4, B–E compares the mechanical properties of the pristine nanofibers with those obtained with ethanol treatment at L/L0=50% and 100%. The samples treated at L/L0=100% had the highest modulus and strength, but the lowest yield strain (Fig. 4, B and C). The significantly higher modulus for the samples obtained at L/L0=100% is consistent with an increase in crystallinity because modulus and crystallinity are positively correlated (Fig. 4B).[30] In contrast, the crimped nanofibers obtained at L/L0=50% had the lowest modulus but the highest yield strain, which is defined as the maximum strain a sample can reach before deforming plastically. Prior to the yield point, material deformation is reversible; a deformed material will return to its original shape when the applied stress or strain is removed. Figure 4C shows that the yield strains were 5%, 4%, and 11% for the pristine nanofibers, the samples obtained at L/L0=100%, and the samples obtained at L/L0=50%, respectively. As shown in Figure 4, D and E, the samples obtained at L/L0=100% also had the highest toughness and ultimate stress when compared to the pristine nanofibers and the samples treated at L/L0=50%.
Figure 4.
A comparison of the tensile mechanical tests involving (A) stress-strain behavior, (B) Young’s modulus, (C) yield strain, (D) toughness, and (E) ultimate stress for the pristine PLA nanofibers and those treated at L/L0=50% and L/L0=100%, respectively. N = 12 for each group; the data are presented as mean ± standard deviation; the * above the bars indicates significant difference as compared with the pristine nanofibers (p<0.05).
The higher yield strain for the samples obtained at L/L0=50% was likely a result of the crimp structure in the nanofibers. The non-linear toe region observed for the crimped fibers resembles the behavior of a native tendon tissue under tension, and is an important mechanical feature of soft connective tissues.[31,32] A relatively low yield strain, as seen in the pristine nanofibers and the straight nanofibers obtained at L/L0=100%, may predispose scaffolds to pre-mature rupture in the in vivo setting. The scaffolds consisting of crimped nanofibers, on the other hand, have a yield strain comparable to native tendon, and may therefore be a better choice for repairing soft connective tissues. The toughness and ultimate stress of the samples obtained at L/L0=100% were also the highest among the three groups due to the increase in crystallinity. On the other hand, no significant difference in toughness and ultimate stress was observed between the pristine nanofibers and the samples obtained at L/L0=50%.
To further demonstrate the advantages of using crimped nanofibers to repair soft connective tissues such as tendons, tendon fibroblasts (TFBs) were cultured on both the pristine nanofibers and crimped nanofibers obtained at L/L0=50%. After allowing attachment for 48 h, the samples in both groups were subjected to static tensile stretching for 24 h. Live/dead staining was then performed to evaluate the viability of the cells under uniaxial stretching. Initially, all TFBs were alive, as shown in Figure 5, A and D. In the pristine group, ca. 87% of the cells remained viable after the samples had been subjected to 10% strain (Fig. 5B) and this number dropped to ca. 7% when the strain was increased to 20% (Fig. 5C). A large number of the TFBs were detached from the scaffolds when the pristine nanofibers were ruptured at 20% strain. For the L/L0=50% group, the TFBs assumed a more polar morphology at 10% strain with ca. 91% of them remaining viable (Fig. 5E). When the strain was increased to 20%, ca. 80% of the TFBs still remained alive, without any evidence of detached cells. For the scaffolds based on crimped fibers, the externally applied strain was used to unfold the crimped features, resulting in a lower strain experienced by the cells. For the pristine and straight nanofibers obtained at L/L0=100%, the scaffold-level strain was translated to local strains directly exerted on the cells. These results indicate that TFBs cultured on crimped nanofibers have a higher level of tolerance toward the scaffold-level strain.
Figure 5.
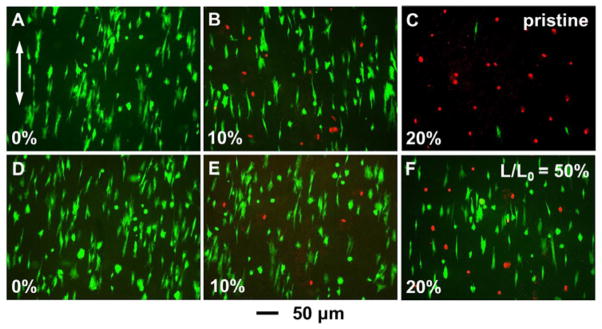
Live/dead staining of TFBs cultured on (A–C) pristine and (D–F) L/L0=50% crimped PLA nanofibers. TFBs in (B) and (E) subjected to 10% strain, while those in (C) and (F) subjected to 20% strain. The arrow in (A) indicates the alignment of the nanofibers and the direction of uniaxial strain externally applied.
In summary, we have demonstrated the use of ethanol treatment to generate crimped features in electrospun nanofibers. By controlling the degree of shrinkage during ethanol treatment, the residual stress was converted either into increased crystallinity (leading to increased modulus for the nanofibers) or into longitudinal contraction (leading to crimped features). The TFBs cultured on crimped nanofibers showed a higher level of tolerance toward the externally applied strain than those cultured on the straight nanofibers. Taken together, the crimping feature constitutes a major improvement to nanofiber-based scaffolds for tendon and soft connective tissue repair.
Experimental Section
Electrospinning
The polymer solution for electrospinning was prepared by dissolving 1.25 g PLA (Mw≈75,000) in 10 mL of hexafluoro-2-propanol (HFIP). The solution was loaded into a 5 mL plastic syringe with a 23½-gauge needle attached, and dispensed using a syringe pump. The injection rate was 0.5 mL/h. The fibers were collected using a rotating mandrel at a speed of 2 m/s. The distance between the tip of the needle and the collector was about 20 cm, and a voltage of 15 kV was used. All the samples were imaged using a Zeiss Ultra-60 FE-SEM at an accelerating voltage of 5 kV.
Raman Spectroscopy and DSC Analysis
The Raman spectra were recorded using a Thermo Almega XR Micro and Macro Raman Analysis System. The excitation wavelength was 488 nm. Backscattered Raman signals were collected on a CCD detector. The power of the laser was 20 mW, and the acquisition time was 2 s. The thermal behavior of the nanofibers was characterized by DSC (Q2000, TA instrument) in a temperature range of 0–200 °C at a heating rate of 20 °C/min. All experiments were repeated three times.
Mechanical Testing
Uniaxial tensile tests were performed using an Instron Electropuls E1000 with custom grips, and analyzed using custom code written in Matlab. Samples from all three groups were cut into testing strips of approximately 0.3×1.2 cm2, with the nanofibers aligned parallel to the long axis. The thickness of the scaffolds was measured with a Keyence LK-081 laser micrometer, and width and length were measured from analysis of high-resolution video stills. Samples were tested under uniaxial tension at quasi-static conditions, with a constant strain rate of 0.1% per second along the direction of alignment.
Testing of Force Generation during Ethanol Treatment
To measure the force produced during ethanol treatment, PLA nanofiber scaffolds were immersed in ethanol or de-ionized water (as a control). All the testing strips were held at their original length during the testing. Samples were first placed between magnetic frames for the preservation of their initial dimensions during handling and mounting. The frames were mounted onto thin film grips and placed in a container mounted to an Instron Electropuls E1000 materials testing frame. De-ionized water was then quickly added into the container, and force was measured for 50 s, with the grips held stationary. The water was then drained, and then ethanol was added, again measuring the force for 50 s. The force data was analyzed after low-pass filtering.
Cell Culture and Live/dead Staining
TFBs were maintained in Dulbecco’s modified eagle medium (DMEM) (Invitrogen) supplemented with 10 vol% FBS (Invitrogen) and 1 vol% P/S (Invitrogen) until 80% confluence. Scaffolds were prepared as 5×1 cm2 strips with the alignment parallel to the short axis, and attached to 90 mm petri dishes using a medical adhesive (A4100, Corning). Scaffolds were sterilized under UV for 30 min prior to cell seeding. The cultures were kept in an incubator at 37 °C under a humidified atmosphere containing 5% CO2 for 48 h for cell adhesion. The scaffolds were then mounted onto a custom device to apply 10% or 20% strain to the scaffold. The cells were maintained under static tension for 24 h prior to live/dead staining.
A live/dead assay kit (Invitrogen), consisting of calcein AM and ethidium homodimer-1 (EthD-1), was used to assess cell viability and cell distribution. The intracellular esterase present in live cells converts calcein AM, a cell permeable dye, to calcein, resulting in a bright green fluorescence. EthD-1 can only penetrate the damaged membranes of dead cells where it binds to nucleic acids, producing intense red fluorescence. Briefly, the cells were incubated for 30 min with regular culture medium supplemented with 2 μM calcein AM and 4 μM EthD-1, and analyzed via fluorescent microscopy (Leica DMI6000, Buffalo Grove, IL). Three samples from each group were analyzed at each time point.
Statistics
Results are presented in the form of mean ± standard deviation, with “N” indicating the number of samples per group. Comparison between groups was performed using one-way ANOVAs, followed by Tukey’s post-hoc tests for all pair-wise comparisons. Significance was set to p < 0.05.
Supplementary Material
Acknowledgments
This work was supported in part by a grant from the NIH (R01 AR060820) and startup funds from the Georgia Institute of Technology (to Y.X.). Part of the characterization work was performed at the Institute for Electronics and Nanotechnology (IEN).
Footnotes
Supporting information for this article is available on the WWW under http://dx.doi.org/.
Contributor Information
Wenying Liu, Email: younan.xia@bme.gatech.edu, School of Chemical and Biomolecular Engineering, Georgia Institute of Technology, Atlanta, GA 30332 (USA).
Justin Lipner, Department of Orthopaedic Surgery, Washington University in St. Louis, St. Louis, MO 63130 (USA).
Dr. Christine H. Moran, The Wallace H. Coulter Department of Biomedical Engineering, Georgia Institute of Technology and Emory University, Atlanta, GA 30332 (USA)
Liangzhu Feng, The Wallace H. Coulter Department of Biomedical Engineering, Georgia Institute of Technology and Emory University, Atlanta, GA 30332 (USA).
Xiyu Li, The Wallace H. Coulter Department of Biomedical Engineering, Georgia Institute of Technology and Emory University, Atlanta, GA 30332 (USA).
Prof. Stavros Thomopoulos, Email: thomopouloss@wudosis.wustl.edu, Department of Orthopaedic Surgery, Washington University in St. Louis, St. Louis, MO 63130 (USA)
Prof. Younan Xia, School of Chemical and Biomolecular Engineering, Georgia Institute of Technology, Atlanta, GA 30332 (USA). The Wallace H. Coulter Department of Biomedical Engineering, Georgia Institute of Technology and Emory University, Atlanta, GA 30332 (USA). School of Chemistry and Biochemistry, Georgia Institute of Technology, Atlanta, GA 30332 (USA)
References
- 1.Ansorge HL, Adams S, Birk DE, Soslowsky LJ. Ann Biomed Eng. 2011;39:1904. doi: 10.1007/s10439-011-0299-0. [DOI] [PMC free article] [PubMed] [Google Scholar]
- 2.Zhang G, Young BB, Ezura Y, Favata M, Soslowsky L, Chakravarti S, Birk DE. J Musculoskelet Neuronal Interact. 2005;5:5. [PubMed] [Google Scholar]
- 3.Franchi M, Fini M, Quaranta M, De Pasquale V, Raspanti M, Giavaresi G, Ottani V, Ruggeri A. J Anat. 2007;210:1. doi: 10.1111/j.1469-7580.2006.00666.x. [DOI] [PMC free article] [PubMed] [Google Scholar]
- 4.Kjær M. Physiol Rev. 2004;84:649. doi: 10.1152/physrev.00031.2003. [DOI] [PubMed] [Google Scholar]
- 5.Voleti PB, Buckley MR, Soslowsky LJ. Annu Rev Biomed Eng. 2012;14:47. doi: 10.1146/annurev-bioeng-071811-150122. [DOI] [PubMed] [Google Scholar]
- 6.Sahoo S, Toh SL, Goh JCH. Biomaterials. 2010;31:2990. doi: 10.1016/j.biomaterials.2010.01.004. [DOI] [PubMed] [Google Scholar]
- 7.Smith L, Xia Y, Galatz LM, Genin GM, Thomopoulos S. Connect Tissue Res. 2012;53:95. doi: 10.3109/03008207.2011.650804. [DOI] [PMC free article] [PubMed] [Google Scholar]
- 8.Sahoo S, Ouyang H, Goh JCH, Tay TE, Toh SL. Tissue Eng. 2006;12:91. doi: 10.1089/ten.2006.12.91. [DOI] [PubMed] [Google Scholar]
- 9.Derwin KA, Baker AR, Spragg RK, Leigh DR, Iannotti JP. J Bone Joint Surg Am. 2006;88:12. doi: 10.2106/JBJS.E.01307. [DOI] [PubMed] [Google Scholar]
- 10.Li D, Xia Y. Adv Mater. 2004;16:1151. [Google Scholar]
- 11.Pham QP, Sharma U, Mikos AG. Tissue Eng. 2006;12:1197. doi: 10.1089/ten.2006.12.1197. [DOI] [PubMed] [Google Scholar]
- 12.Liu W, Thomopoulos S, Xia Y. Adv, Healthcare Mater. 2012;1:10. doi: 10.1002/adhm.201100021. [DOI] [PMC free article] [PubMed] [Google Scholar]
- 13.Reneker DH, Chun I. Nanotechnology. 1996;7:216. [Google Scholar]
- 14.Li WJ, Laurencin CT, Caterson EJ, Tuan RS, Ko FK. J Biomed Mater Res. 2002;60:613. doi: 10.1002/jbm.10167. [DOI] [PubMed] [Google Scholar]
- 15.Li D, Wang Y, Xia Y. Nano Lett. 2003;3:1167. [Google Scholar]
- 16.Li D, Wang Y, Xia Y. Adv Mater. 2004;16:361. [Google Scholar]
- 17.Liu Y, Zhang X, Xia Y, Yang H. Adv Mater. 2010;22:2454. doi: 10.1002/adma.200903870. [DOI] [PMC free article] [PubMed] [Google Scholar]
- 18.Surrao DC, Hayami JW, Waldman SD, Amsden BG. Biomacromolecules. 2010;11:3624. doi: 10.1021/bm101078c. [DOI] [PubMed] [Google Scholar]
- 19.Chen F, Hayami JWS, Amsden BG. Biomacromolecules. 2014;15:1593. doi: 10.1021/bm401813j. [DOI] [PubMed] [Google Scholar]
- 20.Lin T, Wang H, Wang X. Adv Mater. 2005;17:2699. [Google Scholar]
- 21.Varesano A, Montarsolo A, Tonin C. Eur Polym J. 2007;43:2792. [Google Scholar]
- 22.Drumright RE, Gruber PR, Henton DE. Adv Mater. 2000;12:1841. [Google Scholar]
- 23.Zong X, Kim K, Fang D, Ran S, Hsiao BS, Chu B. Polymer. 2002;43:4403. [Google Scholar]
- 24.Kakade MV, Givens S, Gardner K, Lee KH, Chase DB, Rabolt JF. J Am Chem Soc. 2007;129:2777. doi: 10.1021/ja065043f. [DOI] [PubMed] [Google Scholar]
- 25.Kister G, Cassanas G, Vert M. Polymer. 1998;39:267. [Google Scholar]
- 26.Kang S, Hsu SL, Stidham HD, Smith PB, Leugers MA, Yang X. Macromolecules. 2001;34:4542. [Google Scholar]
- 27.Kulinski Z, Piorkowska E. Polymer. 2005;46:10290. [Google Scholar]
- 28.Zhang J, Tsuji H, Noda I, Ozaki Y. Macromolecules. 2004;37:6433. [Google Scholar]
- 29.Pyda M, Bopp R, Wunderlich B. J Chem Thermodyn. 2004;36:731. [Google Scholar]
- 30.Crist B. Annu Rev Mater Sci. 1995;25:295. [Google Scholar]
- 31.Lake SP, Miller KS, Elliot DM, Soslowsky LJ. J Orthop Res. 2009;27:1596. doi: 10.1002/jor.20938. [DOI] [PMC free article] [PubMed] [Google Scholar]
- 32.Duenwald SE, Vanderby R, Lakes RS. Ann Biomed Eng. 2009;37:1131. doi: 10.1007/s10439-009-9687-0. [DOI] [PubMed] [Google Scholar]
Associated Data
This section collects any data citations, data availability statements, or supplementary materials included in this article.


