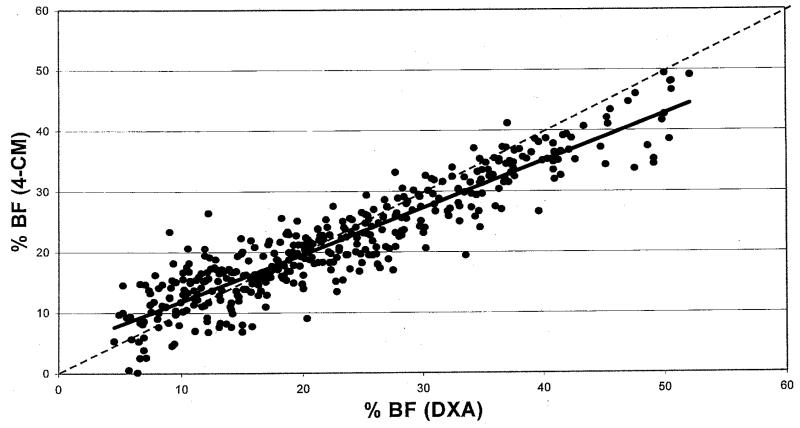
Fig 1.
Results of linear regression analysis comparing %BF by DXA (Lunar DPX/DPX-L) with %BF by the 4-CM in 411 children and adolescents aged 6 to 18. The dotted line represents the line of identity (slope = 1; intercept = 0), and the bold line represents the regression line given by the model. The regression line was significantly different from the line of identity (P < .0001); the slope was significantly different from 1, and the intercept was significantly different from 0 (P < .0001 for each). R2 = 0.85; SEE = 3.66%; %BF 4-CM = 0.7739 (%BF DXA) + 4.128.

