Abstract
Histology and biochemical assays are standard techniques for estimating cell concentration in engineered tissues. However, these techniques are destructive and cannot be used for longitudinal monitoring of engineered tissues during fabrication processes. The goal of this study was to develop high-frequency quantitative ultrasound techniques to nondestructively estimate cell concentration in three-dimensional (3-D) engineered tissue constructs. High-frequency ultrasound backscatter measurements were obtained from cell-embedded, 3-D agarose hydrogels. Two broadband single-element transducers (center frequencies of 30 and 38 MHz) were employed over the frequency range of 13 to 47 MHz. Agarose gels with cell concentrations ranging from 1×10⁴ to 1×10⁶ cells mL−1 were investigated. The integrated backscatter coefficient (IBC), a quantitative ultrasound spectral parameter, was calculated and used to estimate cell concentration. Accuracy and precision of this technique were analyzed by calculating the percent error and coefficient of variation of cell concentration estimates. The IBC increased linearly with increasing cell concentration. Axial and lateral dimensions of regions of interest that resulted in errors of less than 20% were determined. Images of cell concentration estimates were employed to visualize quantitatively regional differences in cell concentrations. This ultrasound technique provides the capability to rapidly quantify cell concentration within 3-D tissue constructs noninvasively and nondestructively.
Key terms: Ultrasound Tissue Characterization, Integrated Backscatter Coefficient, Nondestructive Evaluation, Parametric Imaging, Tissue Engineering
3. Introduction
Monitoring the structural and biological properties of engineered tissue constructs during fabrication is critical for the development of functional engineered tissues.1,2 Current techniques, including histological analyses and biochemical assays, are destructive and therefore, lack the capability for longitudinal monitoring. Quantitative, non-invasive technologies that can monitor the cellular properties of three-dimensional (3-D) engineered tissues non-destructively will provide critical tools to optimize fabrication processes. Ultrasound imaging and tissue characterization technologies hold great promise to enable quantitative assessment of 3-D engineered tissues. Ultrasound technologies are non-invasive, non-destructive, non-ionizing, and broadly applicable across tissue types. Furthermore, ultrasound is cost-effective, portable, and can be integrated into tissue fabrication environments.
Techniques that analyze the gray-scale values of ultrasound B-scan images have been used to assess collagen synthesis by myofibroblasts in 3-D fibrin gels,3 to evaluate the phase inversion process of poly(lactic-co-glycolic acid) (PLGA) implants that serve as drug-releasing depots,4 to image changes in extracellular matrix deposition during chondrogenic differentiation of adipose stem cells in 3-D synthetic scaffolds,5 and to estimate the number of bone marrow stromal cells in β-tricalcium phosphate scaffolds.6 Although ultrasound finds wide use clinically in diagnostic imaging, conventional B-scan images do not provide quantitative metrics to characterize the biological properties of tissues. B-scan images display only the envelope of the received echoes, and are affected by acoustic attenuation and system-dependent parameters.7–9 For instance, the resolution of the B-scan image is determined by the frequency response of the ultrasound system, and image brightness depends on the receiver gain.10
Ultrasound tissue characterization describes a variety of signal processing techniques designed to extract diagnostic information from backscatter radiofrequency (RF) signals in order to quantitatively characterize normal and abnormal tissue.9,10 Quantitative ultrasonic tissue parameters include the speed of sound,10,11 absorption and attenuation coefficients,11,12 backscatter coefficient,13,14 nonlinearity parameter,15 integrated backscatter,11,16 midband fit,8,17,18 spectral intercept,17 spectral slope,8,17,18 and angular scattering.19 Many ultrasound tissue characterization techniques currently under investigation are applied to a broad range of native tissues.9 Among numerous applications,9 quantitative ultrasound techniques have been used to characterize various tumors,10,20 monitor cell death,18,21 assess cardiac abnormalities,22 characterize ultrasound contrast agents,23 and evaluate therapeutic responses of diseased and normal tissues.24,25 In addition, quantitative ultrasound techniques that extract spectral parameters from the backscatter RF signals can be used to characterize tissue microstructure, such as the number, size, and organization of tissue scatterers.9,10,13 Importantly, unlike B-scan images, these spectral parameters are independent of the ultrasound system, and thus, can provide quantitative metrics for assessment.
The goal of this study was to develop the use of high-frequency quantitative ultrasound to nondestructively estimate cell concentration in 3-D hydrogels. The quantitative ultrasound parameter known as the integrated backscatter coefficient (IBC) was employed in this work. The IBC is an estimate of the backscatter strength of sub-resolution scatterers per unit volume over the transducer bandwidth, and provides an approximation of the scatterer number density.11,14 The IBC has been employed to assess red blood cell coagulation in vitro,16 whole cells and isolated nuclei,11 human dermis and subcutaneous fat,26 and composition of human coronary arteries.27 In the current study, backscatter RF measurements were obtained from fibroblasts embedded in agarose gels, and the IBC was calculated. Two single-element immersion transducers with center frequencies of 30 and 38 MHz were employed over an ultrasound frequency range of 13 to 47 MHz to investigate cell concentrations ranging from 1×10⁴ to 1×10⁶ cells mL−1. Parametric images of cell concentration estimates in agarose gels were employed to visualize regional differences in cell density quantitatively.
4. Materials and Methods
Cell culture
Mouse embryonic fibroblasts (provided by Dr. Jane Sottile, University of Rochester, NY) were cultured on tissue culture dishes precoated with collagen type-I using a 1:1 mixture of Aim V (Invitrogen, Carlsbad, CA) and Cellgro® (Mediatech, Herndon, VA).28 Twenty hours prior to agarose gel fabrication, cell culture media was replaced with 1X Dulbecco’s Modified Eagle Medium (DMEM; Invitrogen) to induce cell cycle arrest. For experimental procedures, harvested cells28 were resuspended in 1X DMEM containing 25 mM HEPES (Invitrogen).
Cell-embedded agarose gels
Agarose gels (36 mm in diameter and 5 mm in height), containing uniformly distributed cells, were fabricated in Bioflex® 6-well culture plates (Flexcell Int’l. Corp., Hillsborough, NC). Low melting temperature agarose (Lonza SeaPlaque® Agarose, Allendale, NJ) was dissolved in deionized water to a concentration of 4% (w/v) and degassed by autoclaving at 121°C for 1 hour. The 4% agarose was allowed to cool and then diluted 1:1 with 2X DMEM to produce a working solution of 2% agarose and 1X DMEM. The solution was maintained at 40°C in a water bath. An acellular bottom layer (3 mm in height) was fabricated by diluting the 2% agarose with warmed 1X DMEM to a final concentration of 0.8%. This layer served as an acoustic standoff from the bottom surface of the well. To form the top layer (2 mm in height), cells were mixed with 2% agarose and 1X DMEM to produce a final concentration of 0.4% agarose, and the solution was pipetted over the pre-gelled bottom layer. Gels were fabricated with cell concentrations of 1×10⁴, 5×10⁴, 1×10⁵, 3×10⁵, 5×10⁵, 6×10⁵, 8×10⁵, and 1×10⁶ cells mL−1. Acellular agarose gels served as control samples from which backscatter information of the agarose background was obtained. Agarose gels were incubated at 37°C and 8% CO2 for 1 hour. Five separate gels were investigated for each cell concentration. Viable cells were visualized using phase contrast microscopy by staining with thiazolyl blue tetrazolium bromide (MTT; USB Corporation, Cleveland, OH), as described previously.28 The diameter of the cells was measured using the microscopy images analyzed in ImageJ software (NIH, Bethesda, MD).
Agarose gels with regional differences in cell concentration were investigated to assess whether the IBC technique could estimate and visualize spatial variations in cell concentrations. These gels were fabricated in rectangular plastic cuvettes (1 cm wide and 4 cm long) that were modified by replacing two opposite sides with acoustic windows (Saran™ Wrap, S.C. Johnson & Son, Inc.). Agarose gels were fabricated with three regions, each 1 cm in height, having different cell concentrations (bottom region, 2×10⁵ cells mL−1; middle region, 1×10⁵ cells mL−1; top region, 3×10⁵ cells mL−1). The three layers were fabricated sequentially by allowing each layer to gel for 1 hour before overlaying the subsequent layer. A total of 6 separate samples were investigated.
Transducer characterization
Two single-element, polyvinylidene fluoride (PVDF) focused transducers were employed (PI35-2 and PI50-2; Olympus, Waltham, MA). The acoustic beam patterns of the transducers were measured using an 85-μm diameter PVDF hydrophone (HGL-0085; Onda Corp., Sunnyvale, CA). The − 6 dB beamwidth and depth of field were computed from the measured beam patterns. A planar stainless steel reflector was used to obtain the reference spectrum to characterize the frequency response of the ultrasound system.13,20,29 The reference RF signal from the planar steel reflector was acquired with a lower receiver gain than that of the backscattered RF signals from the agarose gels to prevent system saturation.30 The − 6 dB bandwidth of the transducer was also measured using the reference spectrum.
Acoustic attenuation measurements
The acoustic attenuation coefficients of 0.4% agarose scaffolds and the Saran™ membrane were determined using a through-transmission, narrowband, insertion-loss technique.31 Water at 21°C was the reference medium.32 Gels were fabricated in cylindrical plastic tubes that were 16 mm in height and 28 mm in diameter. The bottom and top openings of the tubes were covered with Saran™ membrane. Attenuation measurements were obtained within the − 6 dB bandwidth of the transducer in 1-MHz steps using a hydrophone (HGL-0085; Onda Corp.). The average attenuation coefficient was calculated using measurements from 6 separate samples and was used to compensate for the frequency-dependent acoustic attenuation through the agarose scaffold and the Saran™ membrane. Power law regression analysis was then performed on the attenuation data as a function of frequency using Matlab® (Mathworks Inc., Natick, MA).
Backscatter data acquisition
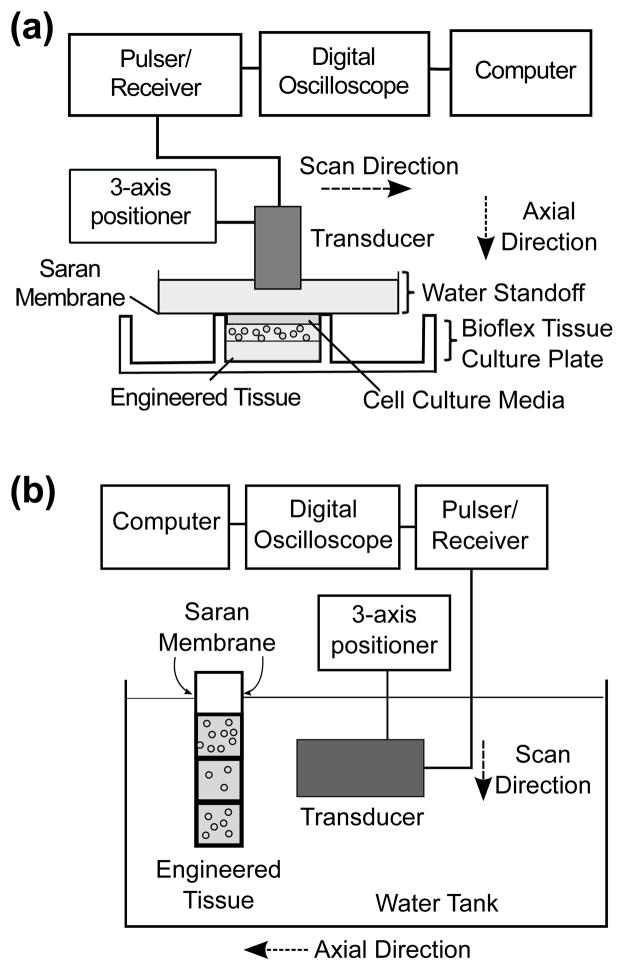
Experimental set-ups used to measure ultrasound backscatter from agarose gels are shown in Figure 1. Figure 1a shows the set-up used to conduct backscatter measurements of agarose gels with single cell concentrations. The wells of Bioflex® plates that contained gels were filled with 1X DMEM with 25 mM HEPES before backscatter measurements. A degassed, deionized water standoff was placed above the well to provide an acoustic propagation path. A Saran™ membrane at the bottom of the standoff separated the water from DMEM. The transducer was mounted on a 3-axis positioner (Velmex Inc., Bloomfield, NY), controlled by a custom Matlab® program. The transducer was aligned such that the transducer’s focal region was at the middle of the agarose gel (i.e., axial location of 1 mm into the gel). Acoustic reverberations from the water, gel, and Saran™ interfaces were not present in the imaging field of view. The set-up used to conduct backscatter measurements of agarose gels having regions with different cell concentrations is shown in Figure 1b. The cuvette and transducer were placed in a water tank with degassed, deionized water. The transducer was aligned such that the transducer’s focal region was at an axial location of 2 mm into the agarose gel. In both experimental set-ups, a pulser/receiver (5073PR; Olympus) was used to generate a broadband pulse that excited the transducer at a pulse repetition frequency of 1 kHz. Ultrasound backscatter RF signals were amplified and digitized to 12 bits using a digital oscilloscope (Waverunner 62Xi-A; LeCroy Corp., Chestnut Ridge, NY) at a sampling frequency of 500 MHz. Sixty repeated RF acquisitions were averaged at each scan location to improve the signal-to-noise ratio.26 This produced one averaged, noise-reduced RF line per scan location. The transducer was translated laterally to scan an imaging plane. There were 90 and 170 adjacent scan locations per imaging plane of the gels in Bioflex® plates and modified cuvettes, respectively. Neighboring scan locations were one beamwidth apart, such that adjacent RF lines were independent from each other.33 Ultrasound backscatter measurements were conducted at 5 independent imaging planes in each gel. Gels in the cuvettes were scanned along the side of the gels, from the top to the bottom (Fig. 1b). A B-scan image was generated offline for each imaging plane by calculating the gray-scale envelope of each RF line and stacking the independent scan lines in the lateral direction.
Figure 1.
Schematics of the experimental set-ups for ultrasound backscatter measurements of cell-embedded agarose gels. (a) Gels with single cell concentrations were fabricated in Bioflex® tissue culture plates. Each well was filled with cell culture media and a water standoff was placed above the well to provide an acoustic propagation path. (b) Gels with 3 regions having different cell concentrations were fabricated in modified plastic cuvettes. The cuvette and a single-element transducer were placed in a water tank with degassed, deionized water. In both set-ups, a single-element transducer was aligned using a 3-axis positioner such that its focal region was within the cell-embedded agarose gel. A pulser/receiver supplied RF signals that excited the transducer, and received the backscattered RF signals from the gels along an imaging plane.
IBC estimation
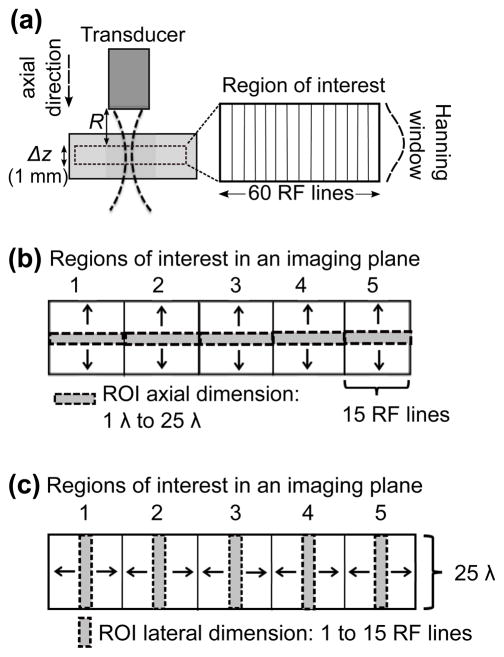
IBCs of agarose gels with single cell concentrations were calculated using a custom Matlab® program. A B-scan image generated for each imaging plane was used to select a region of interest (ROI) that contained 60 adjacent scan locations within the cell-embedded agarose layer (Fig. 2a). The ROI was centered at the transducer’s focal region and had a 1-mm axial length (i.e., 20 and 25 wavelengths long for the 30- and 38-MHz data, respectively). The wavelength, λ, was calculated from the center frequency of the transducer, assuming that the speed of sound was 1500 m/s. The RF line at each scan location was scaled to compensate for the receive gain.34 Each RF line was then weighted by a Hanning function in the axial direction to reduce side lobes in the power spectrum.13 The power spectrum of each RF line was obtained by computing the absolute square of the Fast Fourier Transform of the RF line.13 To estimate a representative power spectrum for an entire ROI, the power spectra of all adjacent, independent RF lines in the ROI were averaged using the following equation:13,16,35–38
Figure 2.
Schematics of backscatter RF signal analyses. (a) Schematic of a ROI within an agarose gel with one cell concentration. The transducer transmitted ultrasound pulses and collected backscatter RF signals along an imaging plane. A ROI, centered at the focus of the ultrasound beam, was selected within the imaging plane. R represents the axial distance between the transducer face and the proximal axial location of the ROI. Δz is the axial length of the ROI (i.e., 1 mm). The ROI contained 60 RF lines that were weighted by a Hanning window. The IBC was then calculated for the ROI. Schematic of the analysis of the accuracy and precision of IBC estimates for various (b) axial and (c) lateral lengths of the ROI. The backscatter data collected from each imaging plane within an agarose gel were divided into 5 neighboring ROIs, each with 15 RF lines. (b) The axial length of the ROI was varied from 1 to 25 wavelengths (denoted by the arrows), where the wavelength was calculated from the center frequency of the transducer. The IBC for each ROI was estimated for every axial length. (c) The lateral length of each ROI was then varied from 1 to 15 RF lines (denoted by the arrows), while the axial length was held constant at 25 λ. The IBC for each ROI was estimated for every lateral length.
| (1) |
where f (MHz) is the ultrasound frequency in the − 6 dB bandwidth of the transducer, (Watts Hz−1) is the spatially-averaged power spectrum within the ROI, N is the number of independent RF lines in the ROI, and Si(f) are the measured power spectra at the same axial depth location for N adjacent RF lines. To remove the frequency response of the ultrasound system and to compensate for acoustic attenuation in the agarose gel and Saran™ layer, the normalized power spectrum was computed as follows:13,17
| (2) |
where Sref(f) (Watts Hz−1) is the reference spectrum of the echo from the planar steel reflector, Δx (cm) is the axial distance between the top surface of the agarose gel and the center of the ROI, αs(f) is the measured attenuation coefficient (dB cm−1) of both the agarose scaffold and Saran™ layer, and αref(f) is the attenuation coefficient (dB cm−1) of the reference medium (i.e., degassed water at 21°C).32 The normalized power spectrum was then used to calculate the frequency-dependent backscatter coefficient (BSC) (sr−1 cm−1) using the equation:13,14
| (3) |
where A0 (cm2) is the area of the transducer aperture, R (cm) is the on-axis distance between the transducer face and the proximal axial location of the ROI, and Δz (cm) is the axial length of the ROI (Fig. 2a). Equation (3) was derived under the assumptions that 1) tissue scatterers were weak (Born approximation),13,14 2) dimensions of the scatterers were less than or on the order of the wavelength,13,39 3) incoherent scattering dominated,13,14 4) multiple scattering was negligible,13,20 5) backscattered RF signals were modeled as wide–sense stationary signals,13,35 and 6) tissue scattering followed a Gaussian model.13,20 The IBC (sr−1 cm−1) was then calculated from the BSC using the following equation:11,16
| (4) |
where fmin and fmax are the minimum and maximum frequencies (MHz) of the − 6 dB transducer bandwidth. Linear regression analysis was then performed on the IBC data as a function of cell concentration using Matlab®.
Accuracy and precision of cell concentration estimates and ROI dimensions
Various ROI dimensions were investigated to assess the accuracy and precision of the IBC technique for estimating the cell concentration within the ROI. Accuracy describes the closeness of the cell concentration estimate obtained by the technique to the true cell concentration in the ROI,40 which was equal to the fabrication concentration. Precision describes the repeatability of cell concentration estimates obtained by the technique.40 Schematics of these analyses for agarose gels with homogeneous cell distribution are shown in Figures 2b and 2c. To investigate the accuracy and precision of the IBC technique for various axial lengths of the ROI, the RF data in each imaging plane of a homogeneous, cell-embedded gel were divided into 5 neighboring ROIs, each with 15 independent RF lines. The axial length of the ROI was varied from 1 to 25 wavelengths, denoted by the black arrows (Fig. 2b). The IBC was then estimated from the RF data in each ROI for every axial length. Results from the linear regression analysis of the IBC as a function of cell concentration were used to convert IBC values to corresponding cell concentration estimates. To investigate the accuracy and precision for various lateral lengths of the ROI, the number of independent RF lines in the ROI was varied from 1 to 15 (Fig. 2c), and the cell concentration in the ROI was estimated for every lateral length. The accuracy of the IBC technique was investigated by calculating the percent error (%) between the cell concentration estimate and true cell concentration in each ROI using the following equation:40
| (5) |
The average percent error of the 5 ROIs in each imaging plane was analyzed for various ROI dimensions. The precision of the IBC technique was assessed by analyzing the coefficient of variation (CV) in cell concentration estimates of 5 ROIs in each representative imaging plane.40 The CV (%) was calculated using the equation:
| (6) |
Imaging spatial variations in cell concentration
The IBC of agarose gels with 3 regions of different cell concentrations were calculated using data obtained with the 38-MHz transducer (Eqs. 1–4). Parametric images of cell concentration estimates were generated to visualize spatial variations in cell concentrations within the gel. Each color block in the parametric image represents an ROI with an estimated cell concentration. The linear regression curve obtained above was used to convert IBC values to corresponding cell concentrations. To assess the effect of ROI size on the accuracy of the cell concentration estimates, the number of RF lines in the each ROI was varied from 7 to 56, while the axial length was held constant at 25λ (i.e., 1 mm).
Statistical Analyses
Attenuation coefficient measurements are presented as mean ± SD as a function of ultrasound frequency (n = 6 gels). Power law regression analyses of attenuation coefficient measurements as a function of frequency were performed. Analysis of variance (ANOVA) was used to determine whether the differences in attenuation coefficient measurements obtained using the 30- and 38-MHz transducers were statistically significant (p values < 0.05 reject the null hypothesis that the means of the attenuation coefficients between the transducers are equal).
IBC estimates of agarose gels with single cell concentrations are presented as mean ± SEM as a function of fabrication cell concentration (n = 5 gels per cell concentration). Linear regression analyses of IBC estimates as a function of cell concentration were performed. The linear correlation between the IBC and cell concentration was quantified with the regression coefficient (R2). The Anderson-Darling test was used to determine whether IBC data corresponding to each cell concentration were drawn from a normal distribution. The non-parametric Friedman test was used to determine whether differences in IBC data obtained using the 30- and 38-MHz transducers were statistically significant (p values < 0.05 reject the null hypothesis that there are no differences in the IBC data obtained using the transducers). All statistical tests were performed using Matlab®.
5. Results
Transducer characteristics
Table 1 provides transducer characteristics. The radius of the active element of the hydrophone (42.5 μm) was larger than the theoretical hydrophone radius10 required to precisely measure the lateral beamwidth of the imaging transducers. This could cause overestimation of the beamwidths due to spatial averaging.10 In the present study, adjacent RF lines were one beamwidth apart, resulting in independent RF lines.33 Therefore, any potential overestimation of the lateral beamwidths arising from hydrophone measurements would further ensure that the RF lines were independent. Supplemental Figure 1 shows the reference power spectrum of the ultrasound system for each transducer (n = 5 independent measurements).
Table 1.
Measured transducer characteristics.
| Transducer Characteristics | Model PI35-2 | Model PI50-2 |
|---|---|---|
| Center frequency | 30 MHz | 38 MHz |
| Aperture diameter | 6.35 mm | 6.35 mm |
| Focal length | 19 mm | 21 mm |
| Beamwidth (− 6 dB) | 180 μm | 170 μm |
| Pulse length (− 6 dB) | 42 μm | 41 μm |
| Depth of field (− 6 dB) | 5.6 mm | 4.7 mm |
| Bandwidth (− 6 dB) | 18 MHz (20 – 38 MHz) | 35 MHz (13 – 47 MHz) |
Attenuation coefficients of agarose scaffolds
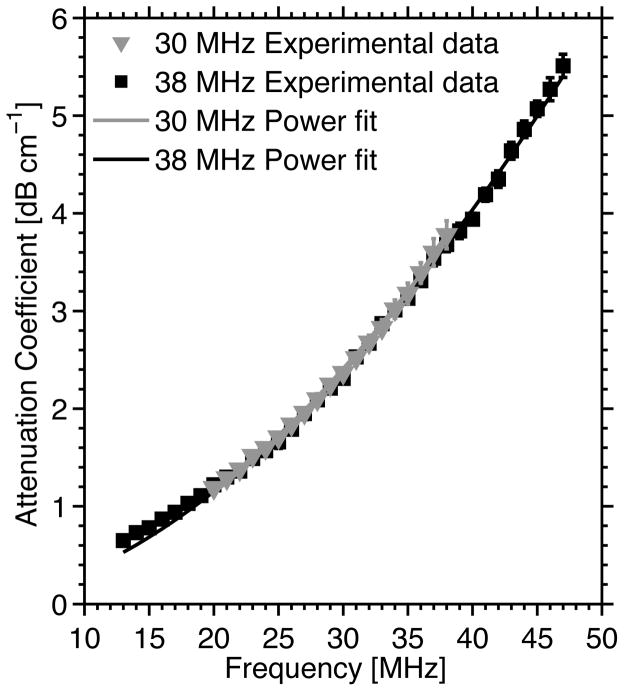
The frequency-dependent attenuation coefficients of both the 0.4% agarose scaffold and Saran™ membrane were measured using two transducers (center frequencies of 30 and 38 MHz) (Fig. 3). The power law fit to the 30-MHz data was given by the equation: , where α was the attenuation coefficient (dB cm−1) and f was the ultrasound frequency (MHz). The power law fit to the 38-MHz data was given by: α = 5.1×10⁻³f 1.8. The exponents of the power law fits were within the range observed for soft biological tissues.31 The differences in attenuation coefficients measured using the 30- and 38-MHz transducers as a function of frequency were not statistically significant (p = 0.17). The power law fit equations were used to compensate for attenuation through agarose gels and Saran™ membrane as a function of frequency and propagation distance (Eq. 2).
Figure 3.
The attenuation coefficient of both the 0.4% agarose scaffold and the Saran™ membrane as a function of ultrasound frequency measured using the insertion-loss technique. Mean ± SD of measured attenuation coefficients are shown (n = 6 samples). Measured attenuation coefficients using the 30-MHz transducer are represented by gray triangles, and data obtained with the 38-MHz transducer are represented by black squares. The solid lines represent the power law fits of the estimated data. The power law fit to the 30-MHz data is given by the equation: α = 4.5×10⁻³f 1.8, where α is the attenuation coefficient (dB cm−1) and f is the ultrasound frequency (MHz). The power law fit to the 38-MHz data is given by: α = 5.1×10⁻³f 1.8.
Microscopy and B-scan images of cell-embedded agarose gels
Microscopy images of cell-embedded agarose samples stained with MTT (Supplemental Fig. 2) verified that cells were alive, and that the spatial distribution of cells was homogeneous throughout the gels. The measured diameter of the cells was 10.8 μm ± 2.8 μm. The cells represent sub-resolution scatterers because they were smaller than the dimensions of the resolution cell of each transducer (i.e., lateral beamwidth and axial pulse length) (Table 1). Furthermore, the cell diameter was less than the ultrasound wavelengths for the range of frequencies used in this study. The spatial distribution and diameter of the cells were consistent with the assumptions used to derive the IBC equation (see Eqs. 3 and 4).13,14
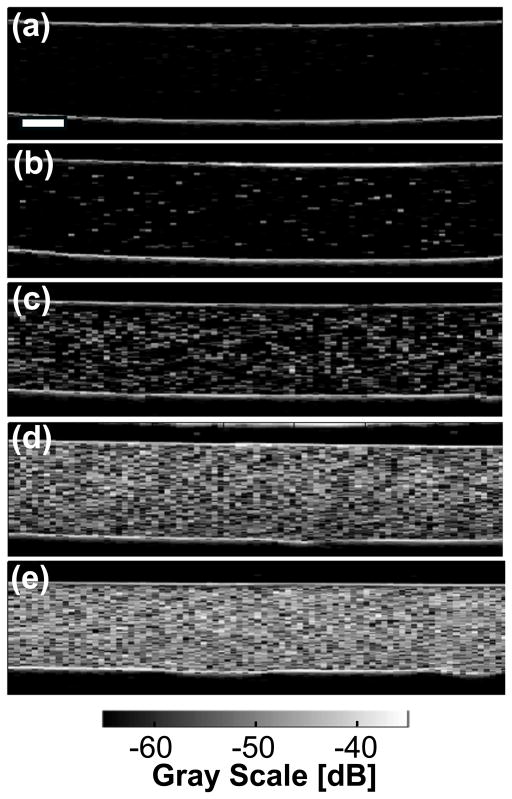
Representative B-scan images of cell-embedded agarose gels are shown in Figure 4 for data acquired using the 38-MHz transducer. The use of Bioflex® plates having silicone elastomer bottoms minimized reflections compared to standard tissue culture plates.28 Two bright horizontal lines were apparent in each of the B-scan images (Fig. 4). The top horizontal line corresponds to the specular reflection from the interface between the cell culture media and the top of the cell-embedded agarose layer. The lower horizontal line corresponds to the specular reflection from the interface between the bottom of the cell-embedded layer and the top of the acellular agarose layer. The echogenicity from the cell-embedded agarose gels increased with increasing cell concentration (Fig. 4). These B-scan images, however, provide only qualitative visualization of cell density within agarose gels.
Figure 4.
Representative B-scan images of agarose gels (a) without cells, and with cells at concentrations of (b) 1×10⁴, (c) 1×10⁵, (d) 5×10⁵, and (e) 1×10⁶ cells mL−1. Data were acquired using the 38-MHz transducer. Echogenicity of the cell-embedded agarose layer increased with increasing cell concentration. Scale bar, 1 mm.
IBC increases linearly with cell concentration
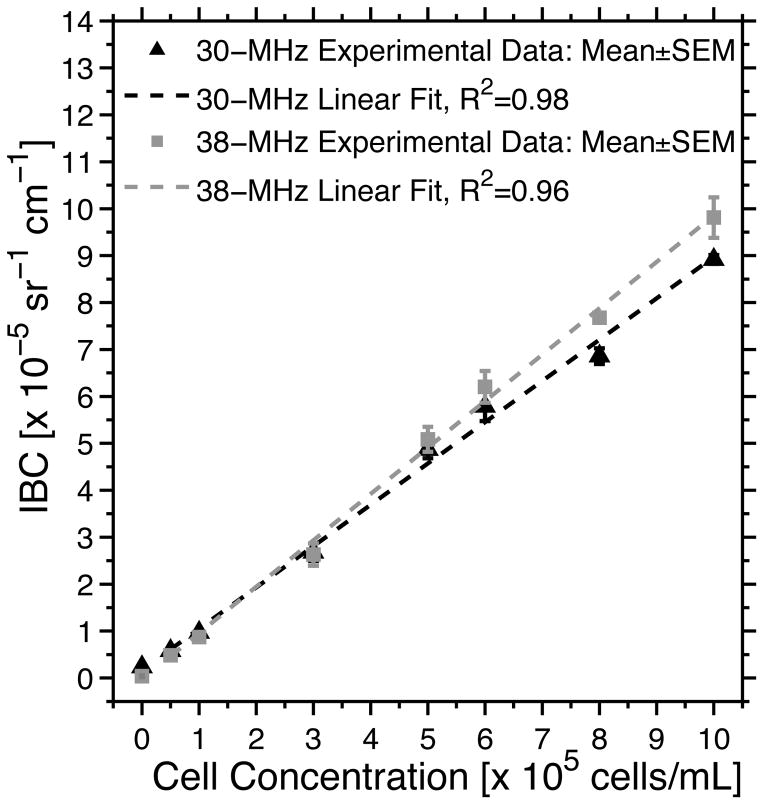
The frequency dependence of the BSCs was similar for all cell concentrations (Supplemental Fig. 3). The BSC increased monotonically as a function of frequency, peaked at ~33 MHz, and then slightly decreased. At each frequency, the BSC magnitudes increased with increasing cell concentration. The frequency dependence of the BSC for acellular gels was relatively flat compared to those for cell-embedded gels (Supplemental Fig. 3). The IBCs of the agarose gels were then calculated using the BSCs (Fig. 5). The IBC data corresponding to 1×10⁴ cells mL−1 were not included in this figure, and the IBC data for 0 and 1×10⁴ cells mL−1 were not included in the regression analyses because the amplitude of the backscatter signal at these cell concentrations was on the order of electronic noise. The IBC increased linearly with increasing cell concentration from 5×10⁴ to 1×10⁶ cells mL−1. The differences in the IBC estimates between the 30- and 38-MHz transducers were not statistically significant (p = 0.074).
Figure 5.
Estimated IBC of agarose gels with cell concentrations ranging from 0 to 1×10⁶ cells mL−1. Mean ± SEM of the IBC are shown (n = 5 samples per cell concentration) using the 30-MHz (black triangles) and 38-MHz (gray squares) transducers. Linear fits to the IBC estimates and corresponding regression coefficients R2 are shown. The linear fit to the 30-MHz data is given by the equation: IBC = 0.88 [Cell] + 0.17, where IBC is in units of 1×10⁻⁵ sr−1 cm−1 and [Cell] is the cell concentration in units of 1×10⁵ cells mL−1. The linear fit to the 38-MHz data is given by the equation: IBC = 0.99 [Cell] − 0.032. The IBC was estimated using the backscatter RF data of selected ROIs in B-scan images. Each ROI had an axial length of 25 wavelengths and a lateral length of 60 RF lines.
Accuracy and precision improve with increasing ROI dimensions and cell concentration
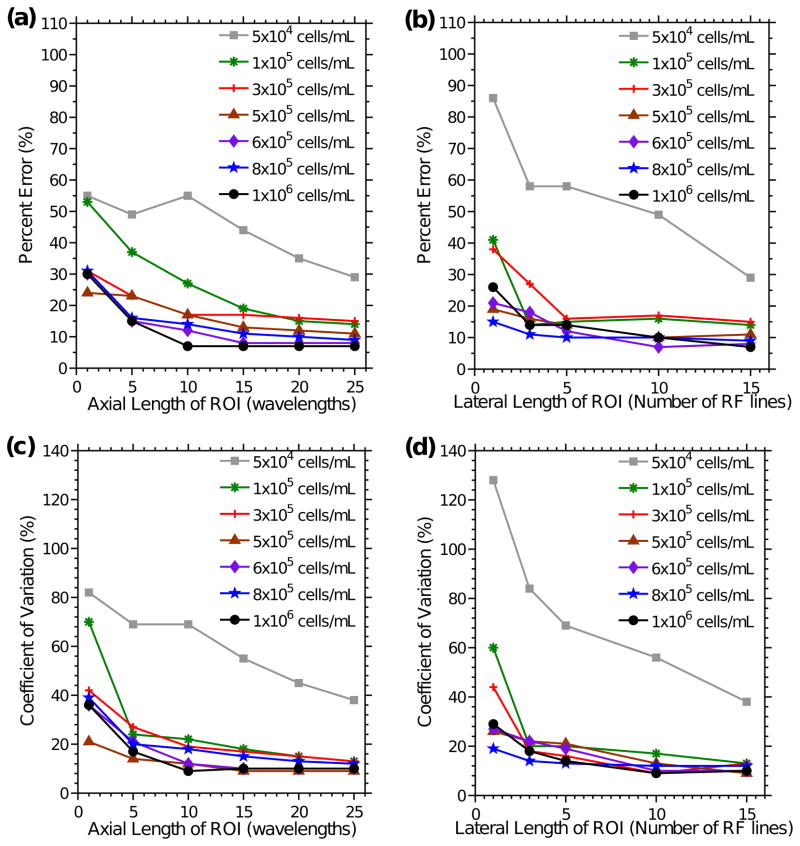
The accuracy of the IBC technique for different ROI dimensions was investigated by calculating the percent errors between cell concentrations estimated using the IBC and known fabrication concentrations. Percent errors were calculated for various ROI dimensions of representative imaging planes of agarose gels with cell concentrations ranging from 5×10⁴ to 1×10⁶ cells mL−1 (Figs. 6a and 6b). Figure 6a depicts percent errors for different axial lengths of the ROI, when 15 RF lines were averaged. Figure 6b depicts percent errors for various numbers of RF lines in the ROI, when the axial length was 25 wavelengths. Percent errors decreased (i.e., accuracy improved) with increasing cell concentrations and/or increasing ROI dimensions.
Figure 6.
Accuracy and precision of cell concentration estimates as a function of ROI dimension. Percent error of cell concentration estimates versus (a) the axial length of the ROI (when 15 RF lines were averaged) and (b) the number of RF lines (when the axial length of the ROI was 25 wavelengths) were determined. CVs of cell concentration estimates as a function of (c) the axial length of the ROI (when the lateral length of the ROI was 15 RF lines) and (d) the lateral length of the ROI (when the axial length of the ROI was 25 wavelengths) were calculated. Data were derived for cell concentrations of 5×10⁴ cells mL−1 (gray squares), 1×10⁵ cells mL−1 (green asterisks), 3×10⁵ cells mL−1 (red crosses), 5×10⁵ cells mL−1 (brown triangles), 6×10⁵ cells mL−1 (purple diamonds), 8×10⁵ cells mL−1 (blue stars), and 1×10⁶ cells mL−1 (black circles). Data were acquired using the 38-MHz transducer. Percent errors and CVs were estimated for 5 ROIs of a representative imaging plane for each cell concentration.
The precision of the IBC technique was investigated by calculating coefficients of variation (CVs) for IBC measurements obtained from 5 separate ROIs. CVs were calculated for various ROI dimensions of representative imaging planes of agarose gels with cell concentrations ranging from 5×10⁴ to 1×10⁶ cells mL−1 (Figs. 6c and 6d). Figure 6c presents CVs for different axial lengths of the ROI when 15 RF lines were averaged, and Figures 6d presents CVs for different numbers of RF lines in the ROI when the axial length was 25 wavelengths. CVs decreased (i.e., precision improved) with increasing cell concentration and/or increasing ROI dimensions.
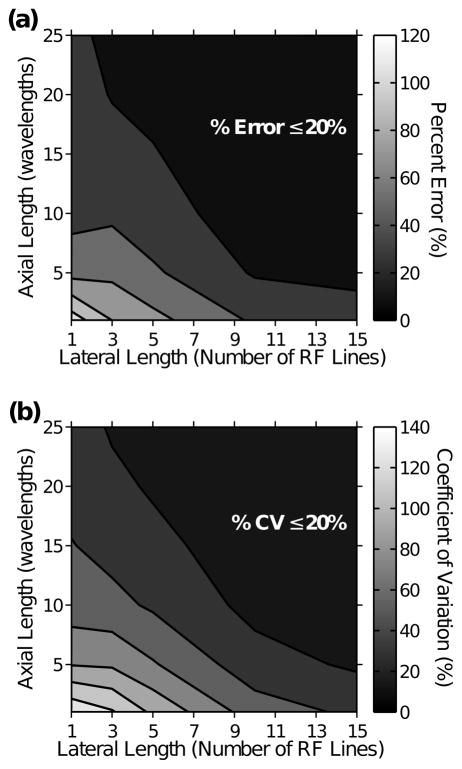
Figure 7 illustrates how appropriate ROI dimensions can be chosen for desired accuracy and precision. Percent errors (Fig. 7a) and CVs (Fig. 7b) in cell concentration estimates for different combinations of axial and lateral lengths of ROIs are shown for an agarose gel containing 1×10⁶ cells mL−1. The acceptable level of accuracy and precision for biochemical assays under development is typically less than 20% error and CV.40 Combinations of axial and lateral lengths of the ROI corresponding to less than 20% error (Fig. 7a) or 20% of the CV (Fig. 7b) are demarcated. The figure illustrates how ROI dimensions can be chosen to produce estimates of cell concentration with desired accuracy and precision. Similar percent error and CV trends were obtained for agarose gels with cell concentrations ranging from 5×10⁴ to 8×10⁵ cells mL−1 (data not shown).
Figure 7.
Accuracy and precision of cell concentration estimates for various combinations of ROI dimensions. Data are representative of an agarose gel with cell concentration of 1×10⁶ cells mL−1. (a) Percent errors and (b) CV of cell concentration estimates were calculated for ROIs with various combinations of axial and lateral lengths. Combinations of ROI dimensions corresponding to less than 20% error or 20% CV of cell concentration estimates are demarcated.
IBC technique can be used to image spatial variations in cell concentration
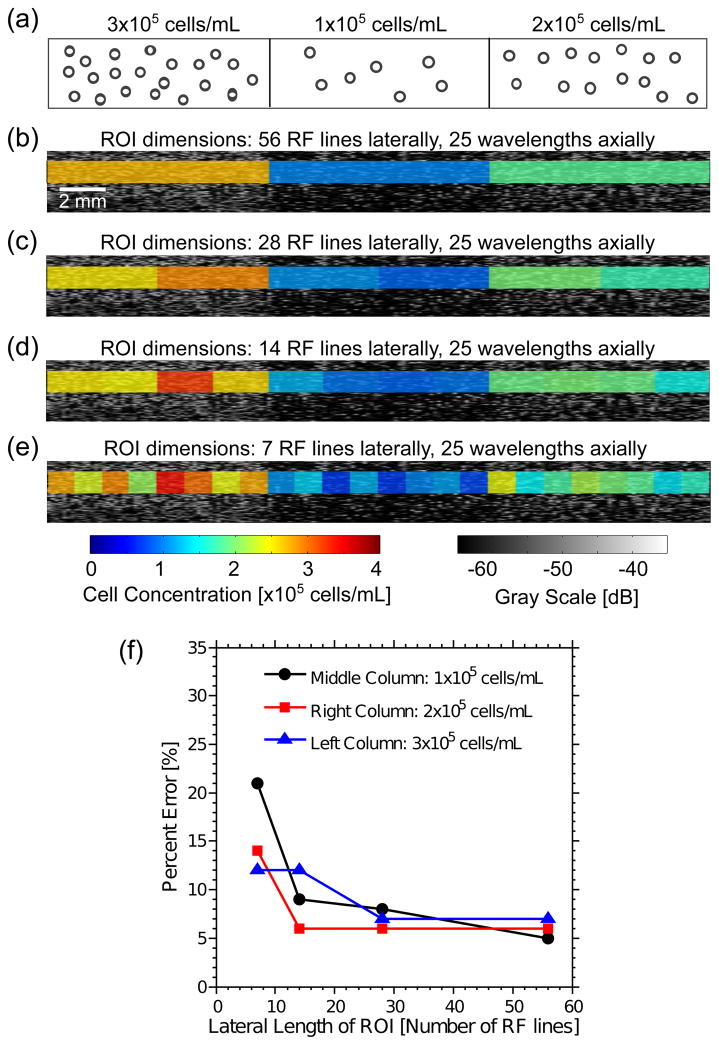
Superimposed images of B-scans and color images of cell concentration estimated from the IBC are shown in Figure 8 for a representative cell-embedded agarose gel with spatial variations in cell concentration. Cell concentrations within the left, middle, and right regions were 3×10⁵, 1×10⁵, and 2×10⁵ cells mL−1, respectively (Fig. 8a). The linear regression curve of IBC as a function of cell concentration (Fig. 5) was used to convert IBC values to concentration estimates. The IBC images were overlaid onto the corresponding qualitative B-scan images to provide quantitative visualization of the differences in cell concentrations in the gel (Fig. 8b–e). A range of ROI sizes encompassing 7 to 56 RF lines laterally and 25 wavelengths axially were investigated (Figs. 8b–e). Percent errors (Fig. 8f) decreased as the number of lines in the ROI increased, consistent with Figs. 6 and 7. Further, the percent error was less than 15% for nearly all ROIs depicted in Figure 8.
Figure 8.
Imaging cell concentrations in agarose gels fabricated with 3 regions of different cell concentrations. (a) Schematic of an agarose gel with three regions, each region with a homogeneous spatial distribution of cell concentration. The cell concentrations of the left, middle, and right columns of agarose gels were 3×10⁵, 1×10⁵, and 2×10⁵ cells mL−1, respectively. Representative B-scan image of an agarose gel, and overlaid parametric images of cell concentrations in ROIs that have (b) 56, (c) 28, (d) 14, and (e) 7 RF lines. The linear regression equation of the IBC as a function of cell concentration (Fig. 5) was used to convert IBC values to corresponding cell concentration estimates. Each ROI had an axial dimension of 25 wavelengths. (f) Average percent errors in cell concentration estimates as a function of the lateral length of ROIs in columns for each cell concentrations. Percent errors are represented as black circles for the middle column with 1×10⁵ cells mL−1, red squares for the right column with 2×10⁵ cells mL−1, and blue triangles for the left column with 3×10⁵ cells mL−1. Data were acquired using the 38-MHz transducer.
6. Discussion
The goal of this study was to employ a quantitative ultrasound technique based on the IBC to estimate cell concentrations in 3-D hydrogels noninvasively and nondestructively. A series of experiments demonstrated that the IBC can provide estimates of fibroblast concentrations in 3-D agarose constructs. The IBC increased linearly with increasing cell concentration from 5×10⁴ to 1×10⁶ cells mL−1, within the ultrasound frequency range of 13 to 47 MHz (Fig. 5). This linear relationship (i.e., “calibration curve”) can be used to estimate cell concentrations in agarose gels when the cell concentrations are not known a priori. Current standard biochemical assays (i.e., MTT28) similarly require the generation of calibration curves for estimating cell concentration. Key advantages of the IBC approach are that it is nondestructive and can provide volumetric information regarding cell concentration.
The typically accepted levels of accuracy and precision for biochemical assays under development are less than 20% error and coefficient of variation.40 We demonstrated that the ROI dimensions and the cell concentration impacted the accuracy and precision of the IBC technique. Specifically, the accuracy and precision improved with increasing ROI dimensions and cell concentration (Fig. 6). Reduced accuracy and precision with the low cell concentration of 5×10⁴ cells/mL may be due to the more sparse distribution of cells in the gels compared to those at higher cell concentrations from 1×10⁵ to 1×10⁶ cells/mL. Employing larger ROIs improves backscatter parameter estimation by averaging spectra from multiple independent RF lines and using larger axial window lengths.33,41 However, larger ROIs may limit the capacity to detect local differences in cell concentration.
ROI dimensions could be judiciously chosen to achieve the desired level of accuracy and precision in cell concentration estimates (Fig. 7). For example, we demonstrate that in order to obtain within 20% accuracy and precision for an agarose gel with 1×10⁶ cells mL−1, the ROI must contain at least 3 independent RF lines, when its axial length is 25 wavelengths (Fig. 7). Appropriate ROI dimensions could vary for other types of engineered tissues because of potentially different acoustic scattering properties. However, a similar approach can be used to choose appropriate ROI sizes to attain acceptable levels of accuracy and precision.
The IBC technique can also be used to generate parametric images of cell concentrations at different regions within engineered tissues (Fig. 8). The ability of the technique to detect spatial differences in cell concentration depends on the ROI dimensions and the desired accuracy and precision of cell concentration estimates. In the current study, we chose a model using a single cell type and hydrogel that minimized cell proliferation, migration, and extracellular matrix remodeling. However, these results suggest that the IBC method may be useful for quantitatively monitoring cell migration or proliferation within 3-D engineered tissues.
The ultrasound technique based on the IBC utilized in the present study provides an initial demonstration that quantitative ultrasound approaches may be used to estimate cell concentration in engineered tissues. Several limitations of the current technique must be overcome in order to translate this methodology to more complex biomaterials. For instance, because the IBC theory was derived under the assumption that the scatterer distribution was homogeneous, the relationship between the IBC and cell concentration may not be linear when cells are spatially arranged in an organized, periodic pattern.13,14 In addition, although cells are weak scatterers, if the cell concentration is high enough, the assumption that multiple scattering is negligible may no longer hold, thus requiring other scattering models.42–44 Previous work by Couture45 demonstrated theoretically that the distance between the outer membranes of adjacent cells would have to be less than the diameter of one individual cell for multiple scattering to occur. Theoretical studies by Saha and Kolios46 have shown that an increase in the variance in cell size also affects ultrasound backscatter estimates. Thus, other scattering models will be needed to produce accurate backscatter estimates in engineered tissues with multiple cell types of various dimensions.46
In this paper, we demonstrate the utility of the IBC parameter as a metric for quantifying cell concentration within 3-D cell-embedded hydrogels. The technology can be implemented in sterile environments required for tissue engineering and holds potential for translation to characterization of engineered tissues in vivo post-implantation. Furthermore, the integration of the technique into a commercial high frequency ultrasound scanner could provide for quantitative assessment of engineered tissue volumes in real time.
Supplementary Material
Acknowledgments
The authors thank Sally Z. Child, M.S., and Stephen McAleavey, Ph.D. (University of Rochester) for technical assistance and helpful discussions. This work was supported, in part, by National Institutes of Health Grant EB008368.
Footnotes
Conflicts of Interest: No conflicts of interest exist.
References
- 1.Pancrazio JJ, Wang F, Kelley CA. Enabling tools for tissue engineering. Biosens Bioelectron. 2007;22:2803–2811. doi: 10.1016/j.bios.2006.12.023. [DOI] [PubMed] [Google Scholar]
- 2.Advancing tissue science and engineering: a foundation for the future. A multi-agency strategic plan. Tissue Eng. 2007;13:2825–2826. doi: 10.1089/ten.2007.1503. [DOI] [PubMed] [Google Scholar]
- 3.Kreitz S, Dohmen G, Hasken S, Schmitz-Rode T, Mela P, Jockenhoevel S. Nondestructive method to evaluate the collagen content of fibrin-based tissue engineered structures via ultrasound. Tissue Eng Part C, Methods. 2011;17:1021–1026. doi: 10.1089/ten.TEC.2010.0669. [DOI] [PubMed] [Google Scholar]
- 4.Solorio L, Babin BM, Patel RB, Mach J, Azar N, Exner AA. Noninvasive characterization of in situ forming implants using diagnostic ultrasound. J Controlled Release. 2010;143:183–190. doi: 10.1016/j.jconrel.2010.01.001. [DOI] [PMC free article] [PubMed] [Google Scholar]
- 5.Fite BZ, Decaris M, Sun Y, Sun Y, Lam A, Ho CK, Leach JK, Marcu L. Noninvasive multimodal evaluation of bioengineered cartilage constructs combining time-resolved fluorescence and ultrasound imaging. Tissue Eng Part C, Methods. 2011;17:495–504. doi: 10.1089/ten.tec.2010.0368. [DOI] [PMC free article] [PubMed] [Google Scholar]
- 6.Oe K, Miwa M, Nagamune K, Sakai Y, Lee SY, Niikura T, Iwakura T, Hasegawa T, Shibanuma N, Hata Y, Kuroda R, Kurosaka M. Nondestructive evaluation of cell numbers in bone marrow stromal cell/beta-tricalcium phosphate composites using ultrasound. Tissue Eng Part C, Methods. 2010;16:347–353. doi: 10.1089/ten.TEC.2008.0564. [DOI] [PubMed] [Google Scholar]
- 7.Lizzi FL, Astor M, Liu T, Deng C, Coleman D, Silverman R. Ultrasonic spectrum analysis for tissue assays and therapy evaluation. Int J of Imag Sys Tech. 1997;8:3–10. [Google Scholar]
- 8.Gudur M, Rao RR, Hsiao YS, Peterson AW, Deng CX, Stegemann JP. Noninvasive, quantitative, spatiotemporal characterization of mineralization in three-dimensional collagen hydrogels using high-resolution spectral ultrasound imaging. Tissue Eng Part C, Methods. 2012;18:935–946. doi: 10.1089/ten.tec.2012.0180. [DOI] [PMC free article] [PubMed] [Google Scholar]
- 9.Ghoshal G, Oelze ML, O’Brien WD. Quantitative ultrasound history and successes. In: Mamou J, Oelze ML, editors. Quantitative Ultrasound in Soft Tissues. New York: Springer; 2013. pp. 21–42. [Google Scholar]
- 10.Szabo TL. Diagnostic Ultrasound Imaging: Inside Out. Massachusetts: Elsevier Academic Press; 2004. pp. 243–269.pp. 442–444. [Google Scholar]
- 11.Taggart LR, Baddour RE, Giles A, Czarnota GJ, Kolios MC. Ultrasonic characterization of whole cells and isolated nuclei. Ultrasound Med Biol. 2007;33:389–401. doi: 10.1016/j.ultrasmedbio.2006.07.037. [DOI] [PubMed] [Google Scholar]
- 12.Raju BI, Swindells KJ, Gonzalez S, Srinivasan MA. Quantitative ultrasonic methods for characterization of skin lesions in vivo. Ultrasound Med Biol. 2003;29:825–838. doi: 10.1016/s0301-5629(03)00009-7. [DOI] [PubMed] [Google Scholar]
- 13.Insana MF, Wagner RF, Brown DG, Hall TJ. Describing small-scale structure in random media using pulse-echo ultrasound. J Acoust Soc Am. 1990;87:179–192. doi: 10.1121/1.399283. [DOI] [PMC free article] [PubMed] [Google Scholar]
- 14.Insana MF, Hall TJ. Parametric ultrasound imaging from backscatter coefficient measurements: image formation and interpretation. Ultrason Imag. 1990;12:245–267. doi: 10.1177/016173469001200402. [DOI] [PubMed] [Google Scholar]
- 15.Zhang D, Gong XF, Ye SG. Acoustic nonlinearity parameter tomography for biological specimens via measurements of the second harmonics. J Acoust Soc Am. 1996;99:2397–2402. doi: 10.1121/1.415427. [DOI] [PubMed] [Google Scholar]
- 16.Libgot-Calle R, Ossant F, Gruel Y, Lermusiaux P, Patat F. High frequency ultrasound device to investigate the acoustic properties of whole blood during coagulation. Ultrasound Med Biol. 2008;34:252–264. doi: 10.1016/j.ultrasmedbio.2007.06.018. [DOI] [PubMed] [Google Scholar]
- 17.Lizzi FL, Astor M, Feleppa EJ, Shao M, Kalisz A. Statistical framework for ultrasonic spectral parameter imaging. Ultrasound Med Biol. 1997;23:1371–1382. doi: 10.1016/s0301-5629(97)00200-7. [DOI] [PubMed] [Google Scholar]
- 18.Kolios MC, Czarnota GJ, Lee M, Hunt JW, Sherar MD. Ultrasonic spectral parameter characterization of apoptosis. Ultrasound Med Biol. 2002;28:589–597. doi: 10.1016/s0301-5629(02)00492-1. [DOI] [PubMed] [Google Scholar]
- 19.Waag RC, Lee PPK, Lerner RM, Hunter LP, Gramiak R, Schenk EA. Ultrasound in Medicine. 1978. Angle scan and frequency-swept ultrasonic scattering characterization of tissue; pp. 563–565. [Google Scholar]
- 20.Lizzi F, Ostromogilsky M, Feleppa E, Rorke M, Yaremko M. Relationship of ultrasonic spectral parameters to features of tissue microstructure. IEEE Trans Ultrason Ferr. 1986;33:319–329. doi: 10.1109/t-uffc.1987.26950. [DOI] [PubMed] [Google Scholar]
- 21.Brand S, Weiss EC, Lemor RM, Kolios MC. High frequency ultrasound tissue characterization and acoustic microscopy of intracellular changes. Ultrasound Med Biol. 2008;34:1396–1407. doi: 10.1016/j.ultrasmedbio.2008.01.017. [DOI] [PubMed] [Google Scholar]
- 22.Katouzian A, Sathyanarayana S, Baseri B, Konofagou EE, Carlier SG. Challenges in atherosclerotic plaque characterization with intravascular ultrasound (IVUS): From data collection to classification. IEEE Trans Inform Tech Biomed. 2008;12:315–327. doi: 10.1109/titb.2007.912352. [DOI] [PubMed] [Google Scholar]
- 23.Leithem SM, Lavarello RJ, O’Brien WD, Oelze ML. Estimating concentration of ultrasound contrast agents with backscatter coefficients: Experimental and theoretical aspects. J Acoust Soc Am. 2012;131:2295–2305. doi: 10.1121/1.3681951. [DOI] [PMC free article] [PubMed] [Google Scholar]
- 24.Vlad RM, Brand S, Giles A, Kolios MC, Czarnota GJ. Quantitative ultrasound characterization of responses to radiotherapy in cancer mouse models. Clinical Cancer Research. 2009;15:2067–2075. doi: 10.1158/1078-0432.CCR-08-1970. [DOI] [PubMed] [Google Scholar]
- 25.Kemmerer JP, Oelze ML. Ultrasonic assessment of thermal therapy in rat liver. Ultrasound Med Biol. 2012;38:2130–2137. doi: 10.1016/j.ultrasmedbio.2012.07.024. [DOI] [PMC free article] [PubMed] [Google Scholar]
- 26.Raju BI, Srinivasan MA. High-frequency ultrasonic attenuation and backscatter coefficients of in vivo normal human dermis and subcutaneous fat. Ultrasound Med Biol. 2001;27:1543–1556. doi: 10.1016/s0301-5629(01)00456-2. [DOI] [PubMed] [Google Scholar]
- 27.Machado JC, Foster FS. Ultrasonic integrated backscatter coefficient profiling of human coronary arteries in vitro. IEEE Trans Ultrason Ferr. 2001;48:17–27. doi: 10.1109/58.895900. [DOI] [PubMed] [Google Scholar]
- 28.Garvin KA, Hocking DC, Dalecki D. Controlling the spatial organization of cells and extracellular matrix proteins in engineered tissues using ultrasound standing wave fields. Ultrasound Med Biol. 2010;36:1919–1932. doi: 10.1016/j.ultrasmedbio.2010.08.007. [DOI] [PMC free article] [PubMed] [Google Scholar]
- 29.Reid JM. Standard substitution methods for measuring ultrasonic scattering in tissues. In: Shung KK, Thieme GA, editors. Ultrasonic Scattering in Biological Tissues. Boca Raton, FL: CRC Press; 1993. pp. 171–204. [Google Scholar]
- 30.McCormick MM, Madsen EL, Deaner ME, Varghese T. Absolute backscatter coefficient estimates of tissue-mimicking phantoms in the 5–50 MHz frequency range. J Acoust Soc Am. 2011;130:737–743. doi: 10.1121/1.3605669. [DOI] [PMC free article] [PubMed] [Google Scholar]
- 31.Bamber JC. Ultrasonic properties of tissues. In: Duck FA, Baker AC, Starritt HC, editors. Ultrasound in Medicine. Bristol, UK: Institute of Physics Publishing; 1998. pp. 57–88. [Google Scholar]
- 32.Pinkerton JMM. The absorption of ultrasonic waves in liquids and its relation to molecular constitution. Proc Phys Soc. 1949;62:129–141. [Google Scholar]
- 33.Oelze ML, O’Brien WD., Jr Defining optimal axial and lateral resolution for estimating scatterer properties from volumes using ultrasound backscatter. J Acoust Soc Am. 2004;115:3226–3234. doi: 10.1121/1.1739484. [DOI] [PubMed] [Google Scholar]
- 34.Zagzebski JA, Yao LX, Boote EJ, Lu ZF. Quantitative backscatter imaging. In: Shung KK, Thieme GA, editors. Ultrasonic Scattering in Biological Tissues. Boca Raton, FL: CRC Press; 1993. pp. 451–486. [Google Scholar]
- 35.Lizzi FL, Greenebaum M, Feleppa EJ, Elbaum M, Coleman DJ. Theoretical framework for spectrum analysis in ultrasonic tissue characterization. J Acoust Soc Am. 1983;73:1366–1373. doi: 10.1121/1.389241. [DOI] [PubMed] [Google Scholar]
- 36.Bendat JS, Piersol AG. Random Data Analysis and Measurement Procedures. New York, NY: John Whiley & Sons, Inc; 2000. p. 93. [Google Scholar]
- 37.Kemmerer JP, Oelze ML. Quantitative ultrasound assessment of thermal therapy in liver. J Acoust Soc Am. 2011;129:2440. [Google Scholar]
- 38.Roberjot V, Bridal SL, Laugier P, Berger G. Absolute backscatter coefficient over a wide range of frequencies in a tissue-mimicking phantom containing two populations of scatterers. IEEE Trans Ultrason Ferr. 1996;43:970–978. [Google Scholar]
- 39.Wagner RF, Insana MF, Brown DG. Statistical properties of radiofrequency and envelope-detected signals with applications to medical ultrasound. J Opt Soc Am. 1987;4:910–922. doi: 10.1364/josaa.4.000910. [DOI] [PMC free article] [PubMed] [Google Scholar]
- 40.Guidance for Industry: Bioanalytical Method Validation. F. D. A. US Department of Health and Human Services, Center for Drug Evaluation and Research; Rockville, MD: 2001. [Google Scholar]
- 41.Liu W, Zagzebski JA. Trade-offs in data acquisition and processing parameters for backscatter and scatterer size estimations. IEEE Trans Ultrason Ferr. 2010;57:340–352. doi: 10.1109/TUFFC.2010.1414. [DOI] [PMC free article] [PubMed] [Google Scholar]
- 42.Aubry A, Derode A. Multiple scattering of ultrasound in weakly inhomogeneous media: Application to human soft tissues. J Acoust Soc Am. 2011;129:225–233. doi: 10.1121/1.3506343. [DOI] [PubMed] [Google Scholar]
- 43.Saha RK, Franceschini E, Cloutier G. Assessment of accuracy of the structure-factor-size-estimator method in determining red blood cell aggregate size from ultrasound spectral backscatter coefficient. J Acoust Soc Am. 2011;129:2269–2277. doi: 10.1121/1.3561653. [DOI] [PMC free article] [PubMed] [Google Scholar]
- 44.Franceschini E, Guillermin R. Experimental assessment of four ultrasound scattering models for characterizing concentrated tissue-mimicking phantoms. J Acoust Soc Am. 2012;132:3735–3747. doi: 10.1121/1.4765072. [DOI] [PubMed] [Google Scholar]
- 45.Couture O. PhD Thesis. Graduate Department in Medical Biophysics, University of Toronto; Toronto: 2007. Ultrasound echoes from targeted contrast agents. [Google Scholar]
- 46.Saha RK, Kolios MC. Effects of cell spatial organization and size distribution on ultrasound backscattering. IEEE Trans Ultrason Ferr. 2011;58:2118–2131. doi: 10.1109/TUFFC.2011.2061. [DOI] [PubMed] [Google Scholar]
Associated Data
This section collects any data citations, data availability statements, or supplementary materials included in this article.


