

Abstract
α-Synuclein (α-syn) is an abundant neuronal protein associated with Parkinson’s disease that is disordered in solution, but exists in equilibrium between a bent- and an elongated-helix on negatively charged membranes. Here, neutron reflectometry (NR) and fluorescence spectroscopy were employed to uncover molecular details of the interaction between α-syn and two anionic lipids, phosphatidic acid (PA) and phosphatidylserine (PS). Both NR and site-specific Trp measurements indicate that penetration depth of α-syn is similar for either PA- or PS-containing membranes (~9–11 Å from bilayer center) even though there is a preference for α-syn binding to PA. However, closer examination of the individual Trp quenching profiles by brominated lipids reveal differences into local membrane interactions especially at position 39 where conformational heterogeneity was observed. The data also indicate that while W94 penetrates the bilayer as deeply as W4, W94 resides in a more polar surrounding. Taken together, we suggest the N- and C-terminal regions near positions 4 and 94 are anchored to the membrane, while the putative linker spanning residue 39 samples multiple conformations, which are sensitive to the chemical nature of the membrane surface. This flexibility may enable α-syn to bind diverse biomembranes in vivo.
Keywords: circular dichroism, fluorescence, neutron reflectometry, protein-lipid interaction, tryptophan
INTRODUCTION
Intracellular inclusions (Lewy bodies) containing α-synuclein (α-syn) fibrillar aggregates are hallmarks of Parkinson’s disease (PD).1 Missense mutations as well as gene duplication and triplication of the SNCA gene encoding for α-syn are linked to early-onset familial PD,2–8 supporting the causative role of α-syn in neurodegeneration. While α-syn is abundant in presynaptic neuronal terminals,9–10 its overexpression leads to inhibition of neurotransmitter release11 and enhanced intercellular migration of excess α-syn.12–13 Overexpression of α-syn has also been reported to disrupt the integrity of cellular membranes and induce Golgi fragmentation,14–15 mitochondrial fission,16 and lysosomal malfunction.17 Despite much research, the exact biological function of α-syn remains ill-defined, though it is thought to affect synaptic vesicle trafficking and brain lipid metabolism.18–21 Specifically, α-syn is suggested to play a role in neuronal plasticity by binding to synaptic vesicles,9,20–22 sensing membrane curvature,23 and remodeling vesicle shape.24–27 Understanding α-syn-membrane interaction is a critical step in elucidating the physiological functions of α-syn as well as its pathological relevance to PD. 28–30
α-Syn is 140 amino acids in length and is characterized as an intrinsically disordered protein31–34 (for a differing view35–36). The first 89 residues contain seven imperfect 11-residue amphipathic repeats (XKTKEGVXXXX) responsible for membrane binding.37 The hydrophobic non-amyloid β component (NAC) is composed of residues 61–95. The C-terminal residues (96–140) are highly negatively charged with 15 carboxylic amino acids. The protein undergoes an unstructured-to-α-helical transition upon binding sodium dodecyl sulfate (SDS) micelles or anionic phospholipid vesicles of varying sizes and compositions.28,37–39
It is currently accepted that α-syn adopts two conformations upon binding to membranes: a bent helix40–45 or an elongated helix.46–49 In the presence of the highly curved SDS micellar surface, α-syn forms the bent helix, where two anti-parallel helices are connected by a flexible linker at residues 38–44.43 In contrast, α-syn primarily adopts an elongated helix upon binding to anionic phospholipid vesicles with a reported periodicity of 3.67 amino acids per turn.46 To establish an amphipathic helix with lysine residues arranged at the interfacial headgroup/water region, there is an interruption in the helical periodicity between residues 52 and 57.46 Although the elongated helix is a favorable conformation for α-syn upon phospholipid vesicle binding, the bent helix is also detectable.50 Interconversion between these two structures could possibly contribute to its misfolded aggregation states.51 However, it is unclear which one is related to its physiological function and if and which one of these conformers is more aggregation prone.
In addition to electrostatics, α-syn membrane binding affinity also depends on the specific anionic headgroup.52–54 In our work,24,38–39 we had used zwitterionic phosphatidylcholine (PC) and anionic phosphatidic acid (PA) containing vesicles because PC is the most abundant phospholipid in all mammalian membranes and PA is bound most strongly by α-syn compared to other anionic lipids such as phosphatidylglycerol (PG) and phosphatidylserine (PS). Here, we have extended our study to directly compare PA to PS (Figure 1). Both PA and PS carry the same charge at pH 7 though PS is more abundant (~12%) in synaptic vesicles55 than PA. Despite its lower amount, PA levels have been found to increase with age56–57 whereas PS levels decrease;56 thus, PA may modulate α-syn membrane binding with age.
Figure 1.
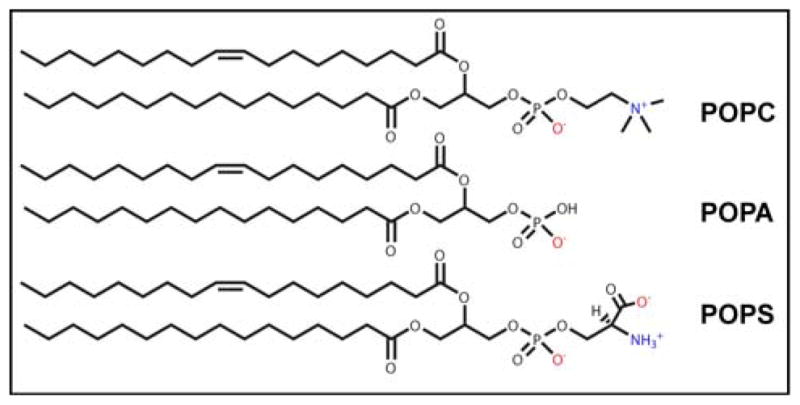
Chemical structure of POPC, POPA and POPS. Negative and positive charges are in red and blue, respectively.
To uncover molecular details of the interaction between α-syn and PA- and PS-membranes, we employed circular dichroism (CD) spectroscopy, neutron reflectometry (NR), and fluorescence spectroscopy. CD spectroscopy probes secondary structure formation and was used to assess vesicle binding affinities. NR is a scattering technique used to characterize interfacial thin film properties such as thickness, density and roughness. In our case, we structurally characterized the association of α-syn with a solid-supported sparsely tethered bilayer lipid membrane (stBLM) composed of either equimolar 1-palmitoyl-2-oleoyl-sn-glycero-3-phosphocholine and 1-palmitoyl-2-oleoyl-sn-glycero-3-phosphate (POPC/POPA) or POPC and 1-palmitoyl-2-oleoyl-sn-glycero-3-phospho-L-serine (POPC/POPS). By taking advantage of neutron scattering length density differences between protons and deuterons, deuterated α-syn and lipid molecules with protiated acyl chains were used. Acyl chain and phosphate headgroup strata of the bilayer are readily distinguished and the location of membrane-bound protein is revealed.38,58–59 α-Syn bilayer penetration depth and extension into the bulk solvent and changes in bilayer properties (e.g. thickness) due to protein association have been obtained. Residue-level information on the local environments and penetration depths of PA- versus PS-bound α-syn were determined at four specific tryptophan sites, W4, W39, W94, and W136, by steady-state fluorescence measurements and time-resolved fluorescence quenching by brominated phospholipids.
MATERIALS AND METHODS
Chemicals
Phospholipids: 1-palmitoyl-2-oleoyl-sn-glycero-3-phosphocholine (POPC), 1-palmitoyl-2-oleoyl-sn-glycero-3-phosphate (sodium salt) (POPA), 1-palmitoyl-2-oleoyl-sn-glycero-3-phospho-L-serine (sodium salt) (POPS), 1-palmitoyl-2-(6,7-dibromo)stearoyl-sn-glycero-3-phosphocholine (Br6-7), 1-palmitoyl-2-(9,10-dibromo)stearoyl-sn-glycero-3-phosphocholine (Br9-10), and 1-palmitoyl-2-(11,12-dibromo)stearoyl-sn-glycero-3-phosphocholine (Br11-12) were purchased from Avanti Polar Lipids, Inc. (Alabaster, AL) and used as received. All buffer salts were purchased from Sigma-Aldrich (St. Louis, MO).
Protein Expression, Purification, and Preparation
Recombinant human wild-type (WT) α-syn and Trp mutants were expressed in BL21(DE3) pLysS cells and purified as previously described.39 Uniformly deuterated and 15N-labeled α-syn (denoted as D-α-syn) was produced by following a reported procedure.60 An M9 medium in D2O containing 0.3 g/L 2H/15N Isogro (Sigma-Aldrich), 1 g/L 15NH4Cl, and 3 g/L D7,12C6-D-glucose (Cambridge Isotope Laboratories, Inc.) was used. A starter Luria Broth (Sigma-Aldrich) culture (200 μL) was added to 50 mL of D2O M9 minimal medium at 37 °C with shaking (174 rpm or 2.9 Hz) in the presence of chloramphenicol (34 μg/mL) and ampicillin (100 μg/mL) and grown overnight. The 50 mL culture was then transferred to 950 mL of the 2H/15N M9 minimal medium and grown to an optical density of 0.8 at 600 nm (37 °C and 174 rpm or 2.9 Hz), at which point 1 mM (M = mol/L) isopropyl β-D-1-thiogalactopyranoside was added. Cells were harvested after 4 h. D-α-syn was purified similarly as WT protein. Protein concentrations were determined using a molar extinction coefficient estimated on the basis of amino-acid content: ε280 nm = 5,120 M−1 cm−1 (WT and D-α-syn); ε280 nm = 10,810 M−1 cm−1 (F4W and F94W); and ε280 nm = 9,970 M−1 cm−1 (Y39W and Y136W). Homogeneity of samples was assessed by SDS-PAGE and silver staining. Protein molecular weights were confirmed by ESI-MS (NHLBI Biochemistry Core Facility). The measured mass for D-α-syn is 15,405 Da in H2O. Because 15NH4Cl is the sole nitrogen source, we assume 100% 15N incorporation; the measured mass corresponds to a 99% deuteration. Purified proteins were flash-frozen in liquid N2 and stored at −80 °C until use. To form fibrils, protein solution was exchanged into pH 7 buffer (10 mM sodium phosphate (NaPi), 100 mM NaCl) using a PD-10 column (GE Healthcare) and filtered (YM100 membranes, Millipore) to remove any preformed aggregates immediately prior to aggregation. α-Syn (100 μM) was incubated in eppendorf tubes at 37 °C, shaken at 600 rpm (10 Hz) for ~3 d using a Mini-Micro 980140 shaker (VWR).
Unilamellar Vesicle Preparation
Lipids were prepared and stored in chloroform/methanol (2:1) stock solutions at −20 °C. Mixed multilamellar vesicles were first prepared by drying appropriate amounts of lipid stock solutions under a N2 stream. Subsequently, samples were kept in a vacuum desiccator for at least 2 h to remove trace organic solvent. The lipid mixtures (typically 5 mM) were resuspended in the appropriate buffer solution (pH 5.5 buffer: 20 mM sodium acetate (NaOAc), 100 mM NaCl; pH 7: 10 mM NaPi, 100 mM NaCl) and vortexed at least 3 times for 60 s. The multilamellar vesicle solution was extruded 31 times through a 50-nm diameter polycarbonate membrane (Whatman, GE Healthcare) using an extrusion kit (Avanti Polar Lipids, Alabaster, Al). Vesicle size was determined by dynamic light scattering at 25 °C using 5X diluted lipid sample (~1 mM) on a Dynapro NanoStar (Wyatt) equipped with 661 nm laser and DynamicsV7.0.2 software. The instrument ranges for correlation time and the peak cutoff are 1.5 to 6.0 × 10⁴ μs and 0.5 to 10000.0 nm, respectively. Auto-attenuation of the laser power was applied to obtain optimal intensity counts (1 × 10⁶). Ten 5-s acquisitions were collected. A cumulant fit and a sphere model were used to obtain the average hydrodynamic radius (radius ~45 nm). Vesicle size distribution (FWHM ~ 40 nm) was extracted from the regularization fit using the Rayleigh sphere model. All buffers were filtered through 0.22 μm filters (Millipore).
Preparation of Sparsely-tethered Bilayer Lipid Membranes
Au-coated silicon wafers completed with stBLMs61 were made as previously described with minor modifications.38 A mixed self-assembled monolayer (SAM) of the lipid tether compound HC18 (Z20-(Z-octadec-9-enyloxy)-3,6,9,12,15,18,22-heptaoxatetracont-31-ene-1-thiol)61 and β-mercaptoethanol (βME) was obtained by immersing the Au-coated wafers in ethanolic solutions of HC18 and βME (30:70 molar ratio, 0.2 mM final concentration) for >12 h, followed by thorough rinsing with ethanol and drying under N2. Vesicles (25 mg/mL) of the desired lipid composition were prepared by re-suspending dry lipid films in aqueous buffer (pH 5.5) with 500 mM NaCl. The suspension was sonicated for 1 h in a bath sonicator and extruded at least 30 times through a 100-nm pore size polycarbonate membrane (Whatman, GE Healthcare) using an extrusion kit (Avanti Polar Lipids, Alabaster, AL). Formation of stBLM was achieved by incubating the SAM with vesicles for 1 h followed by rinsing with copious amounts of aqueous buffer containing 100 mM NaCl to remove non-fused vesicles.
Circular Dichroism Spectroscopy
CD measurements (200 to 260 nm, 1 nm bandwidth, in continuous mode with a 100-nm/min scan rate) were performed in 1-mm quartz cuvettes using a Jasco J-715 spectropolarimeter (Jasco Analytical Instruments). Each experiment is reported as an average of 3 accumulated scans performed at 25 °C. The mean residue ellipticity was calculated using eq 1.
| (1) |
θ is the measured CD signal in mdeg, c is the protein concentration in mM, l is the path length in cm, and n is the number of amino acids. Binding of protein to vesicles was quantified using [Θ]222 nm and fit to a two-state equilibrium where the protein partitions between the lipid bilayer and the solution using eq 2.
| (2) |
C is the concentration of lipids, Kp is the partition coefficient of the protein, F∞ is the saturating value of [Θ]222 nm, and F0 is the minimum value of [Θ]222 nm. The value C is multiplied by 0.6 in both the numerator and the denominator because only lipids in the outer leaflet are accessible for protein binding. Data were analyzed using IGOR PRO 6.2 (WaveMetrics).
Transmission Electron Microscopy
Aggregated α-syn samples (3 μL) were put on TEM grids (400-mesh formvar and carbon coated copper, Electron Microscopy Sciences) at RT. After 1 min, sample solution was wicked with filter paper followed by a quick wash with water (3 μL) to remove excess material and to obtain adequate background contrast. Then, ~3 drops of 1% (w/v) aqueous uranyl acetate solution were added and wicked immediately with filter paper and air dried. TEM was performed using a JEOL JEM 1200EX transmission electron microscope (accelerating voltage 80 keV) equipped with an AMT XR-60 digital camera (NHLBI EM Core Facility).
Neutron Reflectivity Measurements
Neutron reflectivity measurements were performed at RT with the NG7 reflectometer at the NIST Center for Neutron Research (NCNR),62 using a neutron wavelength of 4.75 Å. Neutron reflectivity was recorded for momentum transfer values between 0.008 and 0.25 Å−1. stBLMs were prepared and measured in a NCNR reflectometry flow cell, which allows for in situ buffer and sample exchange, and, therefore, subsequent measurements are taken on the same sample footprint.63 NR data were first collected from the neat stBLM (POPC/POPA or POPC/POPS) sequentially immersed in D2O- and H2O-based aqueous buffers (contrasts). Thereafter, 3 μM protein solutions in each contrast were sequentially added to the stBLM and measured. For each measured contrast, adequate counting statistics were obtained after ~7 h.
Neutron Reflectometry Data Analysis
NR data were evaluated with garefl and Refl1D.62 A Monte-Carlo Markov chain algorithm was used to provide a quantitative measure of model parameter confidence limits and parameter correlations.63 The 1D-structural profile along the lipid bilayer normal was modeled as previously reported59 using a hybrid of a stratified slab model for the solid substrate (bulk silicon, the silicon oxide, the chromium, and the gold layer), a continuous distribution model for the stBLM, and a monotonic Hermite spline for the model-free envelope of the protein. Fit parameters for the stratified slabs are thickness and neutron scattering length density (nSLD) for each substrate layer, except for the bulk silicon. One global roughness fit parameter applies to all substrate interfaces. Individual sub-molecular groups implemented in the continuous distribution model are: βME, tether PEG chains, tether glycerol groups, substrate-proximal and substrate-distal PC and PA (or PS) headgroups, substrate-proximal and substrate-distal methylene and methyl chains of lipid and tether molecules. Fit parameters are the bilayer hydrocarbon thickness for each bilayer leaflet, bilayer completeness, tether surface density, tether thickness, and βME surface density. One roughness fit parameter is applied to all distributions. The volume occupancy profile of the protein is defined by a Hermite spline with control points that are on average 15 Å apart. The number of control points is dependent on the spatial protein extension along the bilayer normal and is determined iteratively during model optimization. Fit parameters for each control point are the volume occupancy of the envelope and the deviation from a position defined by equidistant control points throughout the spline. A constant nSLD is applied to the spline calculated for D-α-syn (5.85 × 10⁻⁶ Å−2 in H2O and 7.12 × 10⁻⁶ Å−2 in D2O).
Steady-state Fluorescence Spectroscopy
Trp fluorescence was measured (λex = 295 nm, λobs = 300–500 nm, 0.3-s integration time, 1 nm slits, 25 °C) in 1-cm quartz cuvettes using a Fluorolog 3 spectrofluorometer (Horiba Jobin Yvon). The spectra were fit with eq 3.64–65
| (3) |
λmax is the wavelength at which maximum intensity is observed, I0 is the intensity at λmax, and Γ is the full width at half maximum (FWHM) of the peak. The fit parameter ρ describes the asymmetry of the distribution. The parameter ρ ranges from 1.4 to 1.6, with one exception, W39 bound to POPC/POPA, which has a ρ value of 1.8.
Time-resolved Trp Fluorescence Measurements
Trp fluorescence decay kinetics were measured using the fourth harmonic (292 nm) of a regeneratively amplified femtosecond Ti:sapphire (1 kHz, Clark-MXR) pumped optical parametric amplifier laser (Light Conversion) as an excitation source (30–75 μW, 1 kHz) and a picosecond streak camera (Hamamatsu C5680) in photon counting mode for detection (λobs = 325–400 nm). Protein samples in the absence and presence of brominated lipids were deoxygenated with five repeated evacuation/Ar-fill cycles using a Schlenk line. Temperature was maintained at 25 °C using a custom-built temperature controlled cuvette holder and circulating water bath. At least 10,000 counts were collected at the highest pixel to ensure a sufficient signal-to-noise ratio. Decay curves were integrated to obtain fluorescence intensity (F) using Matlab 7.1 (MathWorks). A mean Trp depth was obtained by Gaussian distribution analysis using eq 4 and IGOR PRO 6.2 (WaveMetrics).66
| (4) |
F0 and FBr are the measured Trp intensities in the absence and presence of Br-PC, respectively, and xm (mean depth), σ (dispersion), and S (area) describe the distribution of the quenched population.
RESULTS AND DISCUSSION
Vesicle Binding Affinity Assessed by Circular Dichroism Spectroscopy
Because α-syn forms helices upon binding to membranes containing anionic lipids, helical structure formation by α-syn was detected by CD spectroscopy, and relative binding affinities to POPC/POPA and POPC/POPS vesicles were compared. See Figure 2 inset for representative CD spectra of α-syn as a function of POPC/POPA vesicle concentration. The double negative maxima at 222 nm and 208 nm are characteristic of α-helical structure. The single isodichroic point indicates a two-state transformation from disordered (free) to α-helical (vesicle-bound). Figure 2 shows the mean residue ellipticity ([Θ]) at 222 nm as a function of lipid concentration (bottom axis) and lipid-to-protein molar ratio (L/P, top axis) for vesicles containing POPA or POPS at mildly acidic (5.5) and neutral pH (7). At pH 5.5, α-syn binds tighter to POPC/POPA (partition constant, Kp ~ 1890 ± 550 M−1) than to POPC/POPS (Kp ~ 1005 ± 390 M−1) (Figure 2). Membrane binding is reduced at pH 7 with a greater effect for POPC/POPS (Kp ~ 143 ± 23 M−1) than POPC/POPA (Kp ~ 810 ± 180 M−1). Differences in membrane binding affinities at the two different pH values show that changes in the protonation state of the protein (pI ~ 4.7) and/or the PS headgroup (apparent pKa of the carboxyl group ~ 5.567) modulate membrane association, implying that electrostatics are important factors in the α-syn–phosphatidylserine interaction. α-Syn binding to POPC/POPA is somewhat less influenced by pH, implying that the enhanced PS binding at pH 5.5 is dominated by the ionization state of the PS headgroup. This result also reinforces the idea that the N-terminal region which contains the 7 imperfect lysine-rich repeats is predominately responsible for the formation of the amphipathic helix. So, even though PA is more negatively charged than PS at pH 5.5 due to its lower pKa (3.0),68 any increased repulsion from the last C-terminal 37 residues does not override the binding of the distal N-terminal amphipathic site.
Figure 2.

pH-Dependent α-syn (5 μM) binding to POPA- and POPS-containing POPC vesicles assessed by CD spectroscopy. Mean residue ellipticity at 222 nm ([Θ]222 nm) is plotted as a function of lipid-to-protein molar ratio (L/P, top) and lipid concentration (bottom) for POPC/POPA (solid circles) and POPC/POPS (open circles) at pH 5.5 (red) and pH 7 (black). Representative data are shown, with fits shown as solid lines (POPC/POPA: Kp = 2050 and 1000 M−1 for pH 5.5 and 7, respectively; POPC/POPS: Kp = 600 and 180 M−1 for pH 5.5 and 7, respectively). Inset: Representative far-UV CD titration of α-syn (5 μM) as POPA/POPC vesicles are increased (0–4 mM) at pH 7.
Position of α-Syn in POPC/POPA and POPC/POPS Membranes Determined by Neutron Reflectometry
Preference of α-syn for binding PA-containing vesicles reflects differences in the nature of interaction between α-syn and each of these phospholipids. In particular, we investigated whether this difference manifests itself in varying α-syn bilayer penetration depths by studying protein association to POPA- or POPS-containing stBLM using NR. A great advantage of NR is that both protein position and changes in the phospholipid bilayer upon protein binding can be measured simultaneously.38,58 Moreover, the use of deuterated α-syn readily distinguishes the position of the protein in a protiated lipid environment by the differences in neutron scattering of deuterons versus protons. To ascertain that perdeuteration does not change membrane binding affinity of α-syn, a CD titration was performed (Figure 3) and similar Kp values of 1000 and 900 M−1 were obtained for WT and D-α-syn, respectively. In addition, the ability for D-α-syn to fibrillate was verified. Fibrils formed from D-α-syn had no apparent morphological differences as visualized by transmission electron microscopy (Figure 3 inset).
Figure 3.

Comparison of membrane binding and aggregation properties of protiated (WT) versus deuterated α-syn (D-α-syn). Mean residue ellipticity at 222 nm ([Θ]222 nm) is plotted as a function of lipid-to-protein molar ratio (L/P) for POPC/POPA vesicles in pH 7 buffer at 25 °C. Inset: TEM images of amyloid fibrils formed by WT and D-α-syn in pH 7 buffer at 37 °C. Scale bar is 100 nm.
stBLMs composed of equimolar POPC and either POPA or POPS were made at mildly acidic (pH 5.5) conditions to enhance α-syn binding to PS. After measuring the neat bilayer alone, D-α-syn was added and reflectivity curves were collected in two buffer contrasts. Representative H2O reflectivity curves from multiple sets for the stBLM alone and with D-α-syn added are shown in Figures 4A and 4B. Significant differences are observed in the reflectivity curves (ΔR/RF) upon the addition of α-syn up to 4 standard deviations (σ) at low momentum transfer Qz values ≤ 0.15 Å−1 (lower panels in Figures 4A and 4B). Smaller changes were seen for the case of POPC/POPS stBLM associated with the lower of amount of protein bound (vide infra). Best-fit neutron scattering length density (nSLD) profiles are shown in the insets. Fitting the reflectivity curve with a monotonic Hermite spline model yields the cross section area distribution (volume occupancy) normal to the membrane (Figure 4C). Consistent with our prior NR results at pH 7.4 using protiated protein and POPC/POPA, the maximum density of protein envelopes is in the outer leaflet of the bilayer. However, compared to that of the pH 7.4 data where a greater amount of protein (7% volume occupancy) extends into the solvent,38 negligible protein density is observed here. This difference could originate either from different solution conditions, i.e. pH 5.5 versus pH 7.4, or from the isotopic labeling. We favor the former explanation as it has been observed for α-syn to form more compact structures under acidic conditions.69
Figure 4.

α-Syn membrane binding probed by NR. Neutron reflectivity (R/RF) for (A) POPC/POPA and (B) POPC/POPS stBLM in the absence and presence of D-α-syn (3 μM) in H2O buffer (pH 5.5). Error bars represent 68% confidence intervals for the measured reflectivity based on Poisson statistics. Spline model fits to the data are shown as solid lines. Lower panels show the differences between reflectivity curves (ΔR/RF) plotted in units normalized to the S.D. value (σ) of the experimental error. Best-fit neutron scattering length density (ρn) profiles for measurements calculated from the composition-space model are shown as insets. The zoomed-in peak region is shown with arrows. (C) Simplified molecular distributions for main molecular components of POPC/POPA and POPC/POPS stBLM, obtained from the best fit of reflectivity data. Median protein envelopes with 68% confidence intervals (dashed lines) are shown for D-α-syn. Volume occupancy is indicated on the right axis. See Table 1 for fitting parameters. (D) Corresponding integrated protein envelope profiles normalized to total residue numbers (140) for POPC/POPA (red) and POPC/POPS (black) stBLMs.
A lower volume occupancy is observed for D-α-syn in POPC/POPS stBLM (~ 8%, black) than in POPC/POPA (~ 30%, red), in accord with the CD binding data (Figure 2). The reduced binding of α-syn to POPC/POPS stBLM might also result from the preference of α-syn for curved PS-containing membranes.54 Of note, the absolute volume occupancy was particularly variable (6–11%) collected on POPC/POPS stBLM, but consistently lower compared to POPC/POPA membrane, confirming a preference of α-syn for phosphatidic acid over phosphatidylserine.
In contrast to a recent NR study on α-syn and PC/PS supported planar bilayer, where α-syn is mainly positioned in the headgroup region of the outer leaflet,58 Figure 4C clearly shows that a significant portion of α-syn is buried inside the hydrocarbon chains. The protein envelopes within 68% confidence show similar penetration of α-syn into either bilayers (~11 Å from the bilayer center). Integrating the protein envelopes and normalizing them to the total number of residues (140) yields the protein residue distribution in the membrane (Figure 4D). Even with the large difference in membrane surface coverage, the normalized integrals show a comparable number of residues (~100) that interact with both stBLMs (Figure 4D).
In addition to protein position, membrane completeness and thickness were obtained from NR (Table 1). For instance, significant membrane thinning (−1.44 ± 0.2 Å) was observed with a POPC/POPA stBLM at pH 7.4.38 In contrast, another NR study on PC/PS (7:3 molar ratio), no membrane thickness changes were observed upon D-α-syn association.58 Here, membrane thickness changes were observed in both PA- and PS-containing stBLMs after incubation with α-syn (Table 1). Unfortunately, the difference in bilayer thickness changes, i.e. thickening versus thinning, is within our 68% confidence limits so no definitive conclusion can be drawn. It is worth noting that the current method of using extruded vesicle fusion generally yields more complete bilayers (>99%) compared to what we previously achieved by rapid solvent exchange (≤94%)38 which could have an effect on the membrane property (e.g. the presence of defects). Additionally, the relative surface coverage by the protein may also impart an effect. Currently, it is not clear what factor determines membrane thinning or thickening that is induced by α-syn. Nevertheless, NR results supports the idea that α-syn remodels membrane bilayers.24–27 Self-quenching fluorescence measurements using vesicles containing fluorophore-labeled PA or PS under comparable α-syn concentration show evidence of sequestration of anionic lipids upon protein binding (data not shown). This lateral lipid reorganization would contribute to membrane thickness changes consistent with what is observed by NR.
Table 1.
Median fit parameters and 68% confidence intervals for POPC/POPA and POPC/POPS stBLMs in the absence and presence of D-α-syn.
| Substrate
|
Bilayer
|
+ D-α-Syn
|
||||||
|---|---|---|---|---|---|---|---|---|
| PC/PA
|
PC/PS
|
PC/PA
|
PC/PS
|
PC/PA
|
PC/PS
|
|||
| Thickness of SiOx (Å) | 21.8 ± 4.5 | 9.8 ± 5.0 | Tether thickness (Å) | 11.4 ± 0.4 | 11.4 ± 0.4 | Peak position, penetration into membrane (Å)1 | 12 ± 3 | 11 ± 5 |
| nSLD SiOx layer (10−6 Å−2) | 3.58 ± 0.09 | 3.52 ± 0.16 | Molar fraction of tether in the inner leaflet (Å) | 0.34 ± 0.17 | 0.81 ± 0.23 | Amount of protein, protein volume (Å3/Å2) | 3.8 ± 1.3 | 1.4 ± 1.0 |
| Thickness of Cr (Å) | 24.4 ± 5.4 | 36.4 ± 4.9 | Number of βME per tether molecule (Å) | 4.0 ± 1.0 | 2.7 ± 1.2 | |||
| nSLD Cr (10−6 Å−2) | 3.05 ± 0.13 | 3.14 ± 0.05 | Hydrocarbon thickness (inner) (Å) | 19.2 ± 1.3 | 17.2 ± 0.8 | Membrane thickness change (Å) | +0.8 ± 1.2 | −0.34 ± 0.25 |
| Thickness of Au (Å) | 147.0 ± 1.9 | 142.3 ± 0.8 | Hydrocarbon thickness (outer) (Å) | 13.7 ± 0.7 | 14.2 ± 0.8 | |||
| nSLD Au (10−6 Å−2) | 4.49 ± 0.02 | 4.53 ± 0.02 | Bilayer completeness | 0.99 ± 0.01 | 0.99 ± 0.01 | Bilayer completeness | 0.99 ± 0.01 | 0.99 ± 0.01 |
In reference to bilayer center.
Time-resolved Depth-dependent Tryptophan Fluorescence Quenching
Unlike NR, which provides global information on protein shape and penetration into a planar bilayer, fluorescence measurements using single-Trp mutants reveals residue-level details of α-syn on curved bilayers.39,70–71 WT α-syn is devoid of Trp residues, enabling single-Trp incorporation as local fluorescent probes. It is well-established that Trp membrane penetration can be monitored via fluorescence quenching by the heavy-atom bromine incorporated at specific positions along the lipid hydrocarbon chain.72–75 Three independent Br-positions (Br6-7, Br9-10, and Br11-12) were used serving as markers for 11, 8.3, and 6 Å from the bilayer center.76 Although NR suggests α-syn membrane binding affinity is not caused by global penetration disparities, local penetration differences into POPS or POPA bilayers may contribute to the observed binding variability and thus warrants investigation.
Time-resolved Trp fluorescence decays of three single-site mutants (F4W, Y39W, and F94W) in the membrane-binding region of α-syn were recorded in the presence of POPC/POPA or POPC/POPS vesicles and vesicles containing one of the three different brominated lipids (30 mol%, L/P = 300). The use of time-resolved measurements circumvents background subtractions and allows characterization of the quenching mechanism (vide infra). An additional Trp site, Y136W was measured as a negative control because the highly acidic C-terminus of α-syn does not associate with anionic lipid membranes due to electrostatic repulsion.28 We ascertained that there were negligible differences between the helical content of α-syn bound to vesicles in the absence and presence of the brominated lipids (data not shown). The logarithm of the ratio of Trp fluorescence intensities measured in the absence (F0) and presence of brominated lipids (FBr) is plotted as a function of distance from the bilayer center. The depth profile of α-syn into the bilayer was obtained by distribution analysis66 (Figure 5). See Table 2 for all fit parameters.
Figure 5.
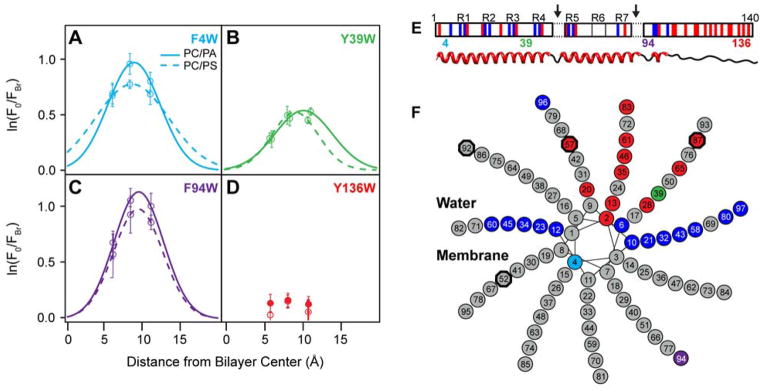
Membrane insertion of α-syn determined by time-resolved Trp fluorescence quenching. Depth profiles for (A) W4, (B) W39, (C) W94, and (D) W136 measured at L/P = 300. Trp fluorescence of α-syn variants (5 μM) was recorded in the absence (F0) and presence of 30 mol % brominated PC lipid containing vesicles (FBr). Solid and dashed lines are distribution analysis fits for POPC/POPA and POPC/POPS, respectively. Error bars indicate 68% confidence intervals (n = 3). For panel D, solid and open circles indicate POPC/POPA and POPC/POPS, respectively. (E) and (F) A revised helical model for α-syn membrane interaction. (E) Schematic of α-syn amino acid sequence showing the seven imperfect amphipathic repeats (R1–R7). Acidic and basic residues are shown in red and blue, respectively. Trp mutation sites (4, 39, 94, and 136) used in this study are denoted. Arrows indicate breaks in the elongated helix. A corresponding cartoon of the helical regions is shown underneath. (F) A helical wheel diagram (periodicity of 3.67 amino acids per turn) of the α-syn elongated helix consistent with the experimental Trp penetration data, residues outlined by black octagons indicate the beginnings and ends of proposed breaks (residues 53–5646 and residues 88–91 (this work), residues not shown). Amino acids are colored as in the top panel. The putative water/membrane interface is also indicated.
Table 2.
α-Syn Trp penetration depths in POPC/POPA and POPC/POPS vesicles determined by Br-quenching1.
|
|
||||||||||||
|---|---|---|---|---|---|---|---|---|---|---|---|---|
| F4W
|
Y39W
|
F94W
|
||||||||||
| POPC/ POPA | POPC/ POPS | POPC/ POPA | POPC/ POPS | POPC/ POPA | POPC/ POPS | |||||||
|
| ||||||||||||
| Mean depth,2 xm |
|
|
|
|
|
|
||||||
| Dispersion, σ |
|
|
|
|
|
|
||||||
| Area, S |
|
|
|
|
|
|
||||||
Estimated errors of fit parameters are based on fitting the upper and lower bounds of 68% confidence interval.
Relative to bilayer center.
For both lipid conditions, quenching efficiency follows the trend W4 ~ W94 > W39 ≫ W136. The negligible quenching at position 136 is expected for any site along the negatively charged C-terminus (Figure 5D). Distribution analysis of W4, W39, and W94 fluorescence reveals similar mean Trp penetration depths (~9 Å from the bilayer center) with W4 and W39 exhibiting modest differences with slightly deeper mean depths (0.4–0.5 and 0.6–0.9 Å for W4 and W39, respectively) for POPS (Table 2).
Most unexpected are the penetration depths of W39 and W94 which are at variance with one or both current membrane binding models. In the case of the bent helix model, it may be possible for W39 to insert into the bilayer as it is part of a flexible linker region. However, in the elongated helix, position 39 resides on the water-exposed side of the amphipathic helical structure. Neither bent nor elongated helices can account for the large degree of penetration that is observed at position 94. In the bent helix, position 94 resides in an unstructured region that is not considered to be in the membrane associating region and in the elongated helix, position 94 is predicted to be water-exposed.
To visualize how a membrane-associated α-syn might look where both residues 4 and 94 are at the same angle below the water-lipid interface (i.e. similar penetration depths) as well as having both K96 and K97 reside either at the interfacial or in the aqueous region, a revised elongated helical structure was generated and depicted in Figure 5F. This is one potential model of how W94 may come to penetrate the bilayer, which includes an additional deviation (break) from helical structure at the highly hydrophobic stretch of residues 88–91. This only represents one potential model building off existing interpretations. While this model theoretically can account for our spectroscopic results, it is not definitive and other possibilities cannot be excluded, such as helix fraying or insertion of W94 due to the two adjacent Lys residues at positions 96 and 97 bringing the region proximal to the membrane surface. Clearly, more work is needed to validate this model.
Local Conformational Differences between POPA- and POPS-bound α-Synuclein
Both NR and site-specific Trp measurements indicate that penetration depth of α-syn is similar for either POPA- or POPS-containing membranes even though there is a preference for α-syn binding to POPA. However, closer examination of the individual Trp quenching profiles reveal differences into local membrane interactions beyond penetration depth. All Trp variants show greater quenching efficiencies in the presence of POPC/POPA than in POPC/POPS (S, Table 2), visualized in Figure 5A–C as the area under the depth profiles. However, because the disparities in quenching efficiencies vary non-uniformly between POPC/POPS and POPC/POPA, they likely reflect differences attributable to lipid specificity rather than differences in membrane binding affinity. Of the four tested Trp sites, the greatest difference in quenching efficiencies between POPC/POPA and POPC/POPS vesicles is at position 39 (22%), compared to 8 and 15% at positions 4 and 94, respectively (Table 2). These lipid specific variations in quenched population may be attributable to local conformations stabilized by distinct chemical or physical aspects of the bilayer surface and may account for binding affinity disparities.
Position 4 exhibits the greatest quenching efficiency with the smallest variations between phosphatidic acid and phosphatidylserine (S, Table 2). This result aligns with the idea that the N-terminal residues (1–25) act as the anchor for the α-syn-membrane association,38,77 possibly adopting helical structure before the rest of the membrane-binding region,78–79 and implying that N-terminal interaction may be a conserved motif across different bilayer makeups. However, similar quenching efficiency was also observed for W94, indicating that residues proximal to 94 may be equally as important in stabilizing protein-membrane interaction.
The structural information that we are able to extrapolate at specific sites between the two lipid compositions might lend physical insight into α-syn amyloid formation in the presence of membranes. The small but measurable differences between local penetration depths for W4 and W39 as well as the flexibility observed at position 39 may also play a role in the conformational changes involved in α-syn misfolding. While it could be just coincidental, we note that the five currently identified missense disease-related mutations (A30P, E46K, H50Q, G51D, and A53T) are near this N-terminal region. Moreover, our proposed helical break from residues 88–91 is a putative turn between C-terminal β-strands 4 and 5 in its amyloid state,80 suggesting that membrane binding by α-syn may stabilize intramolecular contacts for forming amyloid.
Conformational Heterogeneity for Membrane-bound α-Synuclein at Position 39
The reduced quenching efficiency observed at position 39 is roughly half of that at positions 4 and 94. There is an apparent missing quenching fraction (54–60% relative to W4). Because there are no differences in membrane affinities between the mutants,39 this difference at W39 likely represents α-syn conformational heterogeneity and dynamics at the membrane interface, which would support the presence of both of the currently accepted α-helical structures. In the bent helix, it is favorable for the hydrophobic W39, or native Y39, to insert into the bilayer as it resides in a flexible linker region (i.e. Br-quenched or measured fraction), and in contrast, position 39 resides on the water-exposed side of the elongated amphipathic helical structure (i.e. unquenched portion).
It is uncertain if these are distinct conformers or if they are in a dynamic equilibrium. Time-resolved Trp fluorescence quenching data can be dissected into a static and a dynamic component. The static component would represent a preformed non-fluorescent Trp-Br (dark) complex and the dynamic component describes the quenching proportion of Trp-Br collisions occurring on the Trp excited-state lifetime (~1–2 ns). Intriguingly, evaluation of the difference between static versus dynamic Trp quenching shows that there is more collisional quenching at position 39, implying that there is more mobility at this site. The N- and C-terminal regions of the membrane binding region may remain stably anchored while the middle of this region, the residues around position 39, can sample several conformations. It is also possible that we are measuring the coexistence of distinct structures, such as the existing bent and elongated helices, which may be promoted by local bilayer characteristics.
Site-specific α-Synuclein Membrane Interactions
Figure 6 shows steady-state spectral analysis of the Trp variants in the presence of either POPC/POPS or POPC/POPA vesicles. Values of peak position at maximum intensity (λmax) and the full width at half maximum (FWHM, Γ) were extracted from log normal distribution fits.62,63 λmax and Γ are indicators of local environmental polarity and conformational heterogeneity, respectively.64–65 Through this analysis, clear distinction between the three sites is revealed. The dashed line in Figure 6D is the reported fit64 to the width and peak position of a Trp model compound (N-acetyl-L-tryptophanamide, NATA) fluorescence spectra taken in solvents of varying polarity, representing canonical Trp fluorescence in different environments. Points that fall above the line indicate conformational heterogeneity of specific Trp sidechains. The three selected positions show comparable λmax (~346 nm) and FWHM when α-syn is in solution, consistent with Trp residues in hydrophilic environments as would be expected for a disordered polypeptide.64–65 Upon the addition of POPC/POPA or POPC/POPS vesicles, Trp fluorescence spectra blue shift to varying extents and quantum yield increases are observed.
Figure 6.

Steady-state fluorescence of single-Trp α-syn variants in the presence of POPC/POPA (black) and POPC/POPS (red) vesicles. (A) W4, (B) W39, and (C) W94 in buffer are shown in cyan, green, and purple, respectively. All three y-axes are on the same scale. Open circles are measured data (n ≥ 2) and solid lines are log normal fits. (D) Comparison of peak position (λmax) and full width at half maximum (Γ) extrapolated from log normal fits. Proteins in the absence and presence of vesicles are denoted as squares and circles, respectively. Error bars show standard deviation from the mean (n ≥ 2). The dashed line is a linear fit of the spectral characteristic of NATA obtained in various solvents64 and shaded regions indicate the classes of canonical Trp (I, II, III63).
The polarity of the Trp surrounding does not follow the same trend as the Trp-Br quenching efficiencies. Among the three positions, W4 exhibits the largest blue shift (24 nm) to a λmax of 322 nm upon membrane binding, indicating that it is in the most hydrophobic environment. Of note, despite residing in the polypeptide region thought to be of the highest membrane affinity,38,77 W4 actually exhibits slightly greater conformational heterogeneity compared to the other sites (Figure 6D). The shifts in W39 and W94 are moderate by comparison (14 and 10 nm, respectively),64–65 but variations are seen for W39 between POPC/POPS and POPC/POPA supporting the proposal that the central region of α-syn may function as a sensor of lipid properties and determine membrane binding affinity.77 The spectral blue shift observed for W94 is greater than what was previously reported for POPC/POPS-bound α-syn by Wietek et al., 71 which may result from different solution conditions (pH 7 versus 5.5). However, their reported value of λmax for W3971 at neutral pH is consistent with our pH 5.5 data; thus, other factors likely contribute to the differences observed for W94 between the two studies.
Three classical Trp environments are shown in Figure 6D,63 ranging from highly non-polar (Class I), to ordered water (Class II), and bulk water (Class III) surroundings. The blue-shifts of W4 and W39 are in accord with their penetration into the hydrocarbon chain. However, W94 exhibit characteristics closer to Class II, which we interpret as a partially hydrophilic environment surrounding W94 which would be more consistent with a Trp sidechain located closer to the headgroup region. The seemingly contradictory results between spectral shift and penetration depth for W94 can be reconciled if the region near W94 at the end of the NAC region reorganizes the bilayer in a way that permits more water in the hydrocarbon chains or if the lysine residues at position 96 and 97 pull water into the bilayer as W94 penetrates. These proximal positive charges from lysines may also contribute to the high quantum yield increase81 of membrane-bound W94 fluorescence observed in steady-state measurements. An alternative explanation for the more polar environment around the deeply penetrating W94 is that there is C-terminal helical fraying. If W4 is part of a helical motif while W94 is part of a membrane interacting and flexible region there could be disparities in the amount of water that is excluded from their Trp environments.
CONCLUDING REMARKS
Here, NR and fluorescence spectroscopy were employed to uncover molecular details of the interaction between α-syn and two anionic lipids, PA and PS. NR data show that α-syn comparably penetrates both PA- and PS-containing stBLM even though α-syn binds more tightly to PA. Consistent penetration depths on the residue level were obtained at three sites, W4, W39, and W94W, and thus no correlation was found between binding affinity to and α-syn penetration depth into either PA or PS membranes. The spectroscopic properties of W39 were found to be sensitive to the chemical nature of the membrane surface, indicating that PA and PS may promote different local membrane bound conformations and that there is greater conformational heterogeneity in this region. Our spectroscopic data also show that position 94 penetrates both PA- and PS-membranes comparably to position 4, though previous reports dictate that the former should be water-exposed while the latter is buried in the bilayer. This new finding allowed us to revise the current helical model in order to accommodate position 94.
Phosphatidylserine is the most abundant anionic lipid in synaptic vesicles while phosphatidic acid is a minor component (~2% of total phospholipids). Despite the lower abundance of PA in vivo, α-syn has a greater affinity for PA, suggesting that local concentrations of PA may be important for α-syn function or misfunction. Lipid composition analysis on mouse brain with α-syn overexpression56 or with aging57 shows an increasing concentration of PA, and the presence of PA-containing vesicles has been shown to stimulate α-syn aggregation/fibril formation in vitro,24,82 suggesting that PA may promote protein-protein interaction on the membrane surface. That said, we observe no significant penetration depth differences and only subtle local structural differences between PS-bound and PA-bound α-syn that are unlikely to account for the differences in binding affinities and aggregation behaviors of α-syn in the presence of these anionic lipids. This is somewhat counterintuitive given that the smaller PA headgroup is expected to facilitate deeper α-syn insertion and contradicts the assertion of previous literature that suggested a strong correlation between the penetration depth and binding affinity.83
A careful examination of the chemical structure and physical property of the two phospholipids reveals underlying differences that may explain the strong preference of α-syn for POPA. POPA has a much higher phase transition temperature (28 °C) than either POPS (12 °C) or POPC (−2 °C). The higher phase transition temperature of POPA decreases its miscibility with POPC and enables the formation of micro-domains rich in POPA at our measurement temperatures (20–25 °C), enhancing local electrostatic interaction with α-syn. Moreover, the phosphomonoester headgroup of PA can act as a hydrogen bond donor or acceptor, forming hydrogen bonds with either other PA headgroups or surrounding water molecules.84 The hydrogen bonding network facilitates and stabilizes the formation of micro-domains, again favoring electrostatic interaction. It has also been reported that basic residues such as lysine and arginine increase the charge on PA when the side-chains interact with the PA headgroup through hydrogen bonding, promoting further the electrostatic attraction between basic residues in a membrane-binding region and the negatively charged membrane surface.84 In addition, the relatively smaller PA headgroup promotes lipid-packing defects85 which may facilitate α-syn binding. Thus, the higher affinity of α-syn for POPA as observed in our CD and NR measurements may result from a combination of the physicochemistry of POPA, including PA micro-domain formation and protein-lipid hydrogen bond formation. Even though POPS is also capable of forming hydrogen bonds, it mixes homogeneously with POPC under our experimental conditions due to its lower phase transition temperature. Therefore, the negative charges are more randomly distributed through the whole POPC/POPS bilayer, leading to a less efficient attraction of α-syn to the membrane surface.
In conclusion, structural information on α-syn binding to PA- and PS-containing membranes revealed by the present study underlies the importance of lipid composition in α-syn-membrane interaction, providing the groundwork needed to better understand the mechanisms related to its membrane-related misfolding as well as its function.
Acknowledgments
This work was supported by the Intramural Research Program at the National Institutes of Health, National Heart, Lung, and Blood Institute (NHLBI) and by the NIST IMS program “Precision Measurements for Integral Membrane Proteins”. Research was performed in part at the National Institute of Standards and Technology (NIST) Center for Nanoscale Science and Technology. We thank the NHLBI Electron Microscopy, Biophysics, and Biochemistry Cores for the use of equipment and technical expertise. Certain commercial materials, equipment, and instruments are identified in this work to describe the experimental procedure as completely as possible. In no case does such an identification imply a recommendation or endorsement by NIST, nor does it imply that the materials, equipment, or instrument identified are necessarily the best available for the purpose.
Footnotes
Notes
The authors declare no competing financial interest.
References
- 1.Spillantini MG, Schmidt ML, Lee VMY, Trojanowski JQ, Jakes R, Goedert M. α-Synuclein in Lewy Bodies. Nature. 1997;388:839–840. doi: 10.1038/42166. [DOI] [PubMed] [Google Scholar]
- 2.Polymeropoulos MH, Lavedan C, Leroy E, Ide SE, Dehejia A, Dutra A, Pike B, Root H, Rubenstein J, Boyer R, et al. Mutation in the α-Synuclein Gene Identified in Families with Parkinson’s Disease. Science. 1997;276:2045–2047. doi: 10.1126/science.276.5321.2045. [DOI] [PubMed] [Google Scholar]
- 3.Kruger R, Kuhn W, Muller T, Woitalla D, Graeber M, Kosel S, Przuntek H, Epplen JT, Schols L, Riess O. Ala30Pro Mutation in the Gene Encoding α-Synuclein in Parkinson’s Disease. Nat Genet. 1998;18:106–108. doi: 10.1038/ng0298-106. [DOI] [PubMed] [Google Scholar]
- 4.Zarranz JJ, Alegre J, Gomez-Esteban JC, Lezcano E, Ros R, Ampuero I, Vidal L, Hoenicka J, Rodriguez O, Atares B, et al. The New Mutation, E46K, of α-Synuclein Causes Parkinson and Lewy Body Dementia. Ann Neurol. 2004;55:164–173. doi: 10.1002/ana.10795. [DOI] [PubMed] [Google Scholar]
- 5.Chartier-Harlin MC, Kachergus J, Roumier C, Mouroux V, Douay X, Lincoln S, Levecque C, Larvor L, Andrieux J, Hulihan M, et al. α-Synuclein Locus Duplication as a Cause of Familial Parkinson’s Disease. Lancet. 2004;364:1167–1169. doi: 10.1016/S0140-6736(04)17103-1. [DOI] [PubMed] [Google Scholar]
- 6.Singleton AB, Farrer M, Johnson J, Singleton A, Hague S, Kachergus J, Hulihan M, Peuralinna T, Dutra A, Nussbaum R, et al. α-Synuclein Locus Triplication Causes Parkinson’s Disease. Science. 2003;302:841–841. doi: 10.1126/science.1090278. [DOI] [PubMed] [Google Scholar]
- 7.Lesage S, Anheim M, Letournel F, Bousset L, Honore A, Rozas N, Pieri L, Madiona K, Durr A, Melki R, et al. G51D α-Synuclein Mutation Causes a Novel Parkinsonian-Pyramidal Syndrome. Ann Neurol. 2013;73:459–471. doi: 10.1002/ana.23894. [DOI] [PubMed] [Google Scholar]
- 8.Appel-Cresswell S, Vilarino-Guell C, Encarnacion M, Sherman H, Yu I, Shah B, Weir D, Thompson C, Szu-Tu C, Trinh J, et al. α-Synuclein P.H50Q, a Novel Pathogenic Mutation for Parkinson’s Disease. Mov Disord. 2013;28:811–813. doi: 10.1002/mds.25421. [DOI] [PubMed] [Google Scholar]
- 9.Clayton DF, George JM. The Synucleins: A Family of Proteins Involved in Synaptic Function, Plasticity, Neurodegeneration and Disease. Trends Neurosci. 1998;21:249–254. doi: 10.1016/s0166-2236(97)01213-7. [DOI] [PubMed] [Google Scholar]
- 10.Iwai A, Masliah E, Yoshimoto M, Ge NF, Flanagan L, Desilva HAR, Kittel A, Saitoh T. The Precursor Protein of Non-Aβ Component of Alzheimers-Disease Amyloid Is a Presynaptic Protein of the Central-Nervous-System. Neuron. 1995;14:467–475. doi: 10.1016/0896-6273(95)90302-x. [DOI] [PubMed] [Google Scholar]
- 11.Nemani VM, Lu W, Berge V, Nakamura K, Onoa B, Lee MK, Chaudhry FA, Nicoll RA, Edwards RH. Increased Expression of α-Synuclein Reduces Neurotransmitter Release by Inhibiting Synaptic Vesicle Reclustering after Endocytosis. Neuron. 2010;65:66–79. doi: 10.1016/j.neuron.2009.12.023. [DOI] [PMC free article] [PubMed] [Google Scholar]
- 12.Alvarez-Erviti L, Seow Y, Schapira AH, Gardiner C, Sargent IL, Wood MJA, Cooper JM. Lysosomal Dysfunction Increases Exosome-Mediated α-Synuclein Release and Transmission. Neurobiol Dis. 2011;42:360–367. doi: 10.1016/j.nbd.2011.01.029. [DOI] [PMC free article] [PubMed] [Google Scholar]
- 13.Danzer KM, Kranich LR, Ruf WP, Cagsal-Getkin O, Winslow AR, Zhu LY, Vanderburg CR, McLean PJ. Exosomal Cell-to-Cell Transmission of α Synuclein Oligomers. Molecular Neurodegeneration. 2012;7 doi: 10.1186/1750-1326-7-42. [DOI] [PMC free article] [PubMed] [Google Scholar]
- 14.Gosavi N, Lee HJ, Lee JS, Patel S, Lee SJ. Golgi Fragmentation Occurs in the Cells with Prefibrillar α-Synuclein Aggregates and Precedes the Formation of Fibrillar Inclusion. J Biol Chem. 2002;277:48984–48992. doi: 10.1074/jbc.M208194200. [DOI] [PubMed] [Google Scholar]
- 15.Fujita Y, Ohama E, Takatama M, Al-Sarraj S, Okamoto K. Fragmentation of Golgi Apparatus of Nigral Neurons with α-Synuclein-Positive Inclusions in Patients with Parkinson’s Disease. Acta Neuropathol. 2006;112:261–265. doi: 10.1007/s00401-006-0114-4. [DOI] [PubMed] [Google Scholar]
- 16.Nakamura K, Nemani VM, Azarbal F, Skibinski G, Levy JM, Egami K, Munishkina L, Zhang J, Gardner B, Wakabayashi J, et al. Direct Membrane Association Drives Mitochondrial Fission by the Parkinson Disease-Associated Protein α-Synuclein. J Biol Chem. 2011;286:20710–20726. doi: 10.1074/jbc.M110.213538. [DOI] [PMC free article] [PubMed] [Google Scholar]
- 17.Meredith GE, Totterdell S, Petroske E, Cruz KS, Callison RC, Lau YS. Lysosomal Malfunction Accompanies α-Synuclein Aggregation in a Progressive Mouse Model of Parkinson’s Disease. Brain Res. 2002;956:156–165. doi: 10.1016/s0006-8993(02)03514-x. [DOI] [PubMed] [Google Scholar]
- 18.Golovko MY, Barcelo-Coblijn G, Castagnet PI, Austin S, Combs CK, Murphy EJ. The Role of α-Synuclein in Brain Lipid Metabolism: A Downstream Impact on Brain Inflammatory Response. Mol Cell Biochem. 2009;326:55–66. doi: 10.1007/s11010-008-0008-y. [DOI] [PubMed] [Google Scholar]
- 19.Castagnet PI, Golovko MY, Barcelo-Coblijn GC, Nussbaum RL, Murphy EJ. Fatty Acid Incorporation Is Decreased in Astrocytes Cultured from α-Synuclein Gene-Ablated Mice. J Neurochem. 2005;94:839–849. doi: 10.1111/j.1471-4159.2005.03247.x. [DOI] [PubMed] [Google Scholar]
- 20.Burre J, Sharma M, Sudhof TC. α-Synuclein Assembles into Higher-Order Multimers Upon Membrane Binding to Promote SNARE Complex Formation. Proc Natl Acad Sci U S A. 2014;111:E4274–E4283. doi: 10.1073/pnas.1416598111. [DOI] [PMC free article] [PubMed] [Google Scholar]
- 21.Burre J, Sharma M, Tsetsenis T, Buchman V, Etherton MR, Sudhof TC. α-Synuclein Promotes SNARE-Complex Assembly in Vivo and in Vitro. Science. 2010;329:1663–1667. doi: 10.1126/science.1195227. [DOI] [PMC free article] [PubMed] [Google Scholar]
- 22.Clayton DF, George JM. Synucleins in Synaptic Plasticity and Neurodegenerative Disorders. J Neurosci Res. 1999;58:120–129. [PubMed] [Google Scholar]
- 23.Westphal CH, Chandra SS. Monomeric Synucleins Generate Membrane Curvature. J Biol Chem. 2013;288:1829–1840. doi: 10.1074/jbc.M112.418871. [DOI] [PMC free article] [PubMed] [Google Scholar]
- 24.Jiang Z, de Messieres M, Lee JC. Membrane Remodeling by α-Synuclein and Effects on Amyloid Formation. J Am Chem Soc. 2013;135:15970–15973. doi: 10.1021/ja405993r. [DOI] [PMC free article] [PubMed] [Google Scholar]
- 25.Varkey J, Isas JM, Mizuno N, Jensen MB, Bhatia VK, Jao CC, Petrlova J, Voss JC, Stamou DG, Steven AC, et al. Membrane Curvature Induction and Tubulation Are Common Features of Synucleins and Apolipoproteins. J Biol Chem. 2010;285:32486–32493. doi: 10.1074/jbc.M110.139576. [DOI] [PMC free article] [PubMed] [Google Scholar]
- 26.Mizuno N, Varkey J, Kegulian NC, Hegde BG, Cheng NQ, Langen R, Steven AC. Remodeling of Lipid Vesicles into Cylindrical Micelles by α-Synuclein in an Extended α-Helical Conformation. J Biol Chem. 2012;287:29301–29311. doi: 10.1074/jbc.M112.365817. [DOI] [PMC free article] [PubMed] [Google Scholar]
- 27.Taneva SG, Lee JMC, Cornell RB. The Amphipathic Helix of an Enzyme That Regulates Phosphatidylcholine Synthesis Remodels Membranes into Highly Curved Nanotubules. BBA Biomembr. 2012;1818:1173–1186. doi: 10.1016/j.bbamem.2012.01.006. [DOI] [PubMed] [Google Scholar]
- 28.Pfefferkorn CM, Jiang ZP, Lee JC. Biophysics of α-Synuclein Membrane Interactions. BBA Biomembr. 2012;1818:162–171. doi: 10.1016/j.bbamem.2011.07.032. [DOI] [PMC free article] [PubMed] [Google Scholar]
- 29.Auluck PK, Caraveo G, Lindquist S. In: Annual Review of Cell and Developmental Biology. Schekman R, Goldstein L, Lehmann R, editors. Vol. 26. 2010. pp. 211–233. [DOI] [PubMed] [Google Scholar]
- 30.Uversky VN, Eliezer D. Biophysics of Parkinson’s Disease: Structure and Aggregation of α-Synuclein. Curr Protein Peptide Sci. 2009;10:483–499. doi: 10.2174/138920309789351921. [DOI] [PMC free article] [PubMed] [Google Scholar]
- 31.Weinreb PH, Zhen WG, Poon AW, Conway KA, Lansbury PT. NACP, a Protein Implicated in Alzheimer’s Disease and Learning, Is Natively Unfolded. Biochemistry. 1996;35:13709–13715. doi: 10.1021/bi961799n. [DOI] [PubMed] [Google Scholar]
- 32.Fauvet B, Mbefo MK, Fares MB, Desobry C, Michael S, Ardah MT, Tsika E, Coune P, Prudent M, Lion N, et al. α-Synuclein in Central Nervous System and from Erythrocytes, Mammalian Cells, and Escherichia Coli Exists Predominantly as Disordered Monomer. J Biol Chem. 2012;287:15345–15364. doi: 10.1074/jbc.M111.318949. [DOI] [PMC free article] [PubMed] [Google Scholar]
- 33.Coelho-Cerqueira E, Carmo-Goncalves P, Pinheiro AS, Cortines J, Follmer C. α-Synuclein as an Intrinsically Disordered Monomer - Fact or Artefact? FEBS J. 2013;280:4915–4927. doi: 10.1111/febs.12471. [DOI] [PubMed] [Google Scholar]
- 34.Burre J, Vivona S, Diao JJ, Sharma M, Brunger AT, Sudhof TC. Properties of Native Brain α-Synuclein. Nature. 2013;498:E4–E6. doi: 10.1038/nature12125. [DOI] [PMC free article] [PubMed] [Google Scholar]
- 35.Bartels T, Choi JG, Selkoe DJ. α-Synuclein Occurs Physiologically as a Helically Folded Tetramer That Resists Aggregation. Nature. 2011;477:107–U123. doi: 10.1038/nature10324. [DOI] [PMC free article] [PubMed] [Google Scholar]
- 36.Dettmer U, Newman AJ, Luth ES, Bartels T, Selkoe D. In Vivo Cross-Linking Reveals Principally Oligomeric Forms of α-Synuclein and β-Synuclein in Neurons and Non-Neural Cells. J Biol Chem. 2013;288:6371–6385. doi: 10.1074/jbc.M112.403311. [DOI] [PMC free article] [PubMed] [Google Scholar]
- 37.George JM, Jin H, Woods WS, Clayton DF. Characterization of a Novel Protein Regulated During the Critical Period for Song Learning in the Zebra Finch. Neuron. 1995;15:361–372. doi: 10.1016/0896-6273(95)90040-3. [DOI] [PubMed] [Google Scholar]
- 38.Pfefferkorn CM, Heinrich F, Sodt AJ, Maltsev AS, Pastor RW, Lee JC. Depth of α-Synuclein in a Bilayer Determined by Fluorescence, Neutron Reflectometry, and Computation. Biophys J. 2012;102:613–621. doi: 10.1016/j.bpj.2011.12.051. [DOI] [PMC free article] [PubMed] [Google Scholar]
- 39.Pfefferkorn CM, Lee JC. Tryptophan Probes at the α-Synuclein and Membrane Interface. J Phys Chem B. 2010;114:4615–4622. doi: 10.1021/jp908092e. [DOI] [PMC free article] [PubMed] [Google Scholar]
- 40.Borbat P, Ramlall TF, Freed JH, Eliezer D. Inter-Helix Distances in Lysophospholipid Micelle-Bound α-Synuclein from Pulsed ESR Measurements. J Am Chem Soc. 2006;128:10004–10005. doi: 10.1021/ja063122l. [DOI] [PubMed] [Google Scholar]
- 41.Drescher M, Veldhuis G, van Rooijen BD, Milikisyants S, Subramaniam V, Huber M. Antiparallel Arrangement of the Helices of Vesicle-Bound α-Synuclein. J Am Chem Soc. 2008;130:7796–7797. doi: 10.1021/ja801594s. [DOI] [PubMed] [Google Scholar]
- 42.Chandra S, Chen XC, Rizo J, Jahn R, Sudhof TC. A Broken α-Helix in Folded α-Synuclein. J Biol Chem. 2003;278:15313–15318. doi: 10.1074/jbc.M213128200. [DOI] [PubMed] [Google Scholar]
- 43.Ulmer TS, Bax A, Cole NB, Nussbaum RL. Structure and Dynamics of Micelle-Bound Human α-Synuclein. J Biol Chem. 2005;280:9595–9603. doi: 10.1074/jbc.M411805200. [DOI] [PubMed] [Google Scholar]
- 44.Bisaglia M, Tessari I, Pinato L, Bellanda M, Giraudo S, Fasano M, Bergantino E, Bubacco L, Mammi S. A Topological Model of the Interaction between α-Synuclein and Sodium Dodecyl Sulfate Micelles. Biochemistry. 2005;44:329–339. doi: 10.1021/bi048448q. [DOI] [PubMed] [Google Scholar]
- 45.Eliezer D, Kutluay E, Bussell R, Browne G. Conformational Properties of α-Synuclein in Its Free and Lipid-Associated States. J Mol Biol. 2001;307:1061–1073. doi: 10.1006/jmbi.2001.4538. [DOI] [PubMed] [Google Scholar]
- 46.Jao CC, Hegde BG, Chen J, Haworth IS, Langen R. Structure of Membrane-Bound α-Synuclein from Site-Directed Spin Labeling and Computational Refinement. Proc Natl Acad Sci U S A. 2008;105:19666–19671. doi: 10.1073/pnas.0807826105. [DOI] [PMC free article] [PubMed] [Google Scholar]
- 47.Georgieva ER, Ramlall TF, Borbat PP, Freed JH, Eliezer D. Membrane-Bound α-Synuclein Forms an Extended Helix: Long-Distance Pulsed ESR Measurements Using Vesicles, Bicelles, and Rodlike Micelles. J Am Chem Soc. 2008;130:12856–12857. doi: 10.1021/ja804517m. [DOI] [PMC free article] [PubMed] [Google Scholar]
- 48.Trexler AJ, Rhoades E. α-Synuclein Binds Large Unilamellar Vesicles as an Extended Helix. Biochemistry. 2009;48:2304–2306. doi: 10.1021/bi900114z. [DOI] [PMC free article] [PubMed] [Google Scholar]
- 49.Ferreon ACM, Gambin Y, Lemke EA, Deniz AA. Interplay of α-Synuclein Binding and Conformational Switching Probed by Single-Molecule Fluorescence. Proc Natl Acad Sci U S A. 2009;106:5645–5650. doi: 10.1073/pnas.0809232106. [DOI] [PMC free article] [PubMed] [Google Scholar]
- 50.Lokappa SB, Ulmer TS. α-Synuclein Populates Both Elongated and Broken Helix States on Small Unilamellar Vesicles. J Biol Chem. 2011;286:21450–21457. doi: 10.1074/jbc.M111.224055. [DOI] [PMC free article] [PubMed] [Google Scholar]
- 51.Butterfield SM, Lashuel HA. Amyloidogenic Protein Membrane Interactions: Mechanistic Insight from Model Systems. Angew Chem. 2010;49:5628–5654. doi: 10.1002/anie.200906670. [DOI] [PubMed] [Google Scholar]
- 52.Davidson WS, Jonas A, Clayton DF, George JM. Stabilization of α-Synuclein Secondary Structure Upon Binding to Synthetic Membranes. J Biol Chem. 1998;273:9443–9449. doi: 10.1074/jbc.273.16.9443. [DOI] [PubMed] [Google Scholar]
- 53.Rhoades E, Ramlall TF, Webb WW, Eliezer D. Quantification of α-Synuclein Binding to Lipid Vesicles Using Fluorescence Correlation Spectroscopy. Biophys J. 2006;90:4692–4700. doi: 10.1529/biophysj.105.079251. [DOI] [PMC free article] [PubMed] [Google Scholar]
- 54.Middleton ER, Rhoades E. Effects of Curvature and Composition on α-Synuclein Binding to Lipid Vesicles. Biophys J. 2010;99:2279–2288. doi: 10.1016/j.bpj.2010.07.056. [DOI] [PMC free article] [PubMed] [Google Scholar]
- 55.Takamori S, Holt M, Stenius K, Lemke EA, Gronborg M, Riedel D, Urlaub H, Schenck S, Brugger B, Ringler P, et al. Molecular Anatomy of a Trafficking Organelle. Cell. 2006;127:831–846. doi: 10.1016/j.cell.2006.10.030. [DOI] [PubMed] [Google Scholar]
- 56.Rappley I, Myers DS, Milne SB, Ivanova PT, LaVoie MJ, Brown HA, Selkoe DJ. Lipidomic Profiling in Mouse Brain Reveals Differences between Ages and Genders, with Smaller Changes Associated with α-Synuclein Genotype. J Neurochem. 2009;111:15–25. doi: 10.1111/j.1471-4159.2009.06290.x. [DOI] [PMC free article] [PubMed] [Google Scholar]
- 57.Giusto NM, Salvador GA, Castagnet PI, Pasquare SJ, de Boschero MGI. Age-Associated Changes in Central Nervous System Glycerolipid Composition and Metabolism. Neurochem Res. 2002;27:1513–1523. doi: 10.1023/a:1021604623208. [DOI] [PubMed] [Google Scholar]
- 58.Hellstrand E, Grey M, Ainalem ML, Ankner J, Forsyth VT, Fragneto G, Haertlein M, Dauvergne MT, Nilsson H, Brundin P, et al. Adsorption of α-Synuclein to Supported Lipid Bilayers: Positioning and Role of Electrostatics. ACS Chem Neurosci. 2013;4:1339–1351. doi: 10.1021/cn400066t. [DOI] [PMC free article] [PubMed] [Google Scholar]
- 59.Heinrich F, Lösche M. Zooming in on Disordered Systems: Neutron Reflection Studies of Proteins Associated with Fluid Membranes. BBA Biomembr. 2014;1838:2341–2349. doi: 10.1016/j.bbamem.2014.03.007. [DOI] [PMC free article] [PubMed] [Google Scholar]
- 60.Deshmukh L, Schwieters CD, Grishaev A, Ghirlando R, Baber JL, Clore GM. Structure and Dynamics of Full-Length HIV-1 Capsid Protein in Solution. J Am Chem Soc. 2013;135:16133–16147. doi: 10.1021/ja406246z. [DOI] [PMC free article] [PubMed] [Google Scholar]
- 61.Budvytyte R, Valincius G, Niaura G, Voiciuk V, Mickevicius M, Chapman H, Goh HZ, Shekhar P, Heinrich F, Shenoy S, et al. Structure and Properties of Tethered Bilayer Lipid Membranes with Unsaturated Anchor Molecules. Langmuir. 2013;29:8645–8656. doi: 10.1021/la401132c. [DOI] [PMC free article] [PubMed] [Google Scholar]
- 62.Dura JA, Pierce DJ, Majkrzak CF, Maliszewskyj NC, McGillivray DJ, Losche M, O’Donovan KV, Mihailescu M, Perez-Salas U, Worcester DL, et al. AND/R: Advanced Neutron Diffractometer/Reflectometer for Investigation of Thin Films and Multilayers for the Life Sciences. Rev Sci Instrum. 2006;77 doi: 10.1063/1.2219744. [DOI] [PMC free article] [PubMed] [Google Scholar]
- 63.Kirby BJ, Kienzle PA, Maranville BB, Berk NF, Krycka J, Heinrich F, Majkrzak CF. Phase-Sensitive Specular Neutron Reflectometry for Imaging the Nanometer Scale Composition Depth Profile of Thin-Film Materials. Curr Opin Colloid Interface Sci. 2012;17:44–53. [Google Scholar]
- 64.Ladokhin AS, Jayasinghe S, White SH. How to Measure and Analyze Tryptophan Fluorescence in Membranes Properly, and Why Bother? Anal Biochem. 2000;285:235–245. doi: 10.1006/abio.2000.4773. [DOI] [PubMed] [Google Scholar]
- 65.Burstein EA, Vedenkin Ns, Ivkova MN. Fluorescence and Location of Tryptophan Residues in Protein Molecules. Photochem Photobiol. 1973;18:263–279. doi: 10.1111/j.1751-1097.1973.tb06422.x. [DOI] [PubMed] [Google Scholar]
- 66.Ladokhin AS. Analysis of Protein and Peptide Penetration into Membranes by Depth-Dependent Fluorescence Quenching: Theoretical Considerations. Biophys J. 1999;76:946–955. doi: 10.1016/S0006-3495(99)77258-9. [DOI] [PMC free article] [PubMed] [Google Scholar]
- 67.Cevc G, Watts A, Marsh D. Titration of the Phase-Transition of Phosphatidylserine Bilayer-Membranes - Effects of pH, Surface Electrostatics, Ion Binding, and Headgroup Hydration. Biochemistry. 1981;20:4955–4965. doi: 10.1021/bi00520a023. [DOI] [PubMed] [Google Scholar]
- 68.Marsh D, editor. CRC Handbook of Lipid Bilayers. CRC Press; Boca Raton, Fla: 1990. [Google Scholar]
- 69.Lee JC, Langen R, Hummel PA, Gray HB, Winkler JR. α-Synuclein Structures from Fluorescence Energy-Transfer Kinetics: Implications for the Role of the Protein in Parkinson’s Disease. Proc Natl Acad Sci U S A. 2004;101:16466–16471. doi: 10.1073/pnas.0407307101. [DOI] [PMC free article] [PubMed] [Google Scholar]
- 70.Jain N, Bhasne K, Hemaswasthi M, Mukhopadhyay S. Structural and Dynamical Insights into the Membrane-Bound α-Synuclein. Plos One. 2013;8 doi: 10.1371/journal.pone.0083752. [DOI] [PMC free article] [PubMed] [Google Scholar]
- 71.Wietek J, Haralampiev I, Amoussouvi A, Herrmann A, Stockl M. Membrane Bound α-Synuclein Is Fully Embedded in the Lipid Bilayer While Segments with Higher Flexibility Remain. FEBS Lett. 2013;587:2572–2577. doi: 10.1016/j.febslet.2013.06.034. [DOI] [PubMed] [Google Scholar]
- 72.Bolen EJ, Holloway PW. Quenching of Tryptophan Fluorescence by Brominated Phospholipid. Biochemistry. 1990;29:9638–9643. doi: 10.1021/bi00493a019. [DOI] [PubMed] [Google Scholar]
- 73.Kleinschmidt JH, Tamm LK. Time-Resolved Distance Determination by Tryptophan Fluorescence Quenching: Probing Intermediates in Membrane Protein Folding. Biochemistry. 1999;38:4996–5005. doi: 10.1021/bi9824644. [DOI] [PubMed] [Google Scholar]
- 74.London E, Feigenson GW. Fluorescence Quenching in Model Membranes.1. Characterization of Quenching Caused by a Spin-Labeled Phospholipid. Biochemistry. 1981;20:1932–1938. doi: 10.1021/bi00510a032. [DOI] [PubMed] [Google Scholar]
- 75.Markello T, Zlotnick A, Everett J, Tennyson J, Holloway PW. Determination of the Topography of Cytochrome B5 in Lipid Vesicles by Fluorescence Quenching. Biochemistry. 1985;24:2895–2901. doi: 10.1021/bi00333a012. [DOI] [PubMed] [Google Scholar]
- 76.McIntosh TJ, Holloway PW. Determination of the Depth of Bromine Atoms in Bilayers Formed from Bromolipid Probes. Biochemistry. 1987;26:1783–1788. doi: 10.1021/bi00380a042. [DOI] [PubMed] [Google Scholar]
- 77.Fusco G, De Simone A, Gopinath T, Vostrikov V, Vendruscolo M, Dobson CM, Veglia G. Direct Observation of the Three Regions in α-Synuclein That Determine Its Membrane-Bound Behaviour. Nat Commun. 2014;5 doi: 10.1038/ncomms4827. [DOI] [PMC free article] [PubMed] [Google Scholar]
- 78.Lorenzen N, Lemminger L, Pedersen JN, Nielsen SB, Otzen DE. The N-Terminus of α-Synuclein Is Essential for Both Monomeric and Oligomeric Interactions with Membranes. FEBS Lett. 2014;588:497–502. doi: 10.1016/j.febslet.2013.12.015. [DOI] [PubMed] [Google Scholar]
- 79.Bartels T, Ahlstrom LS, Leftin A, Kamp F, Haass C, Brown MF, Beyer K. The N-Terminus of the Intrinsically Disordered Protein α-Synuclein Triggers Membrane Binding and Helix Folding. Biophys J. 2010;99:2116–2124. doi: 10.1016/j.bpj.2010.06.035. [DOI] [PMC free article] [PubMed] [Google Scholar]
- 80.Esteban-Martin S, Silvestre-Ryan J, Bertoncini CW, Salvatella X. Identification of Fibril-Like Tertiary Contacts in Soluble Monomeric α-Synuclein. Biophys J. 2013;105:1192–1198. doi: 10.1016/j.bpj.2013.07.044. [DOI] [PMC free article] [PubMed] [Google Scholar]
- 81.Callis PR, Liu TQ. Quantitative Prediction of Fluorescence Quantum Yields for Tryptophan in Proteins. J Phys Chem B. 2004;108:4248–4259. [Google Scholar]
- 82.Zhu M, Li J, Fink AL. The Association of α-Synuclein with Membranes Affects Bilayer Structure, Stability, and Fibril Formation. J Biol Chem. 2003;278:40186–40197. doi: 10.1074/jbc.M305326200. [DOI] [PubMed] [Google Scholar]
- 83.Braun AR, Lacy MM, Ducas VC, Rhoades E, Sachs JN. α-Synuclein-Induced Membrane Remodeling Is Driven by Binding Affinity, Partition Depth, and Interleaflet Order Asymmetry. J Am Chem Soc. 2014;136:9962–9972. doi: 10.1021/ja5016958. [DOI] [PMC free article] [PubMed] [Google Scholar]
- 84.Kooijman EE, Tieleman DP, Testerink C, Munnik T, Rijkers DTS, Burger KNJ, de Kruijff B. An Electrostatic/Hydrogen Bond Switch as the Basis for the Specific Interaction of Phosphatidic Acid with Proteins. J Biol Chem. 2007;282:11356–11364. doi: 10.1074/jbc.M609737200. [DOI] [PubMed] [Google Scholar]
- 85.Bigay J, Antonny B. Curvature, Lipid Packing, and Electrostatics of Membrane Organelles: Defining Cellular Territories in Determining Specificity. Dev Cell. 2012;23:886–895. doi: 10.1016/j.devcel.2012.10.009. [DOI] [PubMed] [Google Scholar]