Abstract
Articular cartilage is a hyaline cartilage that lines the subchondral bone in a diarthrodial joint. Near infrared (NIR) spectroscopy has been emerging as a nondestructive modality for evaluation of cartilage pathology. However, studies of the depth of penetration of NIR radiation into cartilage are lacking. The average thickness of human cartilage is about 1-3 mm, and it becomes even thinner as OA progresses. To ensure that the spectral data collected is restricted to the tissue of interest i.e. cartilage in this case, and not from the underlying subchondral bone, it is necessary to determine the depth of penetration of NIR radiation in different wavelength (frequency) regions. In the current study we establish how the depth of penetration varies throughout the NIR frequency range (4000-10000 cm-1). NIR spectra were collected from cartilage samples of different thicknesses (0.5 mm to 5 mm) with and without polystyrene placed underneath. A separate NIR spectrum of polystyrene was collected as a reference. It was found that the depth of penetration varied from ∼1 mm to 2 mm in the 4000-5100 cm-1 range, to ∼3 mm in the 5100-7000 cm-1 range, and to ∼5 mm in the 7000-9000 cm-1 frequency range. These findings suggest that the best NIR region to evaluate cartilage only with no subchondral bone contribution is between 4000-7000 cm-1.
Introduction
Articular cartilage is a hyaline cartilage that lines the subchondral bone in a diarthrodial joint. It is composed primarily of collagen type II, proteoglycans, cells and water. Cartilage has zonal organization with respect to depth, and is typically divided into a superficial, middle, deep and calcified zone. The cell morphology, collagen fiber orientation and composition varies throughout the zones1. Water and collagen content vary from being greatest at the surface to lowest in deep zone. However, proteoglycan content has the opposite trend, with a lower content at the surface and higher content in the deep zone. The primary function of cartilage is to provide frictionless motion and act as a shock absorber. The mechanical properties of cartilage are due to its composition where collagen provides tensile strength and proteoglycans are responsible for compressive stiffness. The primary functions of water in cartilage are shock absorption during loading, transport of nutrients, and lubrication2.
Osteoarthritis (OA) is a progressively disabling disease characterized by wear and tear of cartilage. Approximately 27 million adults in United States are estimated to have OA, with prevalence correlated with age and obesity3. The pathology of OA is characterized by a damaged collagen network, loss of proteoglycan, and an increase in water content, often resulting in fibrillation and thinning of articular cartilage4. Articular cartilage is avascular and acellular therefore it has very little capability to repair itself 5. Clinically, arthroscopy has been used as a ‘Gold Standard’ to diagnose and treat intra-articular tissues, such as cartilage6, meniscus7, and ligament8 injuries. During standard arthroscopy procedures, the knee joint is filled with pressurized saline to keep the joint open as well as wash off the synovial fluid to give surgeons a clear view of cartilage. Surgeons can view the cartilage with the arthroscope on a monitor and make a decision on the quality of the cartilage. However, arthroscopic evaluations can be observer dependent9, 10. More quantitative outcome measures are under development11, including advanced magnetic resonance imaging (MRI) analyses. MRI has a long, though not entirely successful, record in the noninvasive evaluation of cartilage12-14. Limitations of the MRI approach include limited spatial resolution, lack of molecular specificity, and the difficulties of partial volume averaging effects. Thus, the detection of thin fissures, cartilage flaps, and shallow defects can present a substantial challenge15, 16. Further, MRI is not typically utilized intra-operatively.
Fourier transform infrared (FT-IR) exhibits a high degree of specificity to molecular structure and compositional changes in tissue. The mid infrared (MIR) spectral absorbances from connective tissues are well understood, but MIR radiation exhibits a penetration depth of only ∼10 microns through tissue, restricting its utility to the study of surface characteristics and degradation17, 18. Near infrared (NIR) spectroscopy has been emerging as a nondestructive modality for cartilage evaluation19-21. It has been shown that NIR spectra correlate with cartilage matrix composition22-24, thickness25, mechanical response of intact and artificially degraded cartilage26, degradation enzymatically27, traumatic degradation28, as well as histological grading schemes, such as the Mankin score 29, 30. In addition, several studies are advocating the use of NIR probes arthroscopically to evaluate early degeneration19, 21. It is a well-known fact that NIR penetrates to a much greater depth, ∼mm to ∼cm 31, 32. Several studies have shown that the depth of penetration of NIR radiation is wavelength dependent, and varies with tissue type. Lammertyn et al. demonstrated that the depth of penetration of NIR radiation varied from 2-3 mm at 900-1900 nm (5263 cm-1-11111 cm-1) to 4 mm at 700-900 nm (11111 cm-1 -14285 cm-1) in an apple thickness study32. In another study, the depth of penetration in a neonatal head ranged from 6.3-8.5 mm in the 700-900 nm (11111 cm-1 -14285 cm-1) spectral range31. Previous NIR studies with cartilage have looked at the depth of penetration of NIR in cartilage25, 27, with the primary goal being to ensure that the NIR radiation penetrates through the sample thickness. However, studies of the depth of penetration of NIR radiation at different wavelengths in cartilage are lacking. The average thickness of human cartilage is about 1-3 mm, and it changes according to the location of cartilage33, 34 with age35, and with disease, thinning as OA progresses. In order to ensure that the spectral data collected is restricted to the tissue of interest i.e. cartilage in this case, and not from the underlying subchondral bone, it is necessary to determine the depth of penetration of NIR in different wavelength regions. In the MIR, bone has a strong phosphate absorbance at 900-1200 cm-1 36 which can be used to differentiate the tissue from cartilage. However, in the NIR spectral region of interest, there is no phosphate absorbance present. Therefore, the motivation of the current study was to establish how the depth of penetration varies throughout the NIR frequency range (4000-10000 cm-1) in cartilage.
Material and methods
Material
Cartilage plugs of 5 mm diameter (n=5) were harvested from freshly dissected newborn bovine knee joints (Research 87, Boylston, MA). These plugs were cleaned to completely remove bone and were cut into varying thicknesses, ranging from 0.5 mm to 5 mm using a tissue cutter (Zivic Instruments, Pittsburgh, PA). The thickness of each cartilage slice was measured three times with a caliper (Fisher Scientific, Pittsburgh, PA) and averaged. Three to five replicates for each tissue thickness were investigated.
Near infrared fiber optic probe data collection
NIR spectra were obtained using a 3 mm diameter silica glass NIR fiber optic reflectance probe (Art Photonics, Berlin, Germany) coupled to a Matrix-F infrared spectrometer with a TE-InGaAs detector ((Bruker, MA). Background spectra were collected from a mirrored surface. Sample spectra were collected from different thickness cartilage samples in contact mode with and without a polystyrene plate underneath at 16 cm-1 spectral resolution, with 256 co-added scans in the 4000-10000 cm-1 frequency range. A reference spectrum was collected from the polystyrene plate (thickness: 0.54 mm) to identify peaks of interest. A mirrored surface was placed underneath the polystyrene, and underneath the cartilage samples when data was collected from cartilage alone. This results in a data collection mode of transflectance for samples 1 mm or thinner. As the sample thickness increases, diffuse reflectance increasingly dominates the spectra.
Near infrared imaging data collection
NIR spectral imaging data were collected from 1 mm thick cartilage samples (n=3) to investigate the zonal distribution of water and matrix components. The sections were cut longitudinally to obtain all the zones of the cartilage in one image. To assess water distribution, cartilage sections were placed on glass slide, covered with a glass coverslip and sealed with tape. NIR images were collected in transmission mode on a Perkin Elmer spotlight 400 spectrometer (Perkin Elmer, Shelton, CT) at 32 cm-1 spectral resolution, 16 co-added scans and at 50 μm spatial resolution in the 4000-7800 cm-1 frequency range. For matrix distribution the samples were air dried and imaged using the same parameters. Transmittance spectra were ratioed to a background obtained through the glass slide and converted to absorbance for data analysis. The image acquisition time was approximately 15 minutes per sample.
Data analysis
NIR Spectra were processed using Unscrambler 10.1 (CAMO, Woodbridge, NJ). NIR spectra from cartilage with different thicknesses were analyzed to understand the effect of an increase in thickness on the NIR spectrum. For the data analysis the NIR spectral range was divided into 3 regions: 4000-5100 cm-1, 5100-7000 cm-1 and 7000-9000 cm-1. Polystyrene peaks were identified and assessed to determine the depth of penetration in each region separately. Spectra from cartilage samples with and without polystyrene plate underneath were compared to determine the depth of penetration of NIR. Spectra were first visually compared to see if the polystyrene peaks were visible in the raw cartilage spectrum when the polystyrene plate was placed underneath during data collection. Further, second derivative spectra were analyzed (Savitzky Golay, 31 point smoothing) to improve the assessment of the presence of polystyrene in the cartilage spectra.
Spectral Image analysis
Images of integrated areas under the NIR water absorbances centered at 5200 and 6890 cm-1 were generated using ISYs 5.0 software (Malvern Instruments, UK) to assess the distribution of water in cartilage. Similarly, integrated images for matrix distribution were generated from the 4384 cm-1 (combination of collagen and proteoglycan) absorbances24.
Results
Cartilage NIR spectra with varying thickness
Cartilage NIR fiber optic spectra were dominated by water absorbances at 5200 cm-1, 6890 cm-1 and 8500 cm-1 and matrix peaks at ∼5600 cm-1. Cartilage spectra with different thickness were compared to see the effect of increasing thickness on the spectra (Figure 1). It was observed that as the thickness of the cartilage increased, the water absorbance band at 6890 and 8500 cm-1 broadened. We observed that not only did the peaks change as the thickness of the cartilage changed, the mode of data acquisition also changed. When the thickness of the cartilage was less than 1 mm, the mode of data collection was transflectance, as the radiation could pass through the sample and reflect from the mirror back through the tissue. However, as the thickness of the cartilage increased the mode of data collection was dominated by diffuse reflectance.
Figure 1.
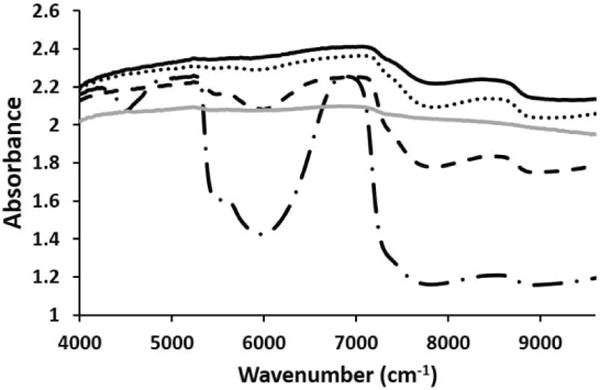
NIR cartilage spectra from 1 mm (long dash dot), 2 mm (black dash), 3 mm (dots) and 4 mm (solid black) thick samples. A diffuse reflectance spectrum (solid grey) obtained from a 1 mm thick cartilage sample on a dark surface is added for comparison of transflectance (long dash dot) to diffuse reflectance in the thin sample
Comparison of raw and second derivatives of the NIR spectra from cartilage of varying thickness with polystyrene underneath
The NIR spectrum of polystyrene (Figure 2) displays several distinct peaks (4048, 4245, 4330, 4612, 4663, 5668, 5949, 6078, 8270, and 8741 cm-1) in the 4000-9000 cm-1 spectral region. The primary reason behind utilizing polystyrene in this study was the fact that it had sharp peaks in the three regions of interest in the NIR spectrum. To assess the depth of penetration of NIR in region 1, polystyrene absorbances at 4612 and 4663 cm-1 were assessed. Similarly, for regions 2 and 3, polystyrene absorbances at 5959 and 8741 cm-1 were assessed, respectively. The NIR spectrum of polystyrene, cartilage of 0.5 mm thickness with polystyrene underneath and without polystyrene underneath are shown in Figure 3. The polystyrene peaks are clearly visible in all three regions of the NIR spectra of cartilage with the polystyrene plate underneath, which confirmed that the depth of penetration is at least 0.5 mm.
Figure 2.
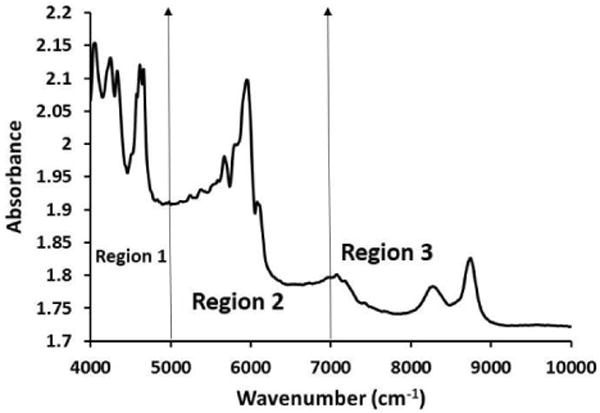
NIR spectrum of polystyrene. The NIR spectra were divided into 3 regions; region 1 (4000-5000 cm-1), region 2 (5000-7000 cm-1) and region 3 (7000-9000 cm-1)
Figure 3.
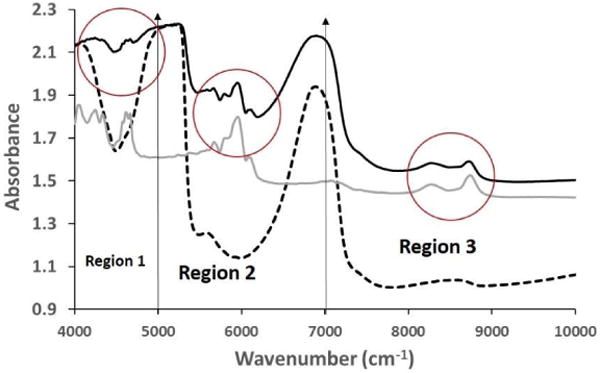
Comparison of raw NIR spectra from 0.5 mm thick cartilage sample with polystyrene (solid black) and without polystyrene underneath (dotted black) along with polystyrene spectrum (solid grey). The influence of the polystyrene peak is highlighted with red circles in the three regions
When raw spectra from a 1 mm thick cartilage specimen with and without polystyrene were compared (Figure 4), it was observed that the polystyrene peaks in region 1 was no longer visible, but the polystyrene peaks in region 2 and region 3 were clearly observed. Second derivatives of the cartilage spectra with and without polystyrene were assessed to obtain more accurate data on penetration. It was found that in the second derivative of 1 mm cartilage with polystyrene underneath, polystyrene peaks were in fact still evident.
Figure 4.
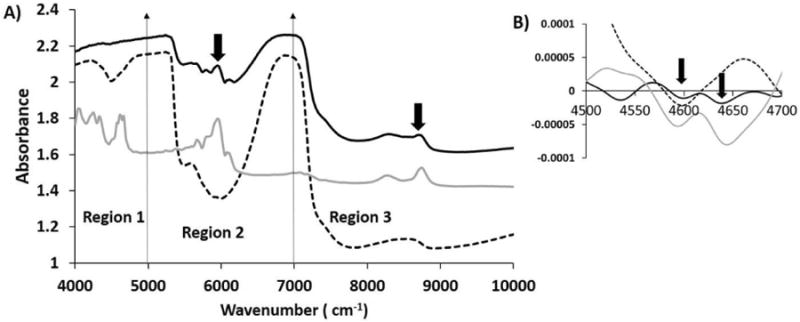
A) Comparison of raw NIR spectra from 1 mm thick cartilage with polystyrene (solid black) and without polystyrene (dotted black) along with polystyrene spectra (solid grey). Influence of polystyrene on NIR spectra of 1 mm cartilage in region 2 and region 3 is highlighted by arrows. B) Second derivatives of NIR spectra from 1 mm thick cartilage with polystyrene underneath (solid black) and without polystyrene (dotted black) along with polystyrene spectra (solid grey) are compared in region 1. The polystyrene spectrum was divided by a factor of 10 to bring all spectra on the same scale.
Similarly, we compared 2 mm thick cartilage spectra with and without polystyrene underneath (Figure 5). It can be seen that the polystyrene peaks were not visible in region 1 but were still seen in regions 2 and 3, even though their intensity was reduced compared to the 1 mm cartilage with polystyrene underneath. When second derivatives were evaluated, we could barely see polystyrene in region 1, indicating the NIR penetration was reaching its limit.
Figure 5.
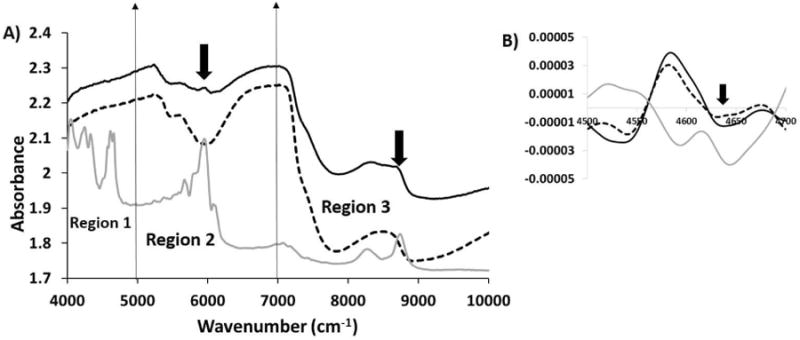
A) Comparison of raw NIR spectra from 2 mm thick cartilage with polystyrene (solid black) and without polystyrene (dotted black) along with polystyrene spectra (solid grey). Influence of polystyrene on NIR spectra of 2 mm cartilage in region 2 and region 3 is highlighted by arrows. B) Second derivatives of NIR spectra from 2 mm thick cartilage with polystyrene (solid black) and without polystyrene (dotted black) along with polystyrene spectra (solid grey) compared in region 1. The polystyrene spectrum was divided by a factor of 10 to bring all spectra on the same scale.
In 3 mm thick cartilage with polystyrene underneath, polystyrene peaks were seen only in region 3 of the raw spectrum (Figure 6). The evaluation of second derivative spectra showed that the polystyrene peak in region 1 was not seen at all, whereas in region 2 it was approaching its penetration limit. However, the polystyrene peak in region 3 was clearly observed.
Figure 6.
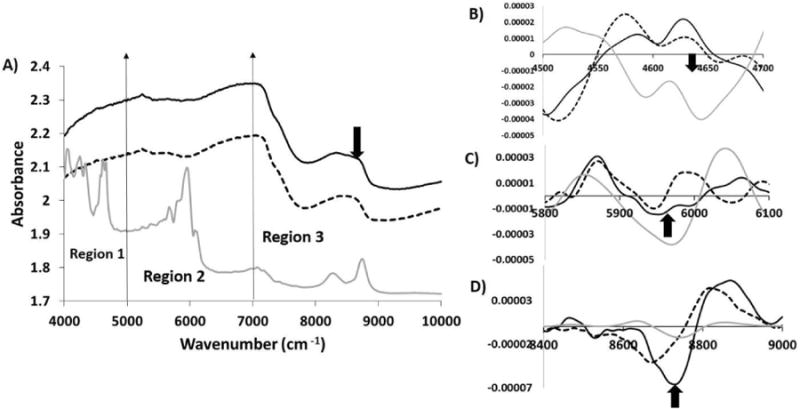
A) Comparison of raw NIR spectra from 3 mm thick cartilage with polystyrene (solid black) and without polystyrene (dotted black) along with polystyrene spectra (solid grey). Second derivatives of NIR spectra from 3 mm thick cartilage with polystyrene (solid black) and without polystyrene (dotted black) along with polystyrene spectra (solid grey) compared in region 1 (B), region 2(C) and region 3(D). The polystyrene spectrum was divided by a factor of 10 to bring all spectra on the same scale.
The raw NIR spectra of 4 mm thick cartilage with and without polystyrene underneath looked very similar to each other (Figure 7). The polystyrene peaks were not seen in any region of the spectrum obtained from cartilage with polystyrene underneath. Evaluation of second derivative spectra showed that region 1 and region 2 had no polystyrene absorbances, but region 3 clearly showed a polystyrene peak. We also observed that the second derivative NIR spectra of cartilage with and without a polystyrene plate underneath were very similar in regions 1 and 2 as thickness increased, indicating no polystyrene penetration.
Figure 7.
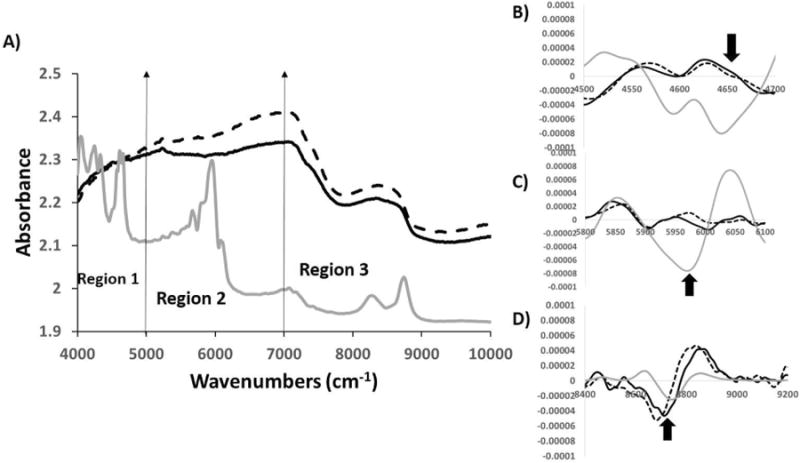
A) Comparison of raw NIR spectra from 4 mm thick cartilage with polystyrene (solid black) and without polystyrene (dotted black) along with polystyrene spectra (solid grey). Second derivatives of NIR spectra from 4 mm thick cartilage with polystyrene (solid black) and without polystyrene (dotted black) along with polystyrene spectra (solid grey) compared in region1 (B), region 2(C) and region 3(D). The polystyrene spectrum was divided by a factor of 10 to bring all spectra on the same scale.
NIR image analysis results
FTIR images of cartilage showed the distribution of water and matrix content across all the zones of cartilage (Figure 8). The free water content (8B) was greatest just below the superficial zone, into the middle zone, and decreased towards the deep zone. The bound plus free water (8A) showed a similar distribution, except for quite near the surface. The reduction in water content towards the deep zone is consistent with literature reports2. The matrix content similarly was greater near the superficial zone, but decreased to a much greater extent into the middle and deeper zones.
Figure 8.
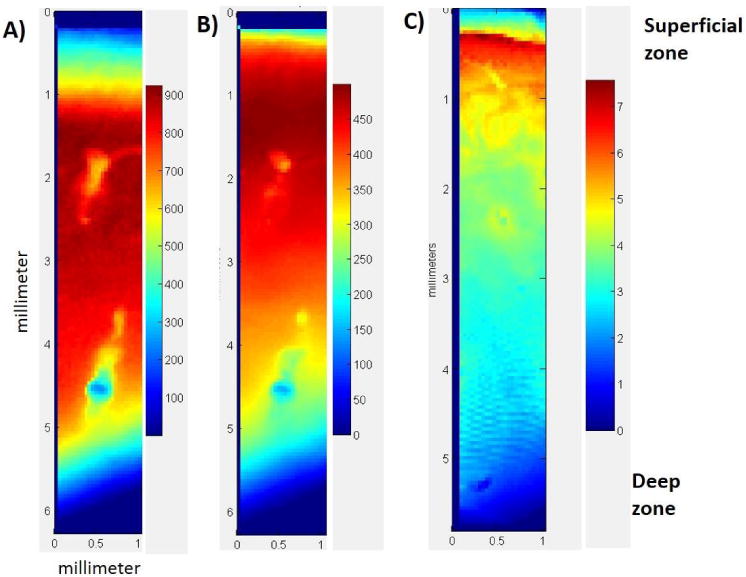
Distribution of water (A and B) and matrix components (C) through the cartilage depth. A) Integrated area map of the 5200 cm-1 (bound and free water) NIR absorbance B) Integrated area map of the 6800 cm-1 (free water) NIR absorbance and C) Integrated area map of the 4384 cm-1(combination of collagen and proteoglycan) NIR absorbance. bar shows the integrated area scale for each absorbance.
Discussion
The current study showed that the depth of penetration of NIR radiation varies throughout the NIR spectral range in cartilage from 0.5 mm to 5 mm. In region 1 (4000-5000 cm-1), the NIR depth of penetration was at least ∼1 mm, but approached the penetration limit at 2 mm. In region 2 (5000-7000 cm-1), the NIR depth of penetration was ∼3 mm whereas in region 3 (7000-9000 cm-1) it was found to be greater than 4 mm.
Our results suggest that since the normal cartilage thickness of human cartilage is between 1-3 mm, the NIR absorbances obtained from the tissue will arise from cartilage, as well as from the subchondral bone underneath it, if the correct spectral range is not investigated. In NIR spectra, it is difficult to differentiate between bone and cartilage absorbances as the NIR region investigated does not display a phosphate absorbance. NIR absorbances from bone and cartilage, primarily water and organic matrix components, are at similar wavenumbers, though bone has sharper spectral features30. Therefore, the spectral region from 4000-7000 cm-1, where the depth of penetration is ∼3 mm, could be an ideal region for cartilage assessment. However, the spectral contribution from the higher wavenumbers could be useful for certain investigations focused on obtaining information from the subchondral bone.
A recent study from our group investigated the depth of penetration of bovine nasal cartilage (BNC) in the 4000-7000 cm-1 spectral region30. Here BNC samples were cut into different thickness from 0.34 to 5.76 mm and a parafilm absorbance peak at 5774 cm-1 was used to assess the depth of penetration. It was found the depth of penetration of NIR radiation for BNC in the spectral range 5000-7000 cm-1 was ∼5 mm. In the current study where articular cartilage was used, the depth of penetration was ∼3 mm in the same spectral range. The main differences between BNC and articular cartilage is the zonal organization in articular cartilage, and alignment of collagen fibrils. Thus, the difference between NIR depths of penetration is likely attributable at least in part to these features. Another difference between that study and the current study is the fact that our polystyrene plate was 0.54 mm thick whereas the parafilm was only ∼ 0.1 mm thick. This difference in plastic thickness would result in a change in overall pathlength the NIR radiation travels through the samples and underlying plastic, resulting in what appears to be reduced penetration depth through the cartilage. However, since the thickness of 0.54 mm is closer to what would be observed for subchondral bone, the results from the current study more closely resemble the physiological condition. A previous study by Spahn et al. used a ratio of the NIR water absorbance band at 7017 cm-1 to the 8510 cm-1 matrix absorbance, and considered this as an indicator of cartilage water content20. According to our results, the depth of penetration of NIR radiation at this spectral range is greater than 5 mm. Therefore the spectral absorbance collected in this region not only resulted from the cartilage but also from the subchondral bone underneath.
The NIR spectral range we used in this study was from 4000-10000 cm-1. The absorbances in this region arise from combination, first and second overtones of the fundamental vibrations in the mid-infrared regions. The absorbance intensity is inversely proportional to the order of overtone thus making the analysis difficult and complicated37, 38. A recent study from our group showed that the absorbances from cartilage matrix components, (collagen type II and chondroitin sulfate), in the 4000-5000 cm-1 spectral region, could be used to assess cartilage composition24. Similarly, we showed that the water absorbance at 5200 cm-1, which arises from bound and free water, and the 6890 cm-1 free water absorbance, could be used to assess water content23. Together, these studies show that the NIR spectral region from 4000-7000 cm-1 could prove to be an important region to assess cartilage quality based on matrix composition, and thus provide support for focusing on this region for evaluation of tissue pathology.
Recently, NIR has been used to develop a non-destructive method to determine the thickness of cartilage25. In that study, NIR spectra were collected from 1.2 mm to 2.4 mm thick cartilage samples from bovine samples. Partial least square (PLS) models with various NIR spectral ranges from 4000-12000 cm-1 were built to correlate NIR spectra with the cartilage thickness, with the results of the PLS varying from 53% to 93% for correct thickness prediction. The best results were from the 5350-8850 cm-1 region, and the lowest correlation from higher wavenumbers, i.e. 8000-12000 cm-1. According to our results, the depth of penetration of NIR radiation in this range is more than 4 mm. Therefore the absorbance in this range are a combination of cartilage and the subchondral bone, and possibly primarily from subchondral bone, which could result in a poor thickness prediction. However, it's also possible that the differences in subchondral bone contributions in the spectra could aid in the thickness assessment in the lower frequency region.
There were some limitations of our study, including the fact that the tissue sections were cut parallel to the cartilage surface, and thus differences in organization or composition in different zones could impact the results. In essence, this means that samples of different thicknesses could contain either, e.g., both superficial and middle zone cartilage, or only middle or deep zone cartilage, or middle plus deep zone cartilage. Our results from the imaging data analysis showed that the distribution of water and matrix components varies among the different zones. This is most relevant to our fiber optic studies if thinner cartilage tissues are evaluated in the lower frequency NIR spectral regions, and there could be a question as to whether having the dense, collagenous superficial zone intact would result in reduced penetration depth. To address this, a separate experiment was conducted in a similar manner as the rest of the study with 1 mm samples that contained superficial and middle zone cartilage to assess whether the zonal differences did in fact affect the depth of penetration. We found that the NIR spectra collected from these samples on top of polystyrene showed polystyrene peaks in all regions, in agreement with the results presented previously (data not shown). Another issue to address is the fact that we did not evaluated degraded tissue samples. Degraded cartilage is less dense and fibrillated due to the loss of proteoglycans and damage to the collagen fibers. In this case, it is possible that the depth of penetration would be even greater through the tissue, compared to normal cartilage. Thus, it's possible that we should consider further limiting the spectral range of analysis for such samples if we want to exclude the contribution of subchondral bone. Human adult normal and degraded cartilage should be evaluated in future studies to confirm the depth of penetration of NIR radiation in these physiologically relevant tissues.
Potential applications of NIR probe evaluation of cartilage include for animal model studies, where a non-destructive method could be used to understand the effects of therapeutics and rehabilitation protocols in longitudinal studies. Clinically, intra-articular injuries are the most common injuries in young athletes, such as meniscus and ligament tears39. Currently, arthroscopic evaluation is the gold standard method for investigation of symptoms related to early stages of cartilage degeneration. However, they can be somewhat subjective as they rely on the perception of the surgeon performing the procedure. The use of NIR probes has the potential to play an important role in monitoring early degeneration of cartilage for the high risk patients, such as those with prior anterior cruciate ligament or meniscus injury. Since the data obtained is less subjective than that from visual arthroscopy, it is possible that more precise results on how to stage cartilage could be obtained. Further, since arthroscopy is currently the preferred method for evaluation of intra-articular tissues, addition of NIR fiber optic probe data, which could be obtained through an arthroscopic port, could prove to be an important tool to study the pathology of injury and repair. Improved understanding of the features of the NIR spectra is critical for implementation of this methodology for tissue evaluation.
Conclusion
The results from this study demonstrated that the depth of penetration of NIR radiation into articular cartilage varies throughout the spectral range, 4000-10000 cm-1, from 0.5 mm to at least 5 mm. The optimal NIR frequency range to ensure the absorbances being evaluated are only from cartilage and not from the subchondral bone is no higher than 7000 cm-1.
Acknowledgments
This study was supported by NIH AR056145 and EB000744.
References
- 1.Poole AR, Kojima T, Yasuda T, Mwale F, Kobayashi M, Laverty S. Clinical orthopaedics and related research. 2001:S26–S33. doi: 10.1097/00003086-200110001-00004. [DOI] [PubMed] [Google Scholar]
- 2.Huber M, Trattnig S, Lintner F. Investigative Radiology. 2000;35:573–580. doi: 10.1097/00004424-200010000-00003. [DOI] [PubMed] [Google Scholar]
- 3.Neogi T, Zhang Y. Rheumatic Disease Clinics of North America. 2013;39:1–19. doi: 10.1016/j.rdc.2012.10.004. [DOI] [PMC free article] [PubMed] [Google Scholar]
- 4.Huber M, Trattnig S, Lintner F. Invest Radiol. 2000;35:573–580. doi: 10.1097/00004424-200010000-00003. [DOI] [PubMed] [Google Scholar]
- 5.Caplan AI, Elyaderani M, Mochizuki Y, Wakitani S, Goldberg VM. Clinical orthopaedics and related research. 1997:254–269. [PubMed] [Google Scholar]
- 6.Oakley S, Portek I, Szomor Z, Appleyard R, Ghosh P, Kirkham B, Murrell G, Lassere M. Osteoarthritis and cartilage. 2005;13:368–378. doi: 10.1016/j.joca.2004.12.005. [DOI] [PubMed] [Google Scholar]
- 7.Maffulli N, Longo UG, Campi S, Denaro V. Evidence-Based Orthopedics. 2012:803–811. [Google Scholar]
- 8.Crawford R, Walley G, Bridgman S, Maffulli N. British medical bulletin. 2007;84:5–23. doi: 10.1093/bmb/ldm022. [DOI] [PubMed] [Google Scholar]
- 9.Spahn G, Klinger HM, Baums M, Pinkepank U, Hofmann GO. Archives of orthopaedic and trauma surgery. 2011;131:377–381. doi: 10.1007/s00402-011-1259-8. [DOI] [PubMed] [Google Scholar]
- 10.Spahn G, Klinger HM, Hofmann GO. Archives of orthopaedic and trauma surgery. 2009;129:1117–1121. doi: 10.1007/s00402-009-0868-y. [DOI] [PMC free article] [PubMed] [Google Scholar]
- 11.Billaud A, Moreau-Gaudry A, Girardeau-Montaut D, Billet F, Saragaglia D, Cinquin P. J Bone Joint Surg Proc. 2013;95:26–26. [Google Scholar]
- 12.Koff MF, Amrami KK, Kaufman KR. Osteoarthritis Cartilage. 2007;15:198–204. doi: 10.1016/j.joca.2006.07.007. [DOI] [PubMed] [Google Scholar]
- 13.Lusse S, Claassen H, Gehrke T, Hassenpflug J, Schunke M, Heller M, Gluer CC. Magn Reson Imaging. 2000;18:423–430. doi: 10.1016/s0730-725x(99)00144-7. [DOI] [PubMed] [Google Scholar]
- 14.Marik W, Apprich S, Welsch G, Mamisch T, Trattnig S. European Journal of Radiology. 2012;81:923–927. doi: 10.1016/j.ejrad.2011.01.124. [DOI] [PubMed] [Google Scholar]
- 15.Ding C, C F, J G. Nat Clin Pract Rheumatol. 2008;4:4–5. doi: 10.1038/ncprheum0676. [DOI] [PubMed] [Google Scholar]
- 16.Recht MP, Goodwin DW, Winalski CS, White LM. AJR American journal of roentgenology. 2005;185:899–914. doi: 10.2214/AJR.05.0099. [DOI] [PubMed] [Google Scholar]
- 17.Notingher I, Imhof RE. Skin Research and Technology. 2004;10:113–121. doi: 10.1111/j.1600-0846.2004.61.x. [DOI] [PubMed] [Google Scholar]
- 18.Wartewig S, Neubert RH. Advanced drug delivery reviews. 2005;57:1144–1170. doi: 10.1016/j.addr.2005.01.022. [DOI] [PubMed] [Google Scholar]
- 19.Afara IO, Oloyede A. Near Infrared Spectroscopy Evaluation of Articular Cartilage: Decision-Making in Arthroplasty: Real-Time Assessment of Articular Cartilage. LAP Lambert Academic Publishing; 2012. [Google Scholar]
- 20.Spahn G, Plettenberg H, Kahl E, Klinger HM, Muckley T, Hofmann GO. BMC Musculoskelet Disord. 2007;8:47. doi: 10.1186/1471-2474-8-47. [DOI] [PMC free article] [PubMed] [Google Scholar]
- 21.Spahn G, Plettenberg H, Nagel H, Kahl E, Klinger HM, Muckley T, Gunther M, Hofmann GO, Mollenhauer JA. Med Eng Phys. 2008;30:285–292. doi: 10.1016/j.medengphy.2007.04.009. [DOI] [PubMed] [Google Scholar]
- 22.Baykal D, Irrechukwu O, Lin PC, Fritton K, Spencer RG, Pleshko N. Applied spectroscopy. 2010;64:1160–1166. doi: 10.1366/000370210792973604. [DOI] [PMC free article] [PubMed] [Google Scholar]
- 23.Padalkar MV, Spencer RG, Pleshko N. Ann Biomed Eng. 2013;41:1–11. doi: 10.1007/s10439-013-0844-0. [DOI] [PMC free article] [PubMed] [Google Scholar]
- 24.Palukuru UP, McGoverin CM, Pleshko N. Matrix Biology. 2014 doi: 10.1016/j.matbio.2014.07.007. [DOI] [PubMed] [Google Scholar]
- 25.Afara I, Singh S, Oloyede A. Med Eng Phys. 2012;35:88–95. doi: 10.1016/j.medengphy.2012.04.003. [DOI] [PubMed] [Google Scholar]
- 26.Afara I, Singh S, Oloyede A. J Mech Behav Biomed. 2012:249–258. doi: 10.1016/j.jmbbm.2012.11.022. [DOI] [PubMed] [Google Scholar]
- 27.Brown CP, Bowden JC, Rintoul L, Meder R, Oloyede A, Crawford RW. Phys Med Biol. 2009;54:5579–5594. doi: 10.1088/0031-9155/54/18/015. [DOI] [PubMed] [Google Scholar]
- 28.Spahn G, Felmet G, Hofmann GO. Arch Orthop Trauma Surg. 2013;133:1–6. doi: 10.1007/s00402-013-1747-0. [DOI] [PubMed] [Google Scholar]
- 29.Afara I, Prasadam I, Crawford R, Xiao Y, Oloyede A. Osteoarthr Cartil. 2012;20:1367–1373. doi: 10.1016/j.joca.2012.07.007. [DOI] [PubMed] [Google Scholar]
- 30.McGoverin CM, Lewis K, Yang X, Bostrom MPG, P N. Applied spectroscopy. 2014;68:1168. doi: 10.1366/13-07327. [DOI] [PMC free article] [PubMed] [Google Scholar]
- 31.Faris F, Thorniley M, Wickramasinghe Y, Houston R, Rolfe P, Livera N, Spencer A. Clin Phys Physiol Meas. 1991;12:353. doi: 10.1088/0143-0815/12/4/005. [DOI] [PubMed] [Google Scholar]
- 32.Lammertyn J, Peirs A, De Baerdemaeker J, Nicolai B. Postharvest Biol Technol. 2000;18:121–132. [Google Scholar]
- 33.Li G, Park SE, DeFrate LE, Schutzer ME, Ji L, Gll TJ, Rubash HE. Clinical biomechanics. 2005;20:736–744. doi: 10.1016/j.clinbiomech.2005.04.001. [DOI] [PubMed] [Google Scholar]
- 34.Shepherd D, Seedhom B. Annals of the rheumatic diseases. 1999;58:27–34. doi: 10.1136/ard.58.1.27. [DOI] [PMC free article] [PubMed] [Google Scholar]
- 35.Karvonen R, Negendank W, Teitge R, Reed A, Miller P, Fernandez-Madrid F. The Journal of rheumatology. 1994;21:1310–1318. [PubMed] [Google Scholar]
- 36.Boskey A, Pleshko Camacho N. Biomaterials. 2007;28:2465–2478. doi: 10.1016/j.biomaterials.2006.11.043. [DOI] [PMC free article] [PubMed] [Google Scholar]
- 37.Büning-Pfaue H. Food Chemistry. 2003;82:107–115. [Google Scholar]
- 38.Cen H, He Y. Trends in Food Science & Technology. 2007;18:72–83. [Google Scholar]
- 39.Swenson DM, Collins CL, Best TM, Flanigan DC, Fields SK, Comstock R. 2005 [Google Scholar]


