

Abstract
Site-specific incorporation of non-standard amino acids (NSAAs) into proteins opens the way to novel biological insights and applications in biotechnology. Here, we describe the development of a high yielding cell-free protein synthesis (CFPS) platform for NSAA incorporation from crude extracts of genomically recoded Escherichia coli lacking release factor 1. We used genome engineering to construct synthetic organisms that, upon cell lysis, lead to improved extract performance. We targeted five potential negative effectors to be disabled: the nuclease genes rna, rnb, csdA, mazF, and endA. Using our most productive extract from strain MCJ.559 (csdA− endA−), we synthesized 550±40 μg mL−1 of modified superfolder green fluorescent protein containing p-acetyl-l-phenylalanine. This yield was increased to ∼1300 μg mL−1 when using a semicontinuous method. Our work has implications for using whole genome editing for CFPS strain development, expanding the chemistry of biological systems, and cell-free synthetic biology.
Keywords: cell-free protein synthesis, genome engineering, non-standard amino acids, release factor 1, synthetic biology
Introduction
Crude extract-based cell-free protein synthesis (CFPS) has emerged as a powerful technology platform to study, exploit, and expand the capabilities of biological systems.[1] In recent years, for example, Escherichia coli-based CFPS platforms have been applied to the clinical manufacture of therapeutics on the 100 L scale,[2] biomolecular breadboarding,[3] and site-specific incorporation of non-standard amino acids (NSAAs) into proteins.[4] Site-specific incorporation of NSAAs into proteins has opened new opportunities for the production and study of biopolymers with chemical properties, structures, and functions that are impossible to create from only the 20 canonical amino acids. Some illustrative examples of these pioneering efforts include the synthesis of antibody–drug conjugates,[5] the direct polymerization of protein-based materials,[6] and structural assessment of enzyme inhibitors for drug discovery.[7]
Amber suppression is the most common approach for freeing up codons to site-specifically incorporate NSAAs into proteins. In this approach, an orthogonal transfer RNA (o-tRNA) is reprogrammed to suppress an in-frame amber stop codon. This requires multiple biological parts. These include: 1) NSAA-charged o-tRNA substrates that can decode the amber codon (typically produced by an orthogonal aminoacyl-tRNA synthetase (o-aaRS) that is only able to charge a NSAA to its cognate o-tRNA, which is not aminoacylated by the cell's endogenous aaRSs), 2) proper delivery of NSAA-charged o-tRNA substrates by elongation factor Tu (EF-Tu) to the ribosome, and 3) compatible ribosomes.[8] Many seminal works by Schultz and others have established and driven the field forward.[9] Unfortunately, the technology has been limited by release factor 1 (RF1) competition, which leads to poor expression yields, mainly due to the high level of truncated product,[10] and inefficient incorporation of multiple identical NSAAs.[4b,11] Many elegant efforts have focused on alleviating this limitation in vitro. For example, researchers have 1) omitted RF1 by using reconstituted systems,[10–12] 2) silenced RF1 with antibodies or aptamers,[13] or 3) removed tagged RF1 from crude lysates.[4a,14] Recently, in vivo efforts have made significant advances in the production of RF1-deficient strains[11] that could be used as a chassis to make crude extracts for CFPS.[15] Indeed, we recently showed the ability to use a genomically recoded RF1-deficient E. coli strain (rEc.E13.ΔprfA) to improve production of modified full-length soluble superfolder green fluorescent protein (sfGFP) containing p-propargyloxy-l-phenylalanine (pPaF).[4b] We observed a shift from 20% full-length product (with RF1) to 80% full-length product (without RF1).
The goal of this work was to improve CFPS yields from rEc.E13.ΔprfA crude extracts. Such an advance will facilitate new technological applications and provide opportunities to take advantage of cost benefits, yield improvements, and freedom of design for NSAA incorporation as compared to in vivo methods.[15] Because rEc.E13.ΔprfA[11] was not previously optimized for CFPS,[4b] we exploited multiplex automated genome engineering (MAGE)[16] to improve extract performance. The key idea was to functionally inactivate negative effectors in the host strain such that they would not be present in the lysate. Previously, deletion of genes for stabilizing DNA templates,[17] amino acid supply,[18] and protein degradation[19] has improved CFPS systems from other source strains.
Results and Discussion
Strain construction by MAGE
We targeted the functional inactivation of five nucleases, encoded by rna, rnb, csdA, mazF, and endA (Figure 1A). In vivo, these nucleases play important roles in regulating DNA and RNA through degradation. However, their presence in crude cell extracts is expected to be deleterious,[20] leading to template instability and reaction termination. RNase A (encoded by rna) degrades RNA by catalyzing the cleavage of phosphodiester bonds,[21] and identification of strains (e.g., MRE600, A19) lacking rna was important for early studies in in vitro translation. RNase II (encoded by rnb) is responsible for mRNA decay by 3′ to 5′ exonuclease activity,[22] and cell extracts lacking RNase II exhibit a 70% increase in CFPS efficiency.[20] MazF (encoded by mazF) is a toxin that degrades mRNA by sequence-specific (ACA) endoribonuclease activity, which could affect transcript stability.[23] CsdA (encoded by csdA) is part of a cold shock degradosome along with RNase E and induces mRNA decay in cold shock, which the cells experience during harvest prior to extract generation.[24] Finally, DNA-specific endonuclease I (encoded by endA) breaks double-stranded DNA,[25] and its deletion has previously been shown to be important for extending the duration of CFPS reactions.[17] We hypothesized that nuclease deletion could stabilize both the DNA template and mRNA transcripts, leading to improved yields.[20-25]
Figure 1.
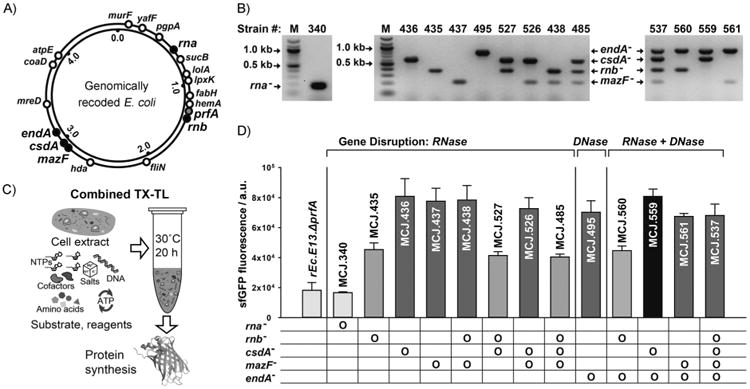
Strain construction, verification, and cell-free protein synthesis performance. A) Genomic locations of five nuclease-encoding genes (black circles), prfA (gray circle), and 13 genes with stop codons re-coded from TAG to TAA (white circles). Numbers in inner circle indicate millions of bases. B) Verification of nuclease gene mutations by using multiplex allele-specific PCR. Mutant alleles were amplified by using the mutant forward and reverse primer sets (-mut-F and -R; Table S1). Mutant strain numbers are indicated at the top of the gels. A table in (D) details mutations per each strain. M: DNA ladder. C) Scheme of combined transcription–translation (TX–TL) reaction for sfGFP CFPS. D) Comparison of CFPS efficiency of different cell extracts. Active wild-type sfGFP was synthesized by using cell extracts derived from genomically recoded E. coli with single and multiple inactivation of nucleases. At least three independent reactions for each sample were performed for 20 h at 30°C, and one standard deviation is shown.
We first engineered the rEc.E13.ΔprfA strain by disrupting the RNase genes, both individually and in combinations, using MAGE (Figure 1A). Specifically, we used MAGE oligos to introduce an internal stop signal (TAA codon) and frame shift mutation ∼¼ into the open reading frame of the target gene (Table S1). We generated single disruptions of rna, rnb, csdA, and mazF, as well as multiple disruptions of rnb, csdA, and mazF, in different combinations to create a series of RNase mutants (Table S2). Gene disruptions were screened by multiplex allele-specific PCR that amplified PCR bands specific to each mutation (Figure 1B) and confirmed by DNA sequencing. We then measured growth rates for each of the MAGE-modified strains in 2×YTPG media (the medium used in preparation of cell lysates) to determine how the gene disruptions might affect cellular fitness. Growth rates of the strains with single or multiple disruptions of rna, rnb, csdA, and mazF were approximately ± 25% relative to the strain rEc.E13.ΔprfA, with the exception of the rnb and mazF double disruption (MCJ.438), which displayed a significant growth defect (Table S3).
Inactivation of RNase II, CsdA, and MazF improves CFPS by reducing mRNA degradation
Lysates from each engineered strain were tested in CFPS to assess their overall protein synthesis capability. For rapid screening, we prepared lysates from shake flask cultures and a syringe-based homogenization method that contrasts our previous work, which used a fermenter for cell growth.[4b] CFPS of sfGFP was carried out in 15 μL combined transcription-translation (TX-TL) reactions for 20 h at 30°C (Figure 1C). The rna mutation was selected first because of its presence in the commonly used CFPS A19 and MRE600 source strains.[26] However, functional inactivation of rna (MCJ.340) in rEc.E13.ΔprfA did not impact wild-type sfGFP synthesis, as measured by fluorescence, when compared to the parent strain (Figure 1D). In contrast, single disruption of rnb, csdA, or mazF increased CFPS yields by two- to fourfold (Figure 1D). Next, we investigated the effect of disabling multiple RNase genes together (rnb, csdA, and mazF) in CFPS. CFPS yields were not improved among those combinations of gene disruption and, in fact, decreased in some cases (MCJ.527 and MCJ.485; Figure 1D). Taken together, our results show that inactivation of RNase II, CsdA, and MazF are beneficial for CFPS. However, disabling rnb in combination with other RNase genes investigated was not beneficial.
To test our hypothesis that inactivation of RNases would stabilize mRNA in our reactions, we carried out cell-free TL-only reactions for 120min at 30°C, priming the reaction with purified mRNA template from the sfGFP gene (600 ng per 15 μL reaction), as opposed to DNA template. Without the ability to replenish mRNA from T7 RNA polymerase, as was possible in combined TX-TL experiments used above (Figure 1D), we could now observe the impact of the genomic changes on RNA stability. For this analysis, we specifically focused on extracts from the single gene disruption strains: MCJ.435 (rnb−), MCJ.436 (csdA−), and MCJ.437 (mazF−). As compared to the extract from the parent strain (rEc.E13.ΔprfA), disruption of mazF, csdA, and rnb increased cell-free translation 13-, 11-, and fourfold, respectively (Figure 2A, left). In addition to quantifying sfGFP synthesis by cell-free TL-only reactions in lysates from different genomically modified strains, we also examined the mRNA degradation profiles by incubating 1800 ng of purified sfGFP mRNA in the cell-free reaction. As expected, mRNA levels were maintained at higher levels in extracts from RNase-deficient strains. Specifically, more than ∼60% of sfGFP mRNA remained after 120 min incubation with the extracts from single disruption of mazF or csdA, whereas 16% remained with rnb disruption, and mRNA levels in the parent extract derived from rEc.E13.ΔprfA were entirely degraded (Figure 2A, right). These results were consistent with the TX–TL reactions (Figure 1D) and indicate that inactivating RNases from the lysate source strain reduces mRNA degradation and, in turn, improves CFPS.
Figure 2.
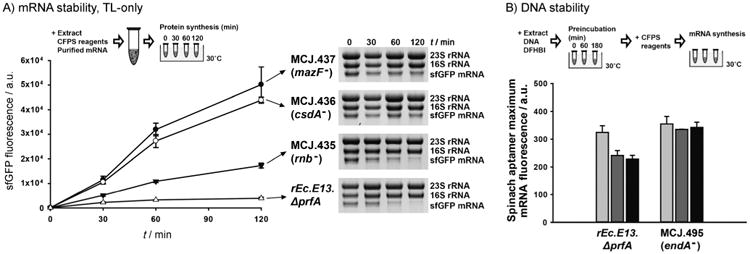
The impact of functionally inactivating nucleases on cell-free transcription and translation. A) Cell-free translation (TL)-only reactions of wild-type sfGFP from purified mRNA in different single RNase-deficient cell extracts. At least three independent reactions for each sample were performed for 120 min at 30°C. sfGFP synthesis was monitored by sfGFP fluorescence (left), and mRNA levels were assessed by an RNA gel (right). B) Cell-free Spinach aptamer synthesis by using endonuclease I-deficient (MCJ.495) and -present (rEc.E13.ΔprfA) extracts. After preincubation (0 (
 ), 60 (
 ), and 180 min (■)) of Spinach aptamer plasmid DNA with cell extract, CFPS reagents were added and incubated at 30°C. Maximum mRNA synthesis levels from the mRNA synthesis time course (Figure S2) were compared. At least three independent reactions for each sample were performed, and one standard deviation is shown.
Inactivation of endonuclease I improves CFPS by stabilizing the DNA template
We next investigated the effects of disrupting the DNA-specific endonuclease I (MCJ.495). It has previously been observed that an endA deletion strain exhibits increased plasmid DNA production in vivo,[27] but its role was not clear in vitro, as the endA deletion was previously assessed only in combination with recCBD deletion.[17] In CFPS reactions performed with extracts from source strains lacking endonuclease I (MCJ.495), we observed a greater than fourfold increase in sfGFP synthesis compared to that of rEc.E13.ΔprfA (Figure 1D).
We hypothesized that the improved CFPS yields were a result of plasmid DNA stability. To test this hypothesis, we directly incubated plasmid DNA in the extract alone and monitored plasmid DNA stability by gel electrophoresis. We did not detect differences in plasmid DNA concentrations when comparing extracts with or without endonuclease I (Figure S1); however, our results could be confounded by the fact that DNase activity can be inhibited in cell extracts.[28] Thus, we tried an alternative approach that better mimicked our CFPS conditions. The key idea was to preincubate plasmid DNA with extracts from strains with or without endonuclease I, followed by CFPS (Figure 2B). If the DNA template was degraded during preincubation, or the transcription reaction was inhibited by endonuclease I in some way, less mRNA would be synthesized, which in turn could be responsible for higher CFPS yields when endA was disabled. Plasmid DNA containing the mRFP1-Spinach aptamer gene (Table S2) was pre-incubated with cell extract and a fluorophore molecule, 3,5-difluoro-4-hydroxybenzylidene imidazolinone (DFHBI), for 0, 60, and 180 min. Then, mRNA was synthesized upon addition of CFPS reagents and quantified by measuring the fluorescence of DFHBI-bound Spinach aptamer mRNA.[29] Similar levels of Spinach aptamer mRNA were synthesized in MCJ.495 (endA−) extracts before and after the preincubation. In contrast, the extract with endonuclease I (rEc.E13.ΔprfA) decreased the maximum mRNA synthesis level by 25% after preincubation (Figure 2B and S2). These results support the hypothesis that endA disruption improves CFPS by helping stabilize the DNA template.
As inactivating endonuclease I was beneficial for CFPS, we subsequently applied MAGE to create a variety of endA- and RNase-disrupted strains (Table S2). Although we had hoped to observe a synergistic effect from combining these beneficial mutations, we did not observe further improvement (Figure 1D). Most likely, inactivation of a single RNase or endonuclease I facilitates sufficient mRNA in the reaction, resulting in different substrates or protein effectors (e.g., amino acid supply,[18] protein degradation[19]) now limiting CFPS.
Genomically modified strains provide unique benefits for CFPS
We then carried out a series of optimization experiments to see if the genomically modified source strains provided unique benefits for CFPS or if yield improvements could have simply been achieved by optimization of reaction conditions using the original host (rEc.E13.ΔprfA). For this analysis, we selected the MCJ.559 (csdA− endA−) strain, which had the highest CFPS yields (Figure 1D). We specifically explored the impact of altering the DNA plasmid concentration, changing the T7 RNA polymerase concentration, and adding RNase inhibitor in CFPS reactions with lysates derived from strain MCJ.559 and the parent. Increasing the concentrations of plasmid DNA (Figure S3 A) or T7 RNA polymerase (Figure S3 B) with the parent rEc.E13.ΔprfA extract did not improve sfGFP synthesis. In fact, CFPS yields decreased. Furthermore, the current concentrations of plasmid DNA (13.3 ng μL−1) and T7 RNA polymerase (0.1 μg μL−1) used in this study were already optimal, as similar trends were obtained in the extract from MCJ.559 (Figure S3 AB). Addition of RNase inhibitor to CFPS reactions also did not improve protein synthesis (Figure S3 C). Together, our data indicates that the improvement of CFPS comes from the nuclease disruptions and is not achievable by simply adjusting the initial cell-free components.
MAGE gene disruption is robust and stable
We also confirmed that the mutations generated by MAGE were not reverted. After 250 generations of the MCJ.559 strain in a rich medium, the cell growth rate was similar (within 4%) compared to the strain before 250 generations (Figure 3A), the extract performance was the same (Figure 3B), and mutations of prfA, csdA, and endA were preserved, as confirmed by PCR for all three and DNA sequencing for csdA and endA disruption (Figure 3C). These results highlight that the MAGE gene disruption approach is robust and stable on time horizons that would be associated with a seed train in the laboratory.
Figure 3.
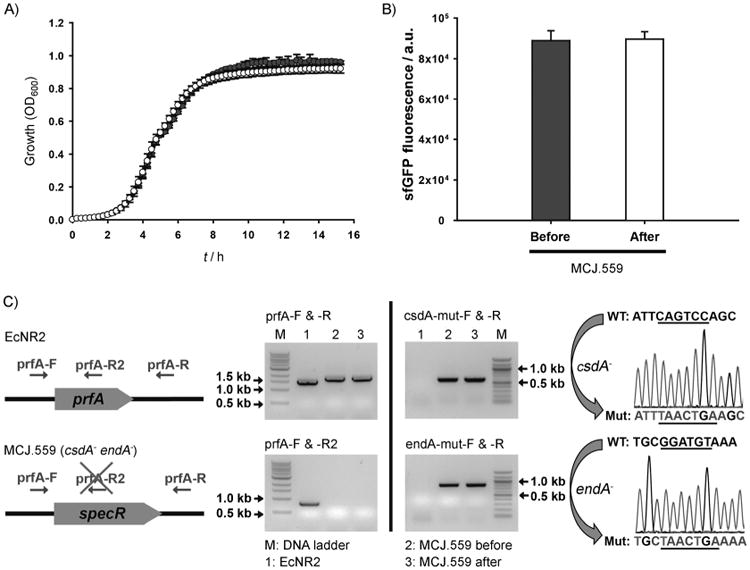
Assessing stability of the MCJ.559 strain. A) Growth of MCJ.559 before (●) and after (○) 250 generations was assayed in LB medium at 32°C in 96-well plates. Each data point is the average of ten replicate wells from two independent cultures. B) CFPS of sfGFP by using an MCJ.559 crude extract before and after 250 generations shows that extract performance was the same. At least three independent CFPS reactions for each sample were performed for 20 h at 30°C. C) PCR verification of prfA, csdA, and endA mutation. “specR” indicates spectinomycin resistance gene in replacement of prfA. On the right is a trace of DNA sequencing results for the csdA and endA mutation showing the introduction of the TAA stop codon at the desired location.
MAGE-improved extract enhances single and multiple identical NSAA incorporation
With CFPS improvements from engineered strains in hand, we assessed NSAA incorporation in extracts from our best strain. To do so, we first prepared crude extract from the MCJ.559 strain grown in a 10 L fermenter, which provides exquisite control over growth conditions.[30] In this case, o-tRNA was constitutively expressed during the cell growth as previously reported.[31] As a positive control, we then tested wild-type sfGFP synthesis in a cell-free reaction by using the fermenter-prepared extract. We obtained 660±40 μg mL−1 of wild-type sfGFP, which was similar to the yields obtained with extract prepared from a shake flask (Figure S4). For NSAA incorporation, we quantitatively tested the incorporation of p-acetyl-l-phenylalanine (pAcF) into sfGFP with an in-frame amber codon at single and multiple positions (Table S2). The necessary components of the orthogonal translation system (OTS) were also added. Specifically, we added 10 μg mL−1 linear DNA of optimized o-tRNA (o-tRNAopt) in the cell-free reaction for in situ synthesis of additional o-tRNA (i.e., beyond that overexpressed in the source strain).[4b, c] The orthogonal pAcF-tRNA synthetase (pAcFRS) was overproduced, purified as previously described,[4b] and added at a level of 0.5 mg mL−1 in the cell-free reaction. The NSAA, pAcF, was supplied at a level of 2 mm in each CFPS reaction.
We synthesized 550±40 μg mL−1 of modified sfGFP containing a single pAcF, which represents an ∼84% yield as compared to wild-type sfGFP production (Figure 4A). In addition, we obtained a 540±20 μg mL−1 yield for modified protein synthesis for two pAcF incorporations (81% yield) and 330±10 μg mL−1 for five pAcF incorporations (50% yield; Figure 4A). These results represent a threefold improvement in modified sfGFP synthesis as compared to our previous work on rEc.E13.ΔprfA extract,[4b] as well as more than a tenfold higher protein expression titer (in gL−1) compared to recent in vivo NSAA incorporation into GFP.[10,32] Furthermore, the modified protein synthesis titer was ∼2.8 times higher in MCJ.559 extracts than those from a BL21 Star (DE3) extract which contains RF1, whereas the wild-type sfGFP synthesis was similar with both extracts (Figure S5). Thus, the MAGE-improved MCJ.559 extract significantly increased the synthesis of proteins containing NSAAs.
Figure 4.
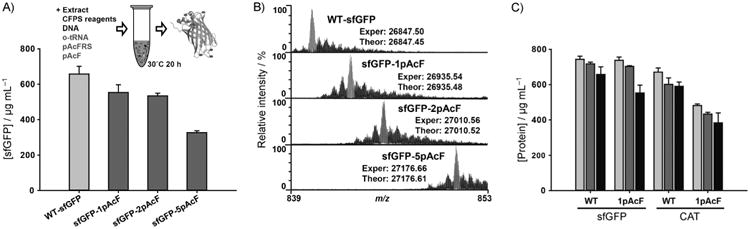
pAcF incorporation at single and multiple amber sites by using the improved cell extract from the MCJ.559 strain. A) Yields of active wild-type sfGFP (WT-sfGFP) and modified sfGFP proteins containing one, two, and five pAcFs. B) Spectrum of the 32+ charge state of sfGFP, obtained by top-down mass spectrometry and illustrating site-specific incorporation of pAcF at single and multiple sites. Major peaks (gray) in each spectrum coincide with the theoretical peaks for each species (Figure S6). “Exper” indicates experimentally obtained protein mass, and “Theor” indicates theoretically calculated protein mass (Table S4). Smaller peaks to the right of the major peaks are due to oxidation of the protein—a common electrochemical reaction occurring during electrospray ionization. Water loss events from the intact sfGFP were detected at minor levels to the left of the major peaks. C) Comparison of total (
), soluble (
), and active (■) protein yields of sfGFP and CAT with and without single pAcF. At least three independent CFPS reactions for each sample were performed for 20 h at 30°C for (A) and (C), and one standard deviation is shown.
We then carried out top-down mass spectrometry (i.e., MS analysis of whole intact proteins) to detect and provide semi-quantitative information for the incorporation of pAcF into sfGFP. Figure 4B shows the 32+ charge state of sfGFP and clearly illustrates mass shifts corresponding to the incorporation of one, two, and five pAcF residues. Site-specific incorporation of pAcF, as detected by MS, was greater than 95% in all samples (Figure 4B), with less than 3 ppm difference between experimental and theoretical protein masses (Table S4 and Figure S6). In other words, we achieved efficient, high yielding, and pure site-specific pAcF incorporation into sfGFP. To demonstrate that our observations were not limited to sfGFP, we also examined pAcF incorporation into chloramphenicol acetyl transferase (CAT). Active CAT containing pAcF was synthesized at titers of 380±60 μg mL−1, with a ∼65% yield of wild-type protein production (Figure 4C). Hence, the MAGE-enhanced extract provides the synthesis of soluble and active proteins containing pAcF, like wild-type proteins, and may be applied for different types of protein production.
CFPS with MAGE-improved extract is scalable
We then set out to demonstrate the potential for scale-up in CFPS reactions that incorporate NSAAs into proteins. Specifically, we tested the effect of increasing the CFPS reaction volume in both a microcentrifuge tube and a flat-bottom 24-well plate. By increasing the reaction volume from 15 to 240 μL, the efficiency of wild-type sfGFP production significantly decreased in the microcentrifuge tube, whereas the same reactions in the flat-bottom 24-well plate did not decrease the protein yields (Figure 5A). We observed similar results for the synthesis of modified protein (Figure 5A). Our results are consistent with those of Voloshin and Swartz, who reported these phenomena previously; specifically, the impact of surface-area-to-volume ratios on CFPS yields.[33] In order to confirm that the decrease in production yield was not specific to active GFP formation (i.e., chromophore maturation), we measured total and soluble sfGFP production by radioactive [14C]Leu incorporation, which counts all synthesized sfGFP protein. Figure S7 clearly shows that total and soluble sfGFP synthesis was decreased as reaction volume was increased. This is consistent with our observations for active sfGFP synthesis (Figure 5A). We next assessed incubation time to see if the reduced CFPS yield as a function of increasing reaction volume was recovered by increasing incubation time. This was not the case. After 24 h, sfGFP production in all batch reactions was saturated and did not increase with further incubation time (Figure 5B). Modified sfGFP containing single pAcF showed similar results (Figure 5C). In summary, our results indicate that CFPS with RF1-deficient MCJ.559 extract is scalable when accounting for surface-area-to-volume effects.
Figure 5.
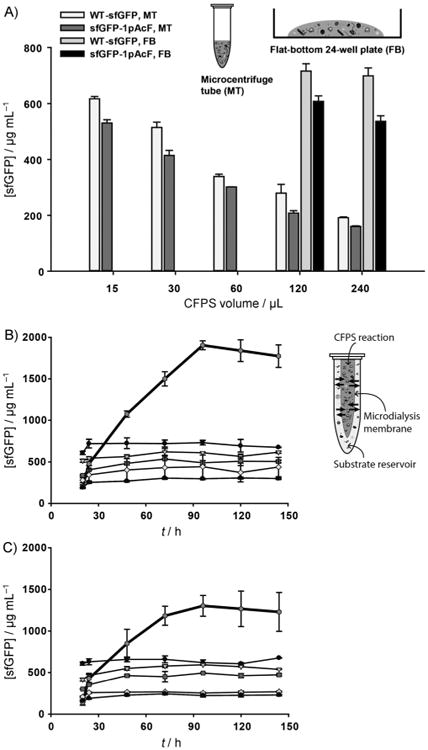
Scaled-up and semicontinuous CFPS by using an MCJ.559 extract. A) Production of wild-type sfGFP (WT-sfGFP) and modified sfGFP with pAcF (sfGFP-1pAcF) in different reaction volumes by using a microcentrifuge tube (MT) and a flat-bottom 24-well plate (FB). Time course semicontinuous and batch CFPS for B) WT-sfGFP and C) sfGFP-1pAcF. In the semicontinuous reaction (
 ), CFPS reagents from the substrate reservoir passively diffuse into the CFPS reaction (inward arrows) through the microdialysis membrane, while by-products are removed from the CFPS reaction (outward arrows). Batches were of 15 (●), 30 (
 ), 60 (
), 120 (⋄), and 240 μL (▲). At least three independent reactions for each sample were performed at 30°C, and one standard deviation is shown.
), 60 (
), 120 (⋄), and 240 μL (▲). At least three independent reactions for each sample were performed at 30°C, and one standard deviation is shown.
Semicontinuous CFPS increases protein production yield
We then applied semicontinuous CFPS[34] using a microdialysis device (3.5 K MWCO) to increase sfGFP production yield. In semicontinuous reactions, substrates and byproducts passively diffuse between the CFPS reaction and a substrate reservoir to sustain small molecule concentrations necessary to keep the reaction active. With a semicontinuous setup, wild-type sfGFP and modified sfGFP production were continually increased until 96 h, yielding titers of about 1900±50 and 1300± 100 μg mL−1, respectively (Figure 5B and C). We expect that these titers could be improved further if the external substrate reservoir was exchanged or the extract condensed, as in the pioneering work of Yokoyama.[35] That said, the modified protein titer from a semicontinuous CFPS setup was >20 times higher than those recently observed in cells on a gram per liter basis,[10, 32] joining a growing body of work showing improvement over in vivo titers when using CFPS.[4b,c,31, 36] Taken together, our results indicate that the yield was significantly improved by using a semicontinuous reaction setup. This is consistent with previous work from Ozawa et al., which showed the ability to produce high yields of protein with NSAAs by using a semicontinuous CFPS reaction setup and a standard E. coli strain.[36]
Conclusions
In this study, we improved RF1-deficient cell extract activity approximately fourfold by functional inactivation of multiple nucleases in extract source strains using MAGE. Using our most productive extract, which stabilizes mRNA and the DNA template by disabling csdA and endA, we could significantly enhance NSAA incorporation into a target protein. Our results are important for two reasons. First, the strain, which achieved a 1300±100 μg mL−1 yield of modified protein containing NSAAs in semicontinuous operation, can be a useful resource for the community. Second, this is the first demonstration of using advanced genome engineering methods to develop CFPS chassis strains, effectively combining the inactivation of nucleases and the deletion of RF1. This indicates rich opportunities to understand how the overall catalytic ensemble used to carry out CFPS is altered based on genomic modifications. Looking forward, we expect this work to open the way to novel CFPS technologies for accurate and efficient production of pure proteins and biopolymers containing multiple NSAAs.
Experimental Section
Strains and plasmids
The bacterial strains and plasmids used in this study are listed in Table S2. Spectinomycin (20 μg mL−1) was used for culturing strains, kanamycin (50 μg mL−1) was used for maintaining pY71-based plasmids, and tetracycline (20 μg mL−1) was used for maintaining the pDULE-o-tRNA plasmid.
Strain construction and verification
The strains in this study were generated from rEc.E13.ΔprfA[11] by disrupting genes of interest with mutagenic oligonucleotides by MAGE[37] (Table S1). Cultures were grown in lysogeny broth (LB)-Lennox medium (10 gL−1 tryptone, 5 gL−1 yeast extract, and 5 gL−1 NaCl)[16] at 32°C and 250 rpm throughout MAGE cycling steps. MAGE oligonucleotides were designed to introduce an internal stop codon and frameshift of ∼¼ into the target gene sequence, thereby causing early translational termination as previously reported.[37] Single, double, triple, and quadruple disruptions of csdA, rnb, mazF, and endA, including single rna disruption, were generated to investigate the effect of their inactivation on CFPS (Table S2). Multiplex allele-specific colony PCR was performed to verify gene disruptions[16] by using wild-type forward (-wt-F) or mutant forward (-mut-F) primers and reverse primers (-R; Table S1). Wild-type and mutant forward primers were identical except at the 3′-ends of the oligonucleotides, and the reverse primers were used for detection of both wild-type and mutant alleles. The mutant allele could be amplified by using the mutant forward and reverse primer set (-mut-F and -R) but not the wild-type forward and reverse primer set (-wt-F and -R). MASC PCR was performed in 20 μL reactions by using a multiplex PCR kit (Qiagen) at 95°C for 15 min, with 30 cycles of 94°C for 30 s, 65°C for 30 s, and 72°C for 1 min, and a final extension of 72°C for 5 min. Mutant alleles were screened by running PCR products on a 2% agarose gel and confirmed by DNA sequencing by using sequencing primers (Table S1).
Growth rate assessment
Overnight cultures of engineered strains grown in LB[38] at 250 rpm and 34°C were diluted to an OD600 of 0.05 in 2×YTPG medium (16 gL−1 tryptone, 10 gL−1 yeast extract, 5 gL−1 NaCl, 7 gL−1 K2HPO4, 3 gL−1 KH2PO4, and 18 gL−1 glucose; adjusted to pH 7.2 with KOH). Diluted cultures (100 μL) were added to 96-well polystyrene plates (Costar 3370; Corning Incorporated, Corning, NY, USA). The OD600 was measured at 15 min intervals for 15 h at 34°C in fast shaking mode on a Synergy2 plate reader (Biotek, Winooski, VT). Growth data for each strain was obtained from six replicate wells with two independent cultures. Doubling time was calculated during the early exponential growth phase (OD600 = 0.05–0.2).
Cell extract preparation
Cells were grown to an OD600 of 4.0 in 2×YTPG medium (2 L) in Tunair shake flasks (1 L culture in each 2.5 L flask) at 34°C and 220 rpm for rapid prototyping of engineered strains. In order to maintain pH∼7, KOH (1 mL, 1 n) was added at OD600 = 2.0. For the MCJ.559 strain harboring pDULE-o-tRNA, the best CFPS performer, cells were grown in 2×YTPG medium (10 L) in a BIOSTAT C-plus fermenter (Sartorious AG, Göttingen, Germany) to an OD600 of 3.0 at 34°C. Cells were pelleted by centrifuging for 15 min at 5000g and 4°C, washed with cold S30 buffer (3×10 mm tris·acetate pH 8.2, 14 mm magnesium acetate, 60 mm potassium acetate, 1 mm dithiothreitol),[39] and stored at −80°C. To make cell extract, cell pellets were thawed and suspended in S30 buffer (0.8–1 mL per gram of cells) and lysed in an EmulsiFlex-C3 homogenizer (Avestin, Ottawa, Canada) with a single pass at a pressure of ∼138–172 MPa. A chilled syringe was used to inject resuspended cells and collect lysed cells for the small volume of cell suspension prepared from shake flasks, and a chilled hopper was used for the cells harvested from fermentation. Cell debris and insoluble components were removed by two rounds of centrifugation for 30 min at 30000g and 4°C. The supernatant was incubated for 80 min at 120 rpm and 37°C in an empty run-off reaction to optimize the extract activity and then centrifuged for 15 min at 15 000g at 4°C. The supernatant was flash-frozen in liquid nitrogen and stored at −80°C until use. The total protein concentration of the extracts was 40–50 mg mL−1, as measured by Quick-Start Bradford protein assay kits (Bio-Rad).
Purification of His-tagged pAcF-tRNA synthetase
BL21(DE3) harboring pY71-pAcFRS[4b] was grown in LB (1 L) to an OD600 of 1.0 at 220 rpm and 37°C. pAcF-tRNA synthetase (pAcFRS) was produced by adding isopropyl-β-d-thiogalactopyranoside (IPTG; 0.2 mm, Sigma–Aldrich) for 3 h. Cells were harvested at 5000g for 30 min at 4°C, washed with S30 buffer, and stored at −80°C. The frozen cell pellet was thawed in loading buffer (300 mm NaCl, 10 mm imidazole, 50 mm NaH2PO4, 5 mm Tris·HCl, pH 8.0),[40] lysed by using a homogenizer at ∼138–172 MPa, and centrifuged at 16000g and 4°C for 30 min. pAcFRS was purified on a 5 mL Ni-NTA column in a BioLogic DuoFlow FPLC system (Bio-Rad). The purified pAcFRS in the elution buffer (300 mm NaCl, 250 mm imidazole, 50 mm NaH2PO4, 5 mm Tris·HCl, pH 8.0)[40] was washed three times with S30 buffer by using an Amicon Ultracel YM-30 centrifugal filter and stored at −80°C by adding an equal volume of 80% glycerol. The concentration of purified pAcFRS was quantified by Bradford assay.
CFPS reaction
CFPS reactions were performed to evaluate incorporation of pAcF by using a modified PANOx-SP system.[41] Briefly, a 15 μL CFPS reaction in a 1.5 mL microcentrifuge tube was prepared by mixing the following components: ATP (1.2 mm); GTP, UTP, and CTP (0.85 mm each); folinic acid (34.0 μg mL−1); E. coli tRNA mixture (170.0 μg mL−1); plasmid (13.3 μg mL−1); T7 RNA polymerase (100 μg mL−1); 20 standard amino acids (2 mm each); nicotinamide adenine dinucleotide (NAD; 0.33 mm); coenzyme-A (0.27 mm); spermidine (1.5 mm); putrescine (1 mm); sodium oxalate (4 mm); potassium glutamate (130 mm); ammonium glutamate (10 mm); magnesium glutamate (12 mm); phosphoenolpyruvate (PEP; 33 mm), and cell extract (27% v/v). For NSAA incorporation, pAcF (2 mm), pAcFRS (0.5 mg mL−1), and linear DNA of o-tRNAopt (10 μg mL−1) were additionally added. Linear DNA of o-tRNAopt was amplified from pY71-T7-tz-o-tRNAopt plasmid and transcribed during the cell-free reaction.[4b] Furthermore, the o-tRNA was expressed in the source strain during the extract preparation.[4b] Each CFPS reaction was incubated for 20 h at 30°C unless noted otherwise. When adding RNase inhibitor, 1 μL (4 U) of inhibitor (Qiagen) was added into the 15 μL cell-free reaction as per the manufacturer's suggestion.
Quantification of active sfGFP
Active full-length sfGFP protein yields were quantified by measuring fluorescence using a Synergy2 plate reader with λex=485 nm, λem = 528 nm, and cut-off at 510 nm in 96-well half-area black plates (Costar 3694; Corning Incorporated), and the fluorescence units were converted into concentrations by using a standard curve as previously described.[4b]
Radioactive [14C]Leu assay
Total and soluble protein yields were quantified by determining radioactive [14C]Leu incorporation by using trichloroacetic acid (TCA).[39] Radioactivity of TCA-precipitated samples was measured by liquid scintillation counting (MicroBeta2; PerkinElmer).
mRNA stability assay
The sfGFP gene was PCR-amplified from the pY71 vector with T7-pro-F and T7-ter-R primers against the T7 promoter and the T7 terminator sequences (Table S1). The PCR-amplified linear template was then purified by using a PCR clean-up kit (Promega) and subsequently used as a template for in vitro transcription reactions according to the manufacturer's manual (Ribo-MAX Large Scale RNA Production System, Promega). The final concentration of mRNA was 1.8 mg mL−1. In order to track mRNA stability in our extracts, we replaced the plasmid sfGFP with the mRNA of sfGFP (1800 ng) in the CFPS reaction. For direct measurement of mRNA degradation, 5 μL samples were taken from CFPS reactions during incubation at 30°C and mixed with equal volumes of RNAprotect Bacteria Reagent (Qiagen, Valencia, CA) and brought to 100 μL with RNase free water. All samples were then purified by using an RNeasy Mini total RNA purification kit (Qiagen) according to the manufacturer's manual. Purified mRNA was visualized on a 2% formaldehyde agarose gel stained with GelRed (Biotium, Hayward, CA, USA).
DNA stability assay
We used pY71-mRFP1-Spinach plasmid (Table S2) to track DNA stability. A preincubation mixture containing 4 μL of cell extract, 12.96 ng μL−1 of pY71-mRFP1-Spinach plasmid,[29a] and 6 nm of 3,5-difluoro-4-hydroxybenzylidene imidazolinone (DFHBI; Lucerna, New York, NY, USA) was prepared on ice to minimize degradation of plasmid, and then incubated for 0, 60, and 180 min at 30°C. CFPS reaction components were added immediately after the preincubation step, and fluorescence of the Spinach aptamer binding to DFHBI was monitored for 180 min by using a CFX96 real-time (RT) PCR module installed on a C1000 Touch Thermal Cycler (Bio-Rad). The excitation and emission wavelengths of the fluorophore were 450–490 nm and 515–530 nm, respectively. The highest fluorescence was detected after 1 h incubation in the RT-PCR machine. For direct assessment of DNA degradation, 15 μL of plasmid DNA and extract mixture was prepared that contained 1 μg of pY71-sfGFP plasmid, 4 μL of extracts from the MCJ.495 or rEc.E13.ΔprfA strain, and 3 μL of S30 buffer. After incubation at 30°C for 0, 15, 30, and 60 min, samples were flash frozen in liquid nitrogen and stored at −20°C. To remove RNA, 100 μL of RNaseA-containing solution I from an E.Z.N.A. Miniprep kit (Omega Bio-Tek, Norcross, GA, USA) was added to the sample and incubated for 20 min at room temperature, then 200 μL of water was added. Proteins were precipitated by the same volume of phenol/chloroform/isoamyl alcohol (25:24:1) solution, and the plasmid was purified by using a DNA Clean & Concentrator kit (Zymo Research, Irvine, CA, USA). The purified plasmid was digested with BamHI at 37°C for 90 min to be linearized and was visualized on a 0.7% agarose gel.
Full-length sfGFP purification and mass spectrometry
To confirm pAcF incorporation at corresponding amber sites, semi-quantitative mass spectrometry (MS) analysis was performed on purified sfGFP with pAcF putatively incorporated. First, full-length sfGFP was purified from CFPS reactions by using C-terminal strep-tags and 0.2 mL gravity-flow Strep-Tactin Sepharose mini-columns (IBA GmbH, Gottingen, Germany) and concentrated by using Microcon YM-10 centrifugal filter columns (Millipore). The purified sfGFP protein was then analyzed by nanocapillary LC-MS using a 100 mm × 75 μm ID PLRP-S column in line with an Orbitrap Elite (ThermoFisher). All MS methods included the following events: 1) FT scan, m/z 400–2000, 120 000 resolving power and 2) data-dependent MS/MS on the top two peaks in each spectrum from scan event 1 by using higher-energy collisional dissociation (HCD) with normalized collision energy of 25, isolation width 15 m/z, and detection of ions with resolving power of 60 000. All data were analyzed by using QualBrowser, part of the Xcalibur software packaged with the ThermoFisher Orbitrap Elite (ThermoFisher). In Figure 4B, smaller peaks to the right of the colored peaks (Δm =+16 Da) are due to oxidation of the protein—a common electrochemical reaction occurring during electrospray ionization. To remove non-covalent salt and water adducts from intact proteins (in this case, sfGFP), a small level of in-source collision energy (15 eV) was applied. As a result, water loss events from the intact sfGFP (Δm = −18 Da) were detected at minor levels to the left of the major peak.
CAT plasmid construction
Gibson assembly was used for seamless construction of plasmids.[42] The wild-type chloramphenicol acetyl transferase (CAT) gene was amplified from pK7CAT[43] by using CAT-FW and -RV primers (Table S1), and the pY71 plasmid backbone was amplified from pY71-sfGFP by using pY71-FW and -RV primers (Table S1). Both PCR products were cleaned and mixed with Gibson assembly reactants as previously described[42] and incubated at 50°C for 60 min to construct the pY71-CAT plasmid (Table S2). Likewise, CAT-D112Amb, with a single amber site corresponding to Asp112,[44] was amplified from pREP-CMD112 to construct the pY71-CAT-D112amb plasmid (Table S2).
CAT activity assay
Active CAT production was quantified by determining the enzymatic activity of CAT. Cell-free reaction sample (100× diluted, 2 μL) was added to reagent mix (178 μL) containing acetyl-CoA (20 μL, 1 mm) and 5,5′-dithio-bis(2-nitrobenzoic acid) (DTNB; 20 μL, 4 mg mL−1). After incubation at 37°C for 15 min, chloramphenicol (20 μL, 1 mm) was added, and the solution was immediately mixed. The increase in A412 nm over approximately 5 min was recorded by using the Synergy2 plate reader, and ΔA412 nm min−1 was calculated. CAT activity of the cell-free synthesized sample was quantified by comparison to CAT standard activity (C8413, Sigma-Aldrich).
Scaled-up CFPS
Cell-free reaction volumes were increased from 15 to 240 μL in Axygen 1.5 mL polypropylene microcentrifuge tubes (MCT-150-C; Corning, Union City, CA, USA) and a flat-bottom 24-well polystyrene plate (353226; BD Biosciences, San Jose, CA, USA). There was appreciable volume loss due to evaporation in CFPS reactions with volumes less than 100 μL in the flat-bottom 24-well plate; thus, 120 and 240 μL reactions were tested. By filling the outer chambers surrounding the wells with water, which humidified the air, negligible sample evaporation was achieved. Reactions were performed at 30°C for 20 h.
Semicontinuous cell-free reaction
Cell-free reactions (120 μL) were carried out in a microdialysis device (3.5 K MWCO) in a Pierce 96-well Microdialysis Plate (Thermo Fisher Scientific).[34b] The microdialysis device interfaces with 1500 μL of dialysis buffer that contains CFPS reagents as described in the “CFPS reaction” section without T7 RNA polymerase, plasmid, cell extract, o-tRNAopt, or pAcFRS. Time course reactions were monitored at 30°C for 144 h.
Supplementary Material
Acknowledgments
This work was supported by the Office of Naval Research (N00014-11-1-0363), the Defense Advanced Research Projects Agency (N66001-12-C-4211), the NSF (MCB-0943383, DMR-1108350), the Army Research Office (W911NF-11-1-0445), and the National Institutes of Health (R01 GM 067193). M.C.J. is a David and Lucile Packard Foundation Fellow. R.W.M. is a Ford Fellow and an NSF Graduate Fellow.
Footnotes
Supporting information for this article is available on the WWW under http://dx.doi.org/10.1002/cbic.201402708.
References
- 1.a) Carlson ED, Gan R, Hodgman CE, Jewett MC. Biotechnol Adv. 2012;30:1185–1194. doi: 10.1016/j.biotechadv.2011.09.016. [DOI] [PMC free article] [PubMed] [Google Scholar]; b) Hodgman CE, Jewett MC. Metab Eng. 2012;14:261–269. doi: 10.1016/j.ymben.2011.09.002. [DOI] [PMC free article] [PubMed] [Google Scholar]; c) Swartz JR. AIChE J. 2012;58:5–13. [Google Scholar]
- 2.Zawada JF, Yin G, Steiner AR, Yang J, Naresh A, Roy SM, Gold DS, Heinsohn HG, Murray CJ. Biotechnol Bioeng. 2011;108:1570–1578. doi: 10.1002/bit.23103. [DOI] [PMC free article] [PubMed] [Google Scholar]
- 3.a) Sun ZZ, Yeung E, Hayes CA, Noireaux V, Murray RM. ACS Synth Biol. 2014;3:387–397. doi: 10.1021/sb400131a. [DOI] [PubMed] [Google Scholar]; b) Shin J, Noireaux V. ACS Synth Biol. 2012;1:29–41. doi: 10.1021/sb200016s. [DOI] [PubMed] [Google Scholar]
- 4.a) Loscha KV, Herlt AJ, Qi R, Huber T, Ozawa K, Otting G. Angew Chem Int Ed. 2012;51:2243–2246. doi: 10.1002/anie.201108275. [DOI] [PubMed] [Google Scholar]; Angew Chem. 2012;124:2286–2289. [Google Scholar]; b) Hong SH, Ntai I, Haimovich AD, Kelleher NL, Isaacs FJ, Jewett MC. ACS Synth Biol. 2014;3:398–409. doi: 10.1021/sb400140t. [DOI] [PMC free article] [PubMed] [Google Scholar]; c) Albayrak C, Swartz JR. Nucleic Acids Res. 2013;41:5949–5963. doi: 10.1093/nar/gkt226. [DOI] [PMC free article] [PubMed] [Google Scholar]; d) Hayashi Y, Morimoto J, Suga H. ACS Chem Biol. 2012;7:607–613. doi: 10.1021/cb200388k. [DOI] [PubMed] [Google Scholar]
- 5.a) Zimmerman ES, Heibeck TH, Gill A, Li X, Murray CJ, Madlansacay MR, Tran C, Uter NT, Yin G, Rivers PJ, Yam AY, Wang WD, Steiner AR, Bajad SU, Penta K, Yang W, Hallam TJ, Thanos CD, Sato AK. Bioconjugate Chem. 2014;25:351–361. doi: 10.1021/bc400490z. [DOI] [PubMed] [Google Scholar]; b) Axup JY, Bajjuri KM, Ritland M, Hutchins BM, Kim CH, Kazane SA, Halder R, Forsyth JS, Santidrian AF, Stafin K, Lu Y, Tran H, Seller AJ, Biroc SL, Szydlik A, Pinkstaff JK, Tian F, Sinha SC, Felding-Habermann B, Smider VV, Schultz PG. Proc Natl Acad Sci USA. 2012;109:16101–16106. doi: 10.1073/pnas.1211023109. [DOI] [PMC free article] [PubMed] [Google Scholar]
- 6.Albayrak C, Swartz JR. ACS Synth Biol. 2014;3:353–362. doi: 10.1021/sb400116x. [DOI] [PubMed] [Google Scholar]
- 7.Ugwumba IN, Ozawa K, Xu ZQ, Ely F, Foo JL, Herlt AJ, Coppin C, Brown S, Taylor MC, Ollis DL, Mander LN, Schenk G, Dixon NE, Otting G, Oakeshott JG, Jackson CJ. J Am Chem Soc. 2011;133:326–333. doi: 10.1021/ja106416g. [DOI] [PubMed] [Google Scholar]
- 8.a) Li X, Liu CC. ChemBioChem. 2014;15:2335–2341. doi: 10.1002/cbic.201402159. [DOI] [PubMed] [Google Scholar]; b) Liu CC, Schultz PG. Annu Rev Biochem. 2010;79:413–444. doi: 10.1146/annurev.biochem.052308.105824. [DOI] [PubMed] [Google Scholar]; c) Liu DR, Magliery TJ, Pastrnak M, Schultz PG. Proc Natl Acad Sci USA. 1997;94:10092–10097. doi: 10.1073/pnas.94.19.10092. [DOI] [PMC free article] [PubMed] [Google Scholar]
- 9.a) Hoesl MG, Budisa N. Curr Opin Biotechnol. 2012;23:751–757. doi: 10.1016/j.copbio.2011.12.027. [DOI] [PubMed] [Google Scholar]; b) Hughes RA, Ellington AD. Nucleic Acids Res. 2010;38:6813–6830. doi: 10.1093/nar/gkq521. [DOI] [PMC free article] [PubMed] [Google Scholar]; c) Wan W, Huang Y, Wang Z, Russell WK, Pai PJ, Russell DH, Liu WR. Angew Chem Int Ed. 2010;49:3211–3214. doi: 10.1002/anie.201000465. [DOI] [PubMed] [Google Scholar]; Angew Chem. 2010;122:3279–3282. [Google Scholar]; d) Young DD, Young TS, Jahnz M, Ahmad I, Spraggon G, Schultz PG. Biochemistry. 2011;50:1894–1900. doi: 10.1021/bi101929e. [DOI] [PMC free article] [PubMed] [Google Scholar]; e) Bianco A, Townsley FM, Greiss S, Lang K, Chin JW. Nat Chem Biol. 2012;8:748–750. doi: 10.1038/nchembio.1043. [DOI] [PubMed] [Google Scholar]; f) Wang YS, Fang X, Wallace AL, Wu B, Liu WR. J Am Chem Soc. 2012;134:2950–2953. doi: 10.1021/ja211972x. [DOI] [PMC free article] [PubMed] [Google Scholar]; g) Wang F, Niu W, Guo J, Schultz PG. Angew Chem Int Ed. 2012;51:10132–10135. doi: 10.1002/anie.201204668. [DOI] [PubMed] [Google Scholar]; Angew Chem. 2012;124:10279–10282. [Google Scholar]; h) Ko JH, Llopis PM, Heinritz J, Jacobs-Wagner C, Söll D. PLoS ONE. 2013;8:e83630. doi: 10.1371/journal.pone.0083630. [DOI] [PMC free article] [PubMed] [Google Scholar]; i) Lee S, Oh S, Yang A, Kim J, Söll DS, Lee D, Park HS. Angew Chem Int Ed. 2013;52:5771–5775. doi: 10.1002/anie.201300531. [DOI] [PMC free article] [PubMed] [Google Scholar]; Angew Chem. 2013;125:5883–5887. [Google Scholar]; j) Niu W, Schultz PG, Guo J. ACS Chem Biol. 2013;8:1640–1645. doi: 10.1021/cb4001662. [DOI] [PMC free article] [PubMed] [Google Scholar]; k) Bröcker MJ, Ho JML, Church GM, Söll D, O'Donoghue P. Angew Chem Int Ed. 2014;53:319–323. doi: 10.1002/anie.201308584. [DOI] [PMC free article] [PubMed] [Google Scholar]; Angew Chem. 2014;126:325–330. [Google Scholar]; l) Ma Y, Biava H, Contestabie R, Budisa N, di Salvo ML. Molecules. 2014;19:1004–1022. doi: 10.3390/molecules19011004. [DOI] [PMC free article] [PubMed] [Google Scholar]
- 10.Johnson DBF, Xu J, Shen Z, Takimoto JK, Schultz MD, Schmitz RJ, Xiang Z, Ecker JR, Briggs SP, Wang L. Nat Chem Biol. 2011;7:779–786. doi: 10.1038/nchembio.657. [DOI] [PMC free article] [PubMed] [Google Scholar]
- 11.Lajoie MJ, Rovner AJ, Goodman DB, Aerni HR, Haimovich AD, Kuznetsov G, Mercer JA, Wang HH, Carr PA, Mosberg JA, Rohland N, Schultz PG, Jacobson JM, Rinehart J, Church GM, Isaacs FJ. Science. 2013;342:357–360. doi: 10.1126/science.1241459. [DOI] [PMC free article] [PubMed] [Google Scholar]
- 12.a) Johnson DBF, Wang C, Xu J, Schultz MD, Schmitz RJ, Ecker JR, Wang L. ACS Chem Biol. 2012;7:1337–1344. doi: 10.1021/cb300229q. [DOI] [PMC free article] [PubMed] [Google Scholar]; b) Mukai T, Hayashi A, Iraha F, Sato A, Ohtake K, Yokoyama S, Sakamoto K. Nucleic Acids Res. 2010;38:8188–8195. doi: 10.1093/nar/gkq707. [DOI] [PMC free article] [PubMed] [Google Scholar]; c) Heinemann IU, Rovner AJ, Aerni HR, Rogulina S, Cheng L, Olds W, Fischer JT, Söll D, Isaacs FJ, Rinehart J. FEBS Lett. 2012;586:3716–3722. doi: 10.1016/j.febslet.2012.08.031. [DOI] [PMC free article] [PubMed] [Google Scholar]; d) Ohtake K, Sato A, Mukai T, Hino N, Yokoyama S, Sakamoto K. J Bacteriol. 2012;194:2606–2613. doi: 10.1128/JB.00195-12. [DOI] [PMC free article] [PubMed] [Google Scholar]
- 13.a) Sando S, Ogawa A, Nishi T, Hayami M, Aoyama Y. Bioorg Med Chem Lett. 2007;17:1216–1220. doi: 10.1016/j.bmcl.2006.12.013. [DOI] [PubMed] [Google Scholar]; b) Agafonov DE, Huang Y, Grote M, Sprinzl M. FEBS Lett. 2005;579:2156–2160. doi: 10.1016/j.febslet.2005.03.004. [DOI] [PubMed] [Google Scholar]
- 14.Gerrits M, Strey J, Claußnitzer I, Groll Uv, Schäfer F, Rimmele M, Stiege W. In: Cell-Free Protein Expression. Kudlicki W, Katzen F, Bennett R, editors. Landes Bioscience; Austin: 2007. pp. 166–180. [Google Scholar]
- 15.Hong SH, Kwon YC, Jewett MC. Front Chem. 2014;2:34. doi: 10.3389/fchem.2014.00034. [DOI] [PMC free article] [PubMed] [Google Scholar]
- 16.Wang HH, Church GM. Multiplexed Genome Engineering and Genotyping Methods: Applications for Synthetic Biology and Metabolic Engineering. In: Christopher V, editor. Methods in Enzymology. Vol. 498. Academic Press; San Diego: 2011. pp. 409–426. [DOI] [PubMed] [Google Scholar]
- 17.Michel-Reydellet N, Woodrow K, Swartz J. J Mol Microbiol Biotechnol. 2005;9:26–34. doi: 10.1159/000088143. [DOI] [PubMed] [Google Scholar]
- 18.Michel-Reydellet N, Calhoun K, Swartz J. Metab Eng. 2004;6:197–203. doi: 10.1016/j.ymben.2004.01.003. [DOI] [PubMed] [Google Scholar]
- 19.Jiang X, Oohira K, Iwasaki Y, Nakano H, Ichihara S, Yamane T. J Biosci Bioeng. 2002;93:151–156. doi: 10.1263/jbb.93.151. [DOI] [PubMed] [Google Scholar]
- 20.“Genome-wide Functional Genomic Analysis for Physiological Investigation and Improvement of Cell-Free Protein Synthesis”, Airen IO. PhD Thesis. Stanford University; USA: 2011.
- 21.Raines RT. Chem Rev. 1998;98:1045–1066. doi: 10.1021/cr960427h. [DOI] [PubMed] [Google Scholar]
- 22.Kushner SR. J Bacteriol. 2002;184:4658–4665. doi: 10.1128/JB.184.17.4658-4665.2002. [DOI] [PMC free article] [PubMed] [Google Scholar]
- 23.Zhang Y, Zhang J, Hoeflich KP, Ikura M, Qing G, Inouye M. Mol Cell. 2003;12:913–923. doi: 10.1016/s1097-2765(03)00402-7. [DOI] [PubMed] [Google Scholar]
- 24.Prud'homme-Généreux A, Beran RK, Iost I, Ramey CS, Mackie GA, Simons RW. Mol Microbiol. 2004;54:1409–1421. doi: 10.1111/j.1365-2958.2004.04360.x. [DOI] [PubMed] [Google Scholar]
- 25.Bernardi G, Cordonnier C. J Mol Biol. 1965;11:141–143. doi: 10.1016/s0022-2836(65)80180-2. [DOI] [PubMed] [Google Scholar]
- 26.Calhoun KA, Swartz JR. J Biotechnol. 2006;123:193–203. doi: 10.1016/j.jbiotec.2005.11.011. [DOI] [PubMed] [Google Scholar]
- 27.Borja G, Meza Mora E, Barrón B, Gosset G, Ramirez O, Lara A. Microb Cell Fact. 2012;11:132. doi: 10.1186/1475-2859-11-132. [DOI] [PMC free article] [PubMed] [Google Scholar]
- 28.Lehman IR, Roussos GG, Pratt EA. J Biol Chem. 1962;237:829–833. [PubMed] [Google Scholar]
- 29.a) Fritz BR, Jamil OK, Jewett MC. unpublished results 2014 [Google Scholar]; b) Chizzolini F, Forlin M, Cecchi D, Mansy SS. ACS Synth Biol. 2014;3:363–371. doi: 10.1021/sb4000977. [DOI] [PubMed] [Google Scholar]
- 30.Zawada J, Swartz J. Biotechnol Bioeng. 2005;89:407–415. doi: 10.1002/bit.20369. [DOI] [PubMed] [Google Scholar]
- 31.Bundy BC, Swartz JR. Bioconjugate Chem. 2010;21:255–263. doi: 10.1021/bc9002844. [DOI] [PubMed] [Google Scholar]
- 32.Chatterjee A, Sun SB, Furman JL, Xiao H, Schultz PG. Biochemistry. 2013;52:1828–1837. doi: 10.1021/bi4000244. [DOI] [PMC free article] [PubMed] [Google Scholar]
- 33.Voloshin AM, Swartz JR. Biotechnol Bioeng. 2005;91:516–521. doi: 10.1002/bit.20528. [DOI] [PubMed] [Google Scholar]
- 34.a) Kim DM, Choi CY. Biotechnol Prog. 1996;12:645–649. doi: 10.1021/bp960052l. [DOI] [PubMed] [Google Scholar]; b) Liu Y, Fritz BR, Anderson MJ, Schoborg JA, Jewett MC. ACS Synth Biol. 2014 doi: 10.1021/sb5002467. [DOI] [PubMed] [Google Scholar]
- 35.Kigawa T, Yabuki T, Yoshida Y, Tsutsui M, Ito Y, Shibata T, Yokoyama S. FEBS Lett. 1999;442:15–19. doi: 10.1016/s0014-5793(98)01620-2. [DOI] [PubMed] [Google Scholar]
- 36.Ozawa K, Loscha KV, Kuppan KV, Loh CT, Dixon NE, Otting G. Biochem Biophys Res Commun. 2012;418:652–656. doi: 10.1016/j.bbrc.2012.01.069. [DOI] [PubMed] [Google Scholar]
- 37.Wang HH, Isaacs FJ, Carr PA, Sun ZZ, Xu G, Forest CR, Church GM. Nature. 2009;460:894–898. doi: 10.1038/nature08187. [DOI] [PMC free article] [PubMed] [Google Scholar]
- 38.Sambrook J, Russell DW. Molecular Cloning: A Laboratory Manual. 3rd. Cold Spring Harbor Laboratory Press; New York: 2001. [Google Scholar]
- 39.Swartz JR, Jewett MC, Woodrow KA. Recombinant Gene Expression. In: Balbás P, Lorence A, editors. Methods in Molecular Biology. Vol. 267. Humana; Totowa: 2004. pp. 169–182. [DOI] [PubMed] [Google Scholar]
- 40.Goerke AR, Swartz JR. Biotechnol Bioeng. 2009;102:400–416. doi: 10.1002/bit.22070. [DOI] [PubMed] [Google Scholar]
- 41.Jewett MC, Swartz JR. Biotechnol Bioeng. 2004;86:19–26. doi: 10.1002/bit.20026. [DOI] [PubMed] [Google Scholar]
- 42.Gibson DG, Young L, Chuang RY, Venter JC, Hutchison CA, Smith HO. Nat Methods. 2009;6:343–345. doi: 10.1038/nmeth.1318. [DOI] [PubMed] [Google Scholar]
- 43.Kim DM, Swartz JR. Biotechnol Bioeng. 2001;74:309–316. [PubMed] [Google Scholar]
- 44.Chatterjee A, Xiao H, Yang PY, Soundararajan G, Schultz PG. Angew Chem Int Ed. 2013;52:5106–5109. doi: 10.1002/anie.201301094. [DOI] [PubMed] [Google Scholar]; Angew Chem. 2013;125:5210–5213. [Google Scholar]
Associated Data
This section collects any data citations, data availability statements, or supplementary materials included in this article.