

Supplemental digital content is available in the text.
Key words/Abbreviations: allostatic load, self-rated health, walking speed, cross-lagged, older age, CI = confidence interval, ELSA = English Longitudinal Study of Ageing, AIC = Akaike Information Criteria
Abstract
Objective
Allostatic load, a composite measure of accumulated physical wear and tear, has been proposed as an early sign of physiological dysregulation predictive of health problems, functional limitation, and disability. However, much previous research has been cross sectional and few studies consider repeated measures. We investigate the directionality of associations between allostatic load, self-rated health, and a measure of physical function (walking speed).
Methods
The sample included men and women 60 and older who participated in Wave 2 (2004) and Wave 4 (2008) of the English Longitudinal Study of Ageing (n = 6132 in Wave 2). Allostatic load was measured with nine biomarkers using a multisystem summary approach. Self-rated health was measured using a global 5 point summary indicator. Time to walk 8 ft was used as a measure of function. We fitted and tested autoregressive cross-lagged models between the allostatic load measure, self-rated health, and walking speed in Waves 2 and 4. Models were adjusted for age, sex, educational level, and smoking status at Wave 2 and for time-varying indicators of marital status, wealth, physical activity, and social support.
Results
Allostatic load predicted slower walking speed (standardized estimate = −0.08, 95% confidence interval [CI] = −0.10 to −0.05). Better self-rated health predicted faster walking speed (standardized estimate = 0.11, 95% CI = 0.08-0.13) as well as lower allostatic load (standardized estimate = −0.15, 95% CI = −0.22 to −0.09), whereas paths from allostatic load and walking speed to self-rated health were weaker (standardized estimates = −0.05 [95% CI = −0.07 to −0.02] and 0.06 [95% CI = 0.04–0.08]).
Conclusions
Allostatic load can be a useful risk indicator of subsequent poor health or function.
INTRODUCTION
Identifying and understanding pathways to poor health, functional limitation, and disability has been an intensive area of research in gerontology, and several models of disability processes have been advanced (1–3). A common motivation for these models is the wish to identify early sign of disability risks (as well as later transition points). Most models focus on health conditions as the starting point of the process, but identification of precursors of morbidity may be valuable both as a means of elucidating pathways to poor health and for targeting early intervention. One candidate marker of early signs of bodily dysfunction is allostatic load, an indicator of cumulative physiological response to stress based on composite biomarker measures (4). This has been shown to be associated with risk factors, morbidity, and other health outcomes in several studies of older people (5). However, it is unclear from previous research whether the association between allostatic load and health outcomes is unidirectional—from allostatic load to later health—or whether the association is a reciprocal one with some health measures predictive of allostatic load (6,7). In this article, we assess the direction of the relationships between allostatic load, self-rated health, and walking speed—an indicator of function—by fitting cross-lagged models to longitudinal data from a representative sample of the older population of England.
Allostasis refers to the dynamic regulation process whereby an individual organism evaluates and responds to environmental challenges (4). The constant need to adapt to environmental demands may have adverse physiological consequences if frequent and long-term environmental demands lead to a state of chronic stress. Allostatic load has been proposed as a measure of the effects of these cumulative processes and an indicator of accumulated stress (8). This model posits that the pathway to poor health starts with early changes in stress hormones and anti-inflammatory cytokines (primary mediators). The activation of these primary mediators accelerates further changes in metabolic, cardiovascular, and immune systems, which represent secondary outcomes on the pathway from stress reactions to health. Finally, the allostasis-adaptation process may lead to tertiary outcomes: poor health, disease, and, eventually, death. Although these pathways have been proposed in the literature, it has been pointed out that in the allostasis-adaptation process, relationships between the physiological mediators are interconnected and reciprocal (6,9). It is not clear to what extent this also applies to the relationship between allostatic load and health outcomes such as self-rated health, which may be an early predictor of morbidity rather than, or in addition to, an outcome of the disablement process (10).
Several studies have investigated concurrent associations between allostatic load and other health indicators. Hu et al. (11), for example, found in a cross-sectional study of older people in Taiwan that higher allostatic load was associated with poorer self-rated health and several physical activity difficulties, although associations with activities of daily living and instrumental activities of daily living limitations were not significant. In a longitudinal follow-up of the same study population, Goldman and her colleagues (7) studied baseline allostatic load and later health outcomes over a 3-year period. The results suggested that allostatic load could be an early warning sign of later poor health; however, the study highlighted the need for further work using repeated measures. Initial allostatic load level also predicted frailty in a 3-year follow-up study among older people in the US MacArthur Study of Successful Aging (12). Other studies using the same data reported that baseline allostatic load score predicted functional decline (13), cardiovascular disease, and mortality in older people for a 7-year follow-up period (14,15). Those with the highest allostatic load scores experienced the greatest decline in physical and cognitive functioning. In an earlier study, Seeman and her colleagues (14) similarly found that allostatic load was associated with poorer cognitive and physical functioning and predicted cardiovascular disease and decline in cognitive and physical functioning. A study of London-based civil servants also reported that several biomarkers, particularly waist-to-hip ratio, fasting insulin, triglycerides, and high-density lipoprotein cholesterol, were associated with self-rated physical decline over a 3-year interval (16).
The few studies that have investigated changes in allostatic load and its association with health outcomes generally show that increases in allostatic load are associated with higher levels of stress and poorer health outcomes. In the MacArthur Study, a change in allostatic load was studied over a period of 2.5 years. Those older people whose allostatic load scores increased were found to be at higher risk for death, whereas risks were reduced for those whose allostatic load declined (17,18).
Although these studies suggest that allostatic load may be used as an early sign of health risks, most have treated allostatic load as a predictor measured only at baseline and have not tested reciprocal relationships. We use data from two rounds of the English Longitudinal Study of Ageing (ELSA) to analyze the direction of associations between allostatic load, self-rated health, and walking speed. We also compare results from models using these as separate indicators and models using a common factor derived from all three measures. An effective method to detect sequences of effects in longitudinal settings is to apply cross-lagged models. This approach allows the modeling of the autoregressive stability of each measure over time and the estimation of cross-lagged associations between them. This makes it possible to investigate reciprocal predictive relationships and see whether associations are bidirectional or stronger in one direction than another. In addition to associations between health measures including allostatic load, many other factors are known to be associated with allostatic load and with health outcomes. For example, several recent reviews have reported that higher socioeconomic status and health promoting behaviors are associated with lower allostatic load (5,6,19,20). In addition, better social support is associated with lower allostatic load (20,21). Higher socioeconomic status, health promoting behaviors, and social support are also associated with better self-rated health and a lower level of functional limitation (22–25). Accordingly, we investigate and control for these factors in our models.
In sum, allostatic load is hypothesized to predict health status, but previous studies have not assessed the direction of the relationship. Moreover, those previous studies undertaken as part of the MacArthur Successful Aging study were restricted to those in the top third of the distribution in terms of physical and cognitive functioning, and it is possible that associations are different for those with lower levels of health and function. To fill this gap, we investigate the reciprocal association between allostatic load, self-rated health, and functional limitation (slow walking speed). Our main research question is, thus, as follows: Does allostatic load predict self-rated health and functional limitation in older age? We expected that allostatic load would predict functional limitation, but because self-rated health may be an early predictor of health problems, the association between self-rated health and allostatic load may be reciprocal or self-rated health may precede allostatic load. To assess the direction of associations, we use cross-lagged models with two measurement occasions. We also test an alternative model of whether all the health outcomes (allostatic load, poorer self-rated health, and slower walking speed) measure a common underlying factor of poor physical functioning.
METHODS
Sample
We use data from the ELSA, a nationally representative longitudinal study of the older population of England living in private households (26). ELSA includes people 50 years and older, but because one of the measures we use (walking speed) was only collected from those 60 years and older, we excluded participants younger than 60 years. The first wave of ELSA was conducted in 2002 to 2003, and respondents have been reinterviewed biennially. Biomarker and other health measurement data have been collected by nurses in alternate rounds of the study. Because these data are necessary to calculate allostatic load, this study is based on data available for Waves 2 and 4. The analysis sample included 6132 participants in Wave 2 in 2004 to 2005. Numbers with data available for different measures are shown in Table 1. Participants gave their informed consent to take part in the study. Ethical approval was given by the London Multicentre Research Ethics Committee.
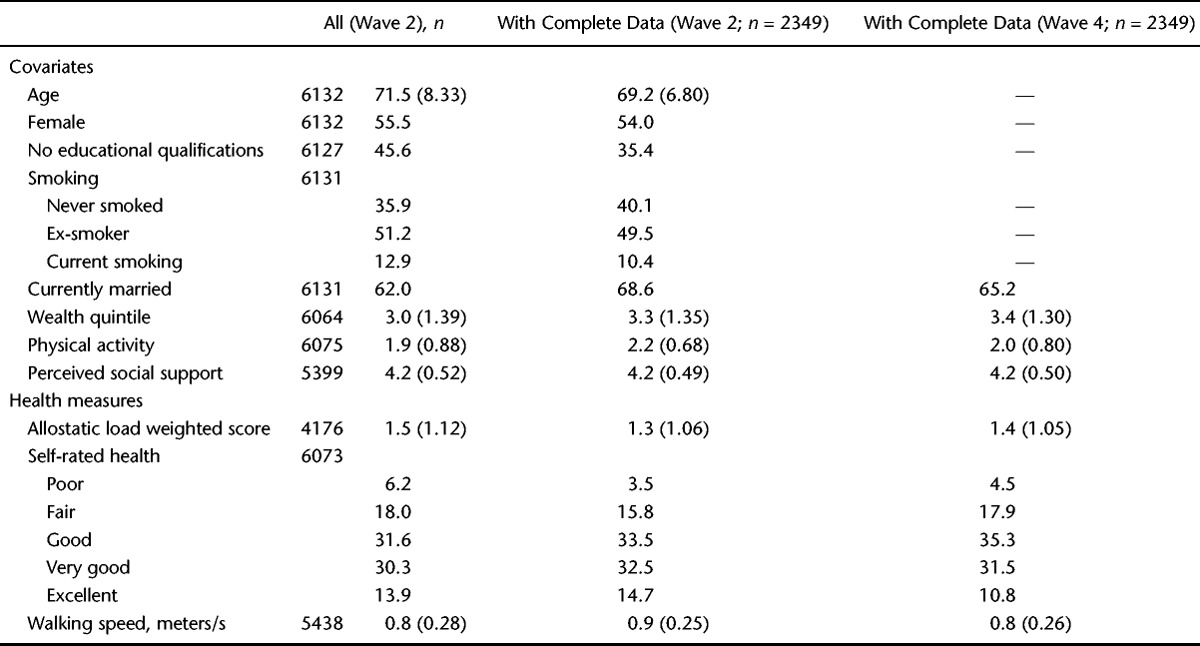
TABLE 1.
Distributions of Variables (% or Mean and Standard Deviation) Among Men and Women in the English Longitudinal Study of Ageing
Measures
Allostatic load was measured using nine biomarkers obtained during the nurse visits in Waves 2 and 4 (27; for more details, see Supplemental Digital Content 1, http://links.lww.com/PSYMED/A151). Five biomarkers were derived from blood samples: high-density lipoprotein/total cholesterol ratio (in milligrams per deciliter; index of risk for cardiovascular disease), triglycerides (in milligrams per deciliter; index of lipid metabolism), glycosylated hemoglobin (in percent; index of glucose metabolism over the previous 30–90 days), fibrinogen (in milligrams per deciliter; index of inflammation and cardiovascular disease), and C-reactive protein (in milligrams per deciliter; index of inflammation and cardiovascular disease).
Four biomarkers were obtained from anthropometric and physical measures: waist-to-hip ratio, systolic and diastolic blood pressure, and lung function (peak expiratory flow rate). Waist and hip circumferences were measured twice to the nearest even millimeter, and the mean of the two valid measures was used. Blood pressure (in millimeters of mercury) was measured using three readings collected at 1-minute intervals. The mean of valid readings was used. Lung function was measured using peak expiratory flow rate, the fastest rate of exhalation (in liters per minute). Three measurements were taken, and the highest satisfactory score was used as the valid one. All of these nine indicators have been previously used for measuring allostatic load among older participants (11–13,28–30).
For all nine measures, individuals belonging to the highest 25 percentile indicating health risk were identified using the sample distributions for men and women (Supplemental Digital Content 1, Table S1, http://links.lww.com/PSYMED/A151). This method of identifying risk quartiles has frequently been used in creating composite allostatic load scores (6,14). The proportion of biomarkers for which the measure placed individuals in the risk group was calculated for each of five subsystems (inflammation, cardiovascular, metabolic, body fat, and respiratory). This was done to weight the score taking account of the number of biomarkers in the five subsystems. The weighted sum score ranged from 0 to 5. Information on at least four of five subsystems had to be available to calculate the score.
Self-rated health was a global evaluation of current health measured on a 5-point scale, ranging from poor to excellent. Walking speed was used as an objective measure of functional status because it has been shown to be a good indicator of overall physical performance (31–34). Walking speed was measured during the main interview (for a more detailed description, see Refs. (35,36)). Respondents were asked to walk a distance of 8 ft (2.44 meters) at their usual walking pace. Timed from standing position, two attempts were recorded and a mean speed (in meters per second) of the two walks was used. Walking aids were permitted and used by 4% of respondents.
Covariates
Age, sex, and education were measured in Wave 2 and treated as time invariant variables. Age (single years) was treated as a continuous measure. Sex and education were both treated as binary variables distinguishing, respectively, men and women (with women as the reference category) and those with and without formal educational qualifications. The measure of educational qualifications distinguished those with qualifications gained in secondary school or in further or higher educational establishments from those lacking any such qualification. In England, school-based qualifications are gained through public examinations generally taken at around ages 16 and 18 years. In the cohorts considered here, many people left secondary school without taking these examinations so a large proportion of the sample have no formal qualifications, hence our decision to dichotomize this variable.
Smoking status was treated as a time-invariant variable measured at Wave 2 because there was very little change in smoking status over subsequent waves. This approach allowed us to create an ordered categorical variable distinguishing three groups: current smokers, former smokers, and never-smokers. Marital status, wealth quintile, physical activity, and social support were measured in both waves to allow time-varying effects as well as cross-time effects (Wave 2 covariates to Wave 4 health outcomes) to be estimated in the models. Marital status was dichotomized (married versus not married) because of small numbers in some nonmarried subgroups. Wealth quintiles were calculated using non–pension wealth indicating financial, physical, and housing wealth net of debt. This measure provides a better estimate of economic status in older people than measures of income (37). Wealth quintile was treated as continuous in the analysis. Self-reported physical activity was used to create four categories: sedentary (no physical activity and, if working, in a sedentary job), low (mild physical activity at least once a week or, if working, in a job that was mostly standing), moderate (moderate physical activity at least once a week or, if working, in a job that involved physical work), and high (vigorous physical activity at least once a week or, if working, in a job that involved heavy manual labour) (27). Because the distribution of physical activity was approximately normal and the association with outcomes linear, it was treated as continuous in the analysis. A mean score of perceived social support from partner, children, relatives, and friends was calculated based on responses to three questions about relationships with each of these groups (38). These were the following: “How much do they really understand the way you feel about things?” “How much can you rely on them if you have a serious problem?” and “How much can you open up to them if you need to talk about your worries?” Each item was assessed on a 4-point scale (1, not at all; 2, a little; 3, some; 4, a lot). The mean was calculated using the items that were available. People reporting having no partner, children, relatives, or friends (n = 8) were given a missing value. The internal consistency of the scale was very good (Cronbach α = .88 in Wave 2 and .91 in Wave 4). The mean score was approximately normal in distribution and was treated as continuous in the analysis.
Analysis
Analyses were carried out using Mplus version 7.11 (39). Autoregressive cross-lagged path models were fitted to examine associations between allostatic load and health (see the Mplus script for the model in Supplemental Digital Content 2, http://links.lww.com/PSYMED/A152). Models were adjusted for age, sex, education, and smoking status at Wave 2 and for the time-varying covariates of marital status, physical activity, and social support. Allostatic load was adjusted for fasting and medication use (for details, see the Supplemental Digital Content 1, http://links.lww.com/PSYMED/A151). Self-rated health was treated as an ordinal categorical variable. Walking speed was approximately normally distributed and was treated as continuous in the model. Allostatic load was also a continuous measure, but its distribution was very skewed (high proportion scoring 0). For this reason, the measure was treated as censored in the analysis, and a tobit regression method was used (40). To make the comparison of the estimates easier in the model, allostatic load score and walking speed were rescaled so that the range for all health measures varied between 1 and 5.
To test further whether all health outcomes (allostatic load, self-rated health, and walking speed) measure the same underlying latent factor of physical functioning, a common-factor model was fitted. In this model, each health outcome was modeled as a single latent factor and the covariance between the factors at each time point was set to 1. The common-factor model was compared with the model in which allostatic load, self-rated health, and walking speed were treated as separate variables (Fig. 1). Because these models were not nested, the comparison was assessed using Akaike Information Criteria (AIC) (41). A smaller AIC value indicates a better fit to the data.
Figure 1.
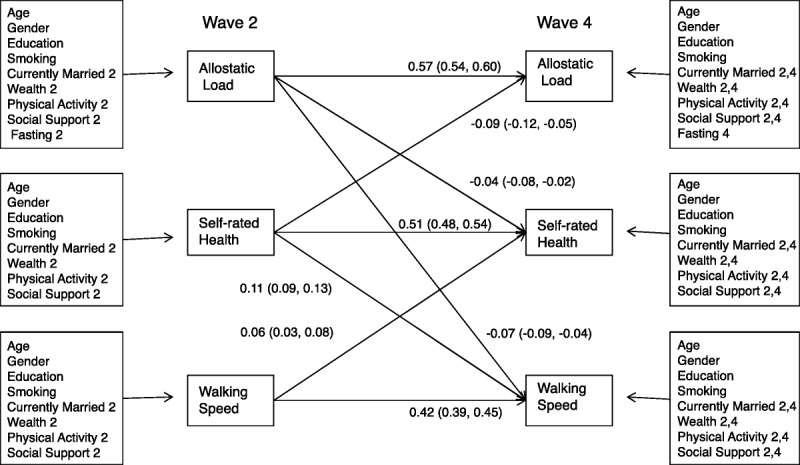
Cross-lagged model for self-rated health, allostatic load and walking speed. Significant standardized path estimates and 95% confidence intervals in parenthesis are shown. For the covariates, the waves are indicated (2 = Wave 2, 4 = Wave 4).
Maximum likelihood estimation with robust standard errors was used to take into account any nonnormality in the sample. The analysis was carried out using full information maximum likelihood, so that all respondents were included regardless of whether they participated in the latter wave or responded to all items. This approach uses the information on mean and variance of the missing proportion of the variables to incorporate in a statistically appropriate way the information for those participants with incomplete data (42). Using full information maximum likelihood is a less biased and more efficient way of dealing with missing data than, for example, listwise or pairwise deletion or similar response pattern imputation (43). The equality of the simultaneous paths was tested using the Wald test. The Wald test follows the χ2 test distribution, with degrees of freedom defined as the number of parameters in the comparison. A significant p value in Wald test indicates that the initial model fits better than the altered model.
RESULTS
Descriptive Results
Table 1 shows the distribution of all Wave 2 respondents, Wave 2 respondents with complete data, and Wave 4 respondents with complete data by variables used in the analysis. Those who did not provide complete information were older, were more likely to have no educational qualifications, and were more likely to belong to a lower wealth quintile. They were also less likely to be married and more likely to smoke and report poorer health. By the end of the 4-year follow-up, people were more likely to have moved to a higher wealth quintile, but were less likely to be married or be physically active, and had poorer health, compared with the Wave 2 baseline.
Cross-Lagged Model
Figure 1 shows results from the application of the cross-lagged model used to identify reciprocal associations between allostatic load, self-rated health, and walking speed. Only statistically significant associations are shown. The estimates indicate that allostatic load predicted walking speed, but the path from walking speed to allostatic load was not significant. To test whether the path from allostatic load to walking speed was stronger than from walking speed to allostatic load, the paths were constrained to be equal and tested using the Wald test. This showed that these two paths could not be set as equal (Wald test: 16.95 [df = 1], p < .001).
The associations between self-rated health and allostatic load, and self-rated health and walking speed were reciprocal. To test whether the strengths of the associations were similar in both ways, the paths were constrained to be equal. The Wald test indicated that the paths between self-rated health and allostatic load, and between self-rated health and walking speed could not be set as equal (Wald tests: 6.25 [df = 1; p < .05] and 5.66 (df = 1; p < .05], respectively). The paths were stronger from self-rated health to allostatic load and walking speed than the other way round.
An alternative common-factor model was tested to assess whether all health outcomes (allostatic load, self-rated health, and walking speed) represented a common factor of physical functioning. The comparison of the AIC values of the common-factor model (AIC = 163,338) and the previously tested separate variable model (AIC = 162,597; Fig. 1) showed that keeping allostatic load, self-rated health, and walking speed as separate measures of health fitted the data better.
To assess whether the different sample size available for direct calculation of measures affected the results, the models were repeated for only those who provided allostatic load measures (n = 4176) or complete data (n = 2349). The estimates from these models were very similar to those presented from the full information model (Fig. 1). The largest of the differences in the magnitude of the estimate was 0.02, and none changed the interpretation of the model.
Older age, lack of an educational qualification, smoking, lower wealth quintile, current smoking, and lower physical activity in Wave 2 and fasting in both waves were associated with higher allostatic load (Supplemental Digital Content 3, Table S2, http://links.lww.com/PSYMED/A153). Older age, lack of an educational qualification, smoking, lower physical activity, and a lower level of perceived social support were associated with poorer self-rated health in both waves. Lower wealth quintile and not being married were associated with poorer self-rated health in Wave 2. Older age, being female, having no educational qualification, and lower physical activity in both waves, and lower wealth quintile and not being married in Wave 2 were associated with slower walking speed. Except for the association between Wave 2 perceived social support and Wave 4 allostatic load and walking speed, there were no other cross-wave associations from Wave 2 covariates to Wave 4 health measures.
DISCUSSION
The results showed associations between allostatic load, self-rated health, and functional limitation in line with previous findings (7,11–16) and further suggested that allostatic load predicts functional limitation. Self-rated health predicted both walking speed and allostatic load, although there were also associations (but weaker) other way round. The results are consistent with allostatic load theory, which conceptualizes allostatic load as a chronic stress–induced cumulative biological burden predictive of health outcomes (4). Allostatic load may represent an early warning sign of the disruption of normal processes and activation of efforts to regain the normal state. From this perspective, allostatic load may be seen to parallel active pathology, the first step in the disablement process (1). The results from the comparison of the cross-lagged model with three separate health measures and the common-factor model further supported the idea of the disablement process. The relationships between allostatic load, self-rated health, and walking speed are better presented as an over-time causal chain (as in the disablement process model) than as a common measure of simultaneous poor functioning.
The role of self-rated health in the disablement process was more complex. Although the paths between self-rated health and walking speed, and self-rated health and allostatic load were significant both ways, the paths from self-rated health to later allostatic load and walking speed were stronger than the other way round. This suggests that self-rated health may be an even earlier indicator of health problems than allostatic load. This finding is consistent with previous reports that self-rated health predicts other health outcomes (10,44,45). Further research is needed to assess the usefulness of self-rated health as an early indicator in the disablement process.
There are several limitations to this study, including the fact that we only had data for two repeated-measurement occasions and so could only investigate one time lag of 4 years. Two measurement occasions are sufficient to test reciprocal and unidirectional causal relations between two factors, but multiple waves would make it possible to boost the reliability and test longer temporal sequences (mediation) between several factors in disability processes. If three waves had been available, we could, for example, have determined whether older people’s subjective evaluation of their health as poor preceded physiological dysregulation, which, in turn, preceded disability. Multiple waves would also be useful to assess the temporal pathways between primary and secondary mediators in physiological dysregulation and, in turn, their effect on health outcomes. To date, there are very few longitudinal studies of aging (ELSA, Taiwan Social Environment and Biomarkers of Aging Study) that have collected repeated measures of allostatic load. When the future waves of data become available in the source we use here, it will be possible to extend the work in this way.
These results indicate a need to consider the role and relative value of different measures indicative of cumulative stress and of health and function. Of the three measures used in this study, walking speed may seem the least problematic in that it is an objective measure of functional limitations proximal to disability (31,32). However, although walking speed is a simple field test, it is subject to missingness due to poor health and refusal. More importantly, walking speed is an indicator of functional limitation and so of little value as an early-stage indicator of later problems, and it is such early-stage markers that have potentially the most value as indicators of potential intervention points. Self-rated health, although a convenient and widely used measure of general health status, is a subjective measure and known to be influenced by psychological state and to vary between populations and population sub groups (46). Measures such as allostatic load, which are not influenced by reporting bias, may be preferable in comparative studies. However, compared with self-rated health and walking speed, the allostatic load index is a complex composite. Associations with health tend to be stronger when using a summary score of several biomarkers compared with a single biomarker (13). Generally, allostatic load is defined as multisystem dysfunctioning (6). Hence, allostatic load should capture functioning over the systems and not represent only one. In this study, weighting of biomarkers within systems was used to avoid overrepresentation of the metabolic system. There is no standardized way of measuring allostatic load (6,20). The construction of allostatic load score varies from one study to another, making it difficult to compare findings. The cutoffs for risk quartiles have often been calculated from each specific study population. Although standard cutoffs are available for some of the biomarkers, they have been derived from younger populations and may not be applicable for older participants (47). Given these problems with measures, the use of structural equation modeling is useful because measurement errors can be dealt with using latent structures (39).
In interpreting the results, it is important to note that the allostatic load score in this study was constructed using secondary outcomes of stress mediation. Consequently, allostatic load as presently defined may be closer to health outcomes in the temporal pathway and less likely to detect early stress-related physiological changes, for instance, in cortisol, epinephrine, and norepinephrine (28). Previous studies indicate that primary stress mediators and secondary stress outcomes are equally effective in predicting physical health outcomes (13,15).
Despite these limitations, this study adds to our knowledge about the role and use of allostatic load in studies of the disablement process by using two repeated measures to assess directions of association and their strength. Unlike some studies of allostatic load, particularly the MacArthur studies, which relate only to the highest performing section of the older population, we used data drawn from a nationally representative sample. Our results in summary indicate that allostatic load can be a useful early predictor of later problems in functioning. Considering that allostatic load comprises an array of subclinical symptoms means that it is important to identify those who may be at risk for using the subclinical values in several subsystems at the same time. However, more understanding of interactions between the subsystems and treatment methods is needed. Especially in old age, the usefulness of general population cutoff values and the definition of “normal” values become harder to determine. Further research on allostatic load, including work on deriving standard composite scores for different age groups, is needed to maximize the potential of this measure as an indicator of opportunities to intervene to prevent adverse trajectories to poor health and disablement.
Supplementary Material
Acknowledgments
Source of Funding and Conflicts of Interest: This work was supported by an award from the UK Economic and Social Research Council (Grant No. 1025561/2; to Emily Grundy). The authors declare no conflicts of interest.
Footnotes
Supplemental digital content is available for this article. Direct URL citations appear in the printed text and are provided in the HTML and PDF versions of this article on the journal’s Web site (www.psychosomaticmedicine.org).
REFERENCES
- 1. Verbrugge LM, Jette AM. The disablement process. Soc Sci Med 1994; 38: 1– 14. [DOI] [PubMed] [Google Scholar]
- 2. Nagi SZ. A study in the evaluation of disability and rehabilitation potential: concepts, methods, and procedures. Am J Public Health Nations Health 1964; 54: 1568– 79. [DOI] [PMC free article] [PubMed] [Google Scholar]
- 3.WHO. International Classification of Functioning, Disability, And Health: ICF. Geneva, Switzerland: World Health Organization; 2001. [Google Scholar]
- 4. McEwen BS, Stellar E. Stress and the individual—mechanisms leading to disease. Arch Intern Med 1993; 153: 2093– 101. [PubMed] [Google Scholar]
- 5. Leahy R, Crews DE. Physiological dysregulation and somatic decline among elders: modeling, applying and re-interpreting allostatic load. Coll Antropol 2012; 36: 11– 22. [PubMed] [Google Scholar]
- 6. Juster RP, McEwen BS, Lupien SJ. Allostatic load biomarkers of chronic stress and impact on health and cognition. Neurosci Biobehav Rev 2010; 35: 2– 16. [DOI] [PubMed] [Google Scholar]
- 7. Goldman N, Turra CM, Glei DA, Lin YH, Weinstein M. Physiological dysregulation and changes in health in an older population. Exp Gerontol 2006; 41: 862– 70. [DOI] [PubMed] [Google Scholar]
- 8. McEwen BS. Interacting mediators of allostasis and allostatic load: towards an understanding of resilience in aging. Metabolism 2003; 52: 10– 6. [DOI] [PubMed] [Google Scholar]
- 9. McEwen BS, Gianaros PJ. Stress- and allostasis-induced brain plasticity. Ann Rev Med 2011; 62: 431– 45. [DOI] [PMC free article] [PubMed] [Google Scholar]
- 10. Pietilainen O, Laaksonen M, Rahkonen O, Lahelma E. Self-rated health as a predictor of disability retirement—the contribution of ill-health and working conditions. PLoS One 2011; 6: e25004. [DOI] [PMC free article] [PubMed] [Google Scholar]
- 11. Hu P, Wagle N, Goldman N, Weinstein M, Seeman TE. The associations between socioeconomic status, allostatic load and measures of health in older Taiwanese persons: Taiwan Social Environment and Biomarkers of Aging Study. J Biosoc Sci 2007; 39: 545– 56. [DOI] [PubMed] [Google Scholar]
- 12. Gruenewald TL, Seeman TE, Karlamangla AS, Sarkisian CA. Allostatic load and frailty in older adults. J Am Geriatr Soc 2009; 57: 1525– 31. [DOI] [PMC free article] [PubMed] [Google Scholar]
- 13. Karlamangla AS, Singer BH, McEwen BS, Rowe JW, Seeman TE. Allostatic load as a predictor of functional decline MacArthur studies of successful aging. J Clin Epidemiol 2002; 55: 696– 710. [DOI] [PubMed] [Google Scholar]
- 14. Seeman TE, Singer BH, Rowe JW, Horwitz RI, McEwen BS. Price of adaptation—allostatic load and its health consequences—MacArthur studies of successful aging. Arch Intern Med 1997; 157: 2259– 68. [PubMed] [Google Scholar]
- 15. Seeman TE, McEwen BS, Rowe JW, Singer BH. Allostatic load as a marker of cumulative biological risk: MacArthur studies of successful aging. Proc Natl Acad Sci U S A 2001; 98: 4770– 5. [DOI] [PMC free article] [PubMed] [Google Scholar]
- 16. Kumari M, Seeman T, Marmot M. Biological predictors of change in functioning in the Whitehall II study. Ann Epidemiol 2004; 14: 250– 7. [DOI] [PubMed] [Google Scholar]
- 17. Karlamangla AS, Singer BH, Seeman TE. Reduction in allostatic load in older adults is associated with lower all-cause mortality risk: MacArthur studies of successful aging. Psychosom Med 2006; 68: 500– 7. [DOI] [PubMed] [Google Scholar]
- 18. Juster RP, Marin MF, Sindi S, Nair NPV, Ng YN, Pruessner JC, Lupien SJ. Allostatic load associations to acute, 3-year and 6-year prospective depressive symptoms in healthy older adults. Physiol Behav 2011; 104: 360– 4. [DOI] [PubMed] [Google Scholar]
- 19. Seeman T, Epel E, Gruenewald T, Karlamangla A, McEwen BS. Socio-economic differentials in peripheral biology: cumulative allostatic load. Biology of disadvantage: socioeconomic status and health. Ann N Y Acad Sci 2010; 1186: 223– 39. [DOI] [PubMed] [Google Scholar]
- 20. Beckie TM. A systematic review of allostatic load, health, and health disparities. Biol Res Nurs 2012; 14: 311– 46. [DOI] [PubMed] [Google Scholar]
- 21. Seeman TE, Singer BH, Ryff CD, Dienberg Love G, Levy-Storms L. Social relationships, gender, and allostatic load across two age cohorts. Psychosom Med 2002; 64: 395– 406. [DOI] [PubMed] [Google Scholar]
- 22. Vuillemin A. Benefits of physical activity on health among elderly. Sci Sports 2012; 27: 249– 53. [Google Scholar]
- 23. Kondo N. Socioeconomic disparities and health: impacts and pathways. J Epidemiol 2012; 22: 2– 6. [DOI] [PMC free article] [PubMed] [Google Scholar]
- 24. Heller T, Factor A. Family support and intergenerational caregiving: report from the State of the Science in Aging with Developmental Disabilities Conference. Disabil Health J 2008; 1: 131– 5. [DOI] [PubMed] [Google Scholar]
- 25. Wilkinson RG, Pickett KE. Income inequality and population health: a review and explanation of the evidence. Soc Sci Med 2006; 62: 1768– 84. [DOI] [PubMed] [Google Scholar]
- 26. Steptoe A, Breeze E, Banks J, Nazroo J. Cohort profile: The English Longitudinal Study of Ageing. Int J Epidemiol 2012. doi: 10.1093/ije/dys168. [DOI] [PMC free article] [PubMed] [Google Scholar]
- 27. de Oliveira C, Shankar A, Kumari M, Nunn S, Steptoe A. Health risk and health protective biological measures in later life. In: Banks J, Lessof C, Nazroo J, Rogers N, Stafford M, Steptoe A, editors. Financial Circumstances, Health and Well-Being of the Older Population in England: The 2008 English Longitudinal Study of Ageing. London: The Institute of Fiscal Studies; 2010: 275– 347. [Google Scholar]
- 28. Clark MS, Bond MJ, Hecker JR. Environmental stress, psychological stress and allostatic load. Psychol Health Med 2007; 12: 18– 30. [DOI] [PubMed] [Google Scholar]
- 29. Crimmins EM, Johnston M, Hayward M, Seeman T. Age differences in allostatic load: an index of frailty. In: Yi Z, Crimmins EM, Carrière Y, Robine J-M, editors. Longer Life and Healthly Aging International Studies in Population. 2. The Netherlands: Springer; 2006: 111– 26. [Google Scholar]
- 30. Yang Y, Kozloski M. Sex differences in age trajectories of physiological dysregulation: inflammation, metabolic syndrome, and allostatic load. J Gerontol A Biol Sci Med Sci 2011; 66: 493– 500. [DOI] [PMC free article] [PubMed] [Google Scholar]
- 31. Guralnik JM, Ferrucci L, Pieper CF, Leveille SG, Markides KS, Ostir GV, Studenski S, Berkman LF, Wallace RB. Lower extremity function and subsequent disability: consistency across studies, predictive models, and value of gait speed alone compared with the short physical performance battery. J Gerontol A Biol Sci Med Sci 2000; 55: M221– 31. [DOI] [PMC free article] [PubMed] [Google Scholar]
- 32. Studenski S, Perera S, Wallace D, Chandler JM, Duncan PW, Rooney E, Fox M, Guralnik JM. Physical performance measures in the clinical setting. J Am Geriatr Soc 2003; 51: 314– 22. [DOI] [PubMed] [Google Scholar]
- 33. Cesari M, Kritchevsky SB, Newman AB, Simonsick EM, Harris TB, Penninx BW, Brach JS, Tylavsky FA, Satterfield S, Bauer DC, Rubin SM, Visser M, Pahor M. Health, Aging and Body Composition Study. Added value of physical performance measures in predicting adverse health-related events: results from the Health, Aging and Body Composition Study. J Am Geriatr Soc 2009; 57: 251– 9. [DOI] [PMC free article] [PubMed] [Google Scholar]
- 34. Viccaro LJ, Perera S, Studenski SA. Is Timed Up and Go better than gait speed in predicting health, function, and falls in older adults? J Am Geriatr Soc 2011; 59: 887– 92. [DOI] [PMC free article] [PubMed] [Google Scholar]
- 35. Melzer D, Gardener E, Lang I, McWilliams B, Guralnik JM. Measured physical performance. In: Banks J, Breeze E, Lessof C, Nazroo J, editors. Retirement, Health and Relationships of the Older Population in England: The 2004 English Longitudinal Study of Ageing (Wave 2). London: Institute for Fiscal Studies; 2006: 165– 78. [Google Scholar]
- 36. Zaninotto P, Sacker A, Head J. Relationship between wealth and age trajectories of walking speed among older adults: evidence from the English Longitudinal Study of Ageing. J Gerontol A Biol Sci Med Sci 2013; 68: 1525– 31. [DOI] [PMC free article] [PubMed] [Google Scholar]
- 37. Banks J, Breeze E, Lessof C, Nazroo J. Living in the 21st Century: Older People in England: The 2006 English Longitudinal Study of Ageing. London: The Institute of Fiscal Studies; 2008. [Google Scholar]
- 38. Kamiya Y, Whelan B, Timonen V, Kenny RA. The differential impact of subjective and objective aspects of social engagement on cardiovascular risk factors. BMC Geriatr 2010; 10: 81. [DOI] [PMC free article] [PubMed] [Google Scholar]
- 39. Muthén LK, Muthén BO. Mplus User’s Guide. Muthén & Muthén: Los Angeles, CA; 1998–2012. [Google Scholar]
- 40. Tobin J. Estimation of relationships for limited dependent variables. Econometrica 1958; 26: 24– 36. [Google Scholar]
- 41. Akaike H. Factor-analysis and AIC. Psychometrika 1987; 52: 317– 32. [Google Scholar]
- 42. Little RJA, Rubin DB. Statistical Analysis with Missing Data. 2nd ed New York: John Wiley; 2002. [Google Scholar]
- 43. Enders CK, Bandalos DL. The relative performance of full information maximum likelihood estimation for missing data in structural equation models. Struct Equation Model 2001; 8: 430– 57. [PubMed] [Google Scholar]
- 44. Idler EL, Russell LB, Davis D. Survival, functional limitations, and self-rated health in the NHANES I epidemiologic follow-up study, 1992. Am J Epidemiol 2000; 152: 874– 83. [DOI] [PubMed] [Google Scholar]
- 45. Lee Y. The predictive value of self assessed general, physical, and mental health on functional decline and mortality in older adults. J Epidemiol Community Health 2000; 54: 123– 9. [DOI] [PMC free article] [PubMed] [Google Scholar]
- 46. Ploubidis GB, Grundy E. Later-life mental health in Europe: a country-level comparison. J Gerontol B Psychol Sci Soc Sci 2009; 64: 666– 76. [DOI] [PubMed] [Google Scholar]
- 47. Nilsson SE, Takkinen S, Tryding N, Evrin PE, Berg S, McClearn G, Johansson B. Association of biochemical values with morbidity in the elderly: a population-based Swedish study of persons aged 82 or more years. Scand J Clin Lab Invest 2003; 63: 457– 66. [DOI] [PubMed] [Google Scholar]
Associated Data
This section collects any data citations, data availability statements, or supplementary materials included in this article.