

Abstract
Objectives
To assess the relationship between extracellular volume (ECV), native T1, and systolic strain in hypertensive patients with left ventricular hypertrophy (HTN LVH), hypertensive patients without LVH (HTN Non-LVH) and normotensive controls.
Background
Diffuse myocardial fibrosis in HTN LVH patients, as reflected by increased ECV and native T1, may be an underlying mechanism contributing to increased cardiovascular risk when compared to HTN Non-LVH subjects and controls. Furthermore increased diffuse fibrosis in HTN LVH subjects may be associated with reduced peak systolic and early diastolic strain rate when compared to the other two groups.
Methods
T1 mapping was performed in 20 HTN LVH (55±11 years), 23 HTN Non-LVH (61±12) and 22 control (54±7) subjects on a Siemens 1.5T Avanto using a previously validated MOLLI pulse sequence. T1 was measured pre-contrast and 10, 15 and 20 minutes following injection of 0.15 mmol/kg Gd-DTPA, and the mean ECV and native T1 were determined for each subject. Measurement of circumferential strain parameters were performed using cine displacement encoding with stimulated echoes (DENSE).
Results
HTN LVH subjects had higher native T1 when compared to controls (p < 0.05). HTN LVH subjects had higher ECV when compared to HTN Non-LVH subjects and controls (p < 0.05). Peak systolic circumferential strain and early diastolic strain rate were reduced in HTN LVH subjects when compared to HTN Non-LVH subjects and controls (p < 0.05). Increased levels of ECV and Native T1 were associated with reduced peak systolic and early diastolic circumferential strain rate across all subjects.
Conclusions
HTN LVH patients had higher ECV, longer native T1 and associated reduction in peak systolic circumferential strain and early diastolic strain rate when compared to HTN Non-LVH and control subjects. Measurement of ECV and native T1 provide a non-invasive assessment of diffuse fibrosis in hypertensive heart disease.
Keywords: Hypertension, hypertensive heart disease, left ventricular hypertrophy, cardiac magnetic resonance, myocardial fibrosis, T1 mapping, Extracellular Volume
Introduction
Hypertension (HTN) is a common cause of morbidity and mortality in the US affecting 1 in 3 adults (1). Patients with longstanding or poorly controlled HTN are at increased risk for developing left ventricular hypertrophy (LVH) and diastolic dysfunction (2). LVH is an independent risk factor for cardiovascular morbidity and mortality in hypertensive patients (3, 4). Diffuse fibrosis has been detected in subjects with HTN with LVH in both biopsy (5) and autopsy studies (6), and has been linked to the development of LVH and diastolic dysfunction (7). Concentric LVH portends higher cardiovascular morbidity and mortality when compared to other hypertrophy subtypes (8). The presence of diffuse fibrosis may confer increased cardiovascular risk in HTN LVH patients.
Diffuse myocardial fibrosis in hypertensive LVH is not detected by conventional late gadolinium enhanced (LGE) cardiac magnetic resonance (CMR). T1 mapping is a novel CMR approach that is able to detect diffuse fibrosis in diseases such as aortic stenosis and hypertrophic cardiomyopathy as validated against myocardial biopsy (9). By measuring the T1 relaxation times of the blood and myocardium both pre- and post-contrast, one can determine the partition coefficient (λ) of gadolinium and subsequently the extracellular volume (ECV).
We hypothesized that HTN LVH patients would demonstrate diffuse myocardial fibrosis as measured by T1 mapping and ECV as compared to HTN Non-LVH and normotensive controls. We also postulated that subjects with HTN LVH would have greater fibrosis and reduced systolic strain, and early diastolic strain-rate when compared to the other two groups.
Methods
Twenty subjects with HTN LVH (55 ± 11 years), 23 subjects with HTN Non-LVH (61 ± 12 years) and 22 normotensive controls (54 ± 7 years) were enrolled between 11/10 and 10/13 under an institutional review board approved protocol. All subjects signed informed consent. Patients with a history of HTN and evidence of LVH by any imaging modality were considered for this study. Patients with any other causes of LVH, known coronary disease, significant valvular disease, renal impairment with GFR<45 ml/min/1.73m2 or reduced systolic function (ejection fraction <45%) were excluded. Subjects with a history of HTN with systolic blood pressure >140 mmHg or diastolic blood pressure > 90 mmHg on at least two office readings (10), or taking one or more medications for hypertension, were included. Subjects were then classified as having LVH if their LVMI (LV mass indexed by body surface area) as measured by cardiac MRI was > 81 g/m2 for men or > 61 g/m2 in women as defined by Olivotto et al. (11). Hypertensive subjects not meeting criteria for LVH as defined above were included in the HTN Non-LVH group. Healthy volunteers who were normotensive and did not have a history of HTN were enrolled in the control arm.
CMR protocol
CMR was performed on a 1.5T MR scanner (Siemens Avanto, Erlangen, Germany).
Cine Imaging
LV mass and function were assessed by SSFP cine imaging using the following sequence parameters: repetition time (TR) 2.7 ms, echo time (TE) 1.3 ms, flip angle 70°, field of view (FOV) 300–350 mm, and in-plane resolution 1.8 × 1.4 mm, TR 40–50ms, slice thickness 8 mm. Images were obtained in short axis and standard long axis orientations. Analyses were performed (R.J, S.K) using Argus software (Siemens Healthcare, Princeton, New Jersey, USA) on a Leonardo workstation (Siemens Healthcare, Erlangen, Germany). End-diastolic and end-systolic endocardial and epicardial cavity areas were planimetered for each short-axis slice. The LV mass, end-diastolic volume and end-systolic volumes were determined and indexed to body surface area. LV mass was measured from the end-diastolic image frames using the validated Q-Mass (Medis 7.5 version) program (12). Papillary muscles were included when measuring LV mass as per recent SCMR guidelines (13).
T1 Mapping
T1 mapping was performed using a reduced breath-hold variant of the Modified Look-Locker Inversion Recovery (MOLLI) technique (14), which was previously validated by our group (15). This protocol yields 8 T1 weighted source images over 11 heartbeats. The starting TI (to the first image readout) was chosen to be 100 ms, with an increment of 80 ms for the subsequent look-locker experiments. The pulse sequence parameters included: TE 1.1 ms, TR 2.5 ms, flip angle 35°, FOV 340 × 260 mm, resolution 1.8 mm × 1.8mm and slice thickness of 8 mm.
T1 maps (Figure 1) were obtained in basal and mid-ventricular short axis slices pre-contrast and at 10, 15, and 20 minutes after a bolus IV injection of 0.15 mmol/kg Gd-DTPA. Hematocrit (Hct) was measured in all subjects.
Figure 1. Example of a T1 map.
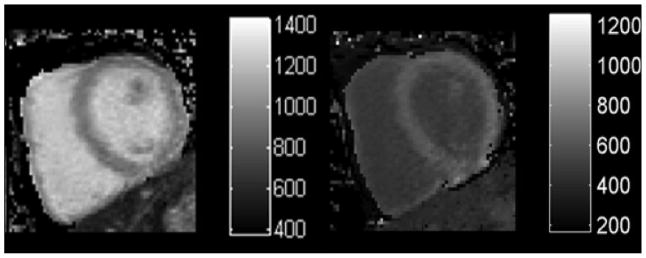
T1 maps pre-contrast (left) and post-contrast (right). T1 maps are generated from a collection of T1 images obtained at different inversion times during the same phase of the cardiac cycle.
Late gadolinium enhancement
LGE images were acquired approximately 10–15 min after bolus injection of gadolinium- diethylenetriaminepentaacetic acid (DTPA; Magnevist 0.15 mmol/kg) at the same locations as described for the cine imaging. A phase sensitive inversion recovery sequence was used (TR 7.1 ms, TE 3.4 ms, flip angle 25°, FOV 300 – 340 mm, resolution 1.8 × 1.3, slice thickness 8 mm). LGE images were scored visually by 2 experienced observers (S.K, M.S).
Strain Imaging
A spiral cine displacement encoding with stimulated echoes (DENSE) pulse sequence was used to quantify circumferential strain and strain rate. Sequence parameters included: TR 17ms, TE 1.8ms, flip angle 20°, FOV 350mm2, resolution 2.5 mm × 2.5 mm, slice thickness 8 mm, number of spiral interleaves 6, temporal resolution 34 ms (16, 17). Images were obtained in basal and mid short axis locations.
Data analysis
T1 maps were calculated from the MOLLI data using a non-linear least squares fit of the signal intensity versus TI on a pixel-by-pixel basis, and the endocardial and epicardial borders of the myocardium were manually segmented using a previously validated custom MATLAB script (15). The mean T1 in a region of interest (ROI) in the ventricular cavity was taken as the blood T1. The partition coefficient (λ) was determined from the slope of a plot of 1/T1 of the myocardium versus 1/T1 of the blood. Data from both the mid and basal slices pre contrast and at time points 10, 15, and 20 minutes post contrast were used for the fitting. The ECV was calculated as (1−Hct) * λ.
Peak Systolic circumferential strain and early diastolic strain rates were computed offline from cine DENSE images with a custom MATLAB script using previously described methods (18).
Statistical Analysis
All continuous variables are expressed as their mean and standard deviation. All statistical analysis was performed using SPSS version 21 (IBM SPSS Statistics 21). Values were compared between groups using one-way ANOVA, the Scheffe method was used to control for multiple pairwise corrections. Age and number of BP meds for the three groups as shown in Table 1 were reported as median scores with inter-quartile ranges. Test of non-normal across the groups was performed using the Kruskal-Wallis test. Correlation analysis utilized the Pearson’s correlation coefficient for linear associations, and the Spearman’s Rank Correlation coefficient for monotonic non-linear associations. A p-value less than 0.05 was considered significant.
Table 1.
Baseline characteristics of HTN LVH subjects, HTN Non-LVH subjects and controls. LVH = left ventricular hypertrophy; BP = blood pressure; HTN = hypertension; LV = left ventricular; LVMI = left ventricular mass index.
| Normotensive controls (n=22) | Hypertensive Non- LVH (n=23) | Hypertensive LVH (n=20) | |
|---|---|---|---|
| Sex | 15 F; 7 M | 13 F; 10 M | 14 F; 6 M |
| Age (yrs)# | 54 (48–61) | 64 (56–71) | 55 (44–66) |
| Systolic BP (mm Hg) | 123 ± 14 | 135 ± 16^ | 151 ± 21*^ |
| Diastolic BP (mm Hg) | 71 ± 11 | 77 ± 11 | 84 ± 16^ |
| Heart Rate | 73 ± 12 | 73 ± 14 | 71 ± 10 |
| Number of HTN meds# | 0 | 2.1 ± 1.1^ | 3.6 ± 1.2*^ |
| LV Mass (g) | 92 ± 20 | 115 ± 31 | 171 ± 39*^ |
| LVMI (g/m2) | 49 ± 7 | 55 ± 9 | 83 ± 14*^ |
| LV mass/volume ratio | 0.71 ± 0.19 | 0.87 ± 0.21 | 1.30 ± 0.40*^ |
Age and HTN meds results are reported as median scores with interquartile ranges.
p <0.05 vs. Non-LVH groups.
p <0.05 vs. controls.
Results
Table 1 shows the baseline characteristics of the three groups. The groups had similar values for heart rate, LV ejection fraction and hematocrit. The systolic and diastolic blood pressures were significantly higher in the HTN LVH group than the HTN Non-LVH and control subjects. LV mass was higher in the HTN LVH group by study design. Two subjects (both in the HTN Non-LVH group) had focal areas of late enhancement: one subject had RV insertion site hyperenhancement and the other had a focal area of mid-wall enhancement in the distal inferior wall, considered to be non-ischemic in origin. These regions were not included on T1 mapping analysis to minimize potential bias from including regions with focal fibrosis. Left ventricular mass/volume ratios for the three groups were calculated. LV mass/volume ratios were higher in the HTN LVH groups when compared to other two groups (Table 1).
ECV
ECV was significantly higher in HTN LVH subjects vs. controls (0.29 ± 0.03 vs. 0.26 ± 0.02, p < 0.01) and HTN Non-LVH subjects (0.29 ± 0.03 vs. 0.27 ± 0.02, p = 0.05) (Table 2) (Figure 2). There were no differences in ECV (p = 0.6) between HTN Non-LVH and control subjects. Similar findings were seen with partition coefficient (λ) (Table 2). Please see attached data supplement for detailed results.
Table 2.
ECV, λ and Native T1 values in HTN LVH subjects vs. Non LVH and controls. LVH = left ventricular hypertrophy.
| Normotensive Controls (n=22) | Hypertensive Non-LVH (n=23) | Hypertensive LVH (n=20 | |
|---|---|---|---|
| Extracellular Volume | 0.26 ± 0.02 | 0.27 ± 0.02 | 0.29 ± 0.03*^ |
| Native T1 (msec) | 967.4 ± 35.0 | 974.0 ± 33.6 | 996.0 ± 32.5^ |
| Partition Coefficient (λ) | 0.43 ± 0.03 | 0.45 ± 0.03 | 0.48 ± 0.04*^ |
p <0.05 vs. Non-LVH groups.
p <0.05 vs. controls.
Figure 2. Extracellular Volume of Gadolinium (ECV) among the three groups.

Box-plot demonstrating the distribution of ECV among the three study groups. Boxes represent the 25th to 75th percentiles, and horizontal lines within the boxes represent the median values. HTN = Hypertension; LVH = Left ventricular hypertrophy; LVMI = Left ventricular mass index.
Native T1
The native T1 of the patients with HTN LVH was longer than that of control subjects (996 ± 32 vs. 967 ± 35, p = 0.007) (Table 2). While the point estimate of native T1 in the HTN Non-LVH group was higher than that of controls, this difference was not statistically significant (Table 2). Post contrast T1 values are provided in the data supplement.
Relationship between ECV, Native T1 and LVMI
A positive association was noted between LVMI and ECV (Figure 3(a)) (Spearman rho = 0.26, p = 0.03). However, ECV was not linearly related to an increase in LVMI. HTN Non-LVH subjects had similar LVMI and ECV levels to that of controls. HTN LVH subjects had higher left ventricular mass index levels as expected and had higher ECV levels. However, subjects with the highest LVMI did not show a proportional increase in ECV. Furthermore, certain HTN LVH subjects with relatively lower LVMI had significantly higher levels of ECV (>0.30). Similarly, a positive association was noted between native T1 levels and LVMI (Figure 3(b)) (Spearman rho = 0.36, p = 0.03).
Figure 3. Correlation between ECV, Native T1 and LVMI.


(a) Extracellular Volume vs. Left Ventricular Mass Index. Spearman correlation shows a positive association (Spearman rho = 0.26, p = 0.03) between ECV and LVMI. (b) Native T1 and Left Ventricular Mass Index. Spearman correlation shows a positive association (Spearman rho = 0.36, p = 0.03) between native T1 levels and LVMI. ECV= Extracellular Volume; HTN = Hypertension; LVH = Left ventricular hypertrophy; LVMI = Left ventricular mass index.
ECV, Native T1, Circumferential Strain and Strain rate
Figure 4(a) shows average circumferential strain-time curves from the three groups. Peak circumferential strain at both base and mid ventricular levels was reduced in HTN LVH subjects when compared to both controls and HTN Non-LVH subjects (Table 3). ECV correlated with peak circumferential strain (R= 0.26, p = 0.05) (Figure 5(a)).
Figure 4. Circumferential strain and strain rates in the three groups.


(a) Circumferential Strain Curves (b) Circumferential strain rates in the three study groups. Average circumferential and circumferential strain rates for the three groups are demonstrated. HTN = Hypertension; LVH = Left ventricular hypertrophy; Ecc = circumferential strain;
Table 3.
Strain and strain rate among the three groups. LVH = left ventricular hypertrophy; e′SR = early diastolic circumferential strain rate.
| Normotensive Controls (n=22) | Hypertensive Non-LVH (n=23) | Hypertensive LVH (n=20) | |
|---|---|---|---|
| Peak Base Circumferential strain | −0.17 ± 0.03 | −0.15 ± 0.03 | −0.12 ± 0.03* |
| Peak Mid Circumferential strain | −0.17 ± 0.03 | −0.17 ± 0.03 | −0.12 ± 0.03* |
| Peak Ave Circumferential strain | −0.17 ± 0.02 | −0.16 ± 0.03 | −0.12 ± 0.02* |
| Base e′SR (s−1) | 0.81 ± 0.17 | 0.68 ± 0.17 | 0.48 ± 0.27* |
| Mid e′SR (s−1) | 0.83 ± 0.19 | 0.72 ± 0.23 | 0.43 ± 0.22* |
| Ave e′SR (s−1) | 0.82 ± 0.16 | 0.71 ± 0.18 | 0.49 ± 0.26* |
p <0.05 vs. Non-LVH groups and Controls.
Figure 5. Correlation between ECV and Circumferential Strain, Strain Rate.


(a) Peak Circumferential Strain vs. ECV. Pearson’s correlation shows a linear association between ECV and Peak circumferential strain (Pearson’s correlation coefficient of 0.26, p =0.05) (b) Average Early Diastolic Circumferential Strain Rate vs. ECV. Pearson’s correlation shows a linear association between ECV and Peak circumferential strain rate (Pearson’s correlation coefficient of −0.34, p =0.01). ECV = Extracellular Volume. Ave e′SR = Average Early Diastolic Circumferential Strain Rate.
Figure 4(b) shows average circumferential strain-rate vs time curves in the three groups. The average early diastolic circumferential strain rate (e′SR) was reduced in HTN LVH subjects when compared to both controls and HTN Non-LVH subjects (0.49±0.26 vs. 0.82±0.16, p<0.0001 and 0.49±0.26vs. 0.71±0.18, p=0.02 respectively) (Table 3). The results were similar for early diastolic circumferential strain rates at both the basal and mid-ventricular levels (Table 3). ECV correlated significantly with average early diastolic circumferential strain rate (R= −0.34, p = 0.01) (Figure 5(b)). Radial strain measurements were also performed and are presented in the data supplement. Native T1 correlated significantly with peak systolic circumferential strain (R= 0.44, p <0.0001) (Figure 6(a)). Native T1 also correlated significantly with e′SR (R= −0.40, p <0.01) (Figure 6(b)).
Figure 6. Correlation between Native T1 and Circumferential Strain, Strain Rate.


(a) Peak Circumferential Strain vs. Native T1. Pearson’s correlation shows a linear association between native T1 levels and Peak circumferential strain (Pearson’s correlation coefficient of 0.44, p <0.0001) and (b) Average Early Diastolic Circumferential Strain Rate vs. Native T1. Pearson’s correlation shows a linear association between native T1 levels and average early diastolic circumferential strain rate (Pearson’s correlation coefficient of −0.40, p <0.01). ECV = Extracellular Volume. Ave e′SR = Average Early Diastolic Circumferential Strain Rate.
LV Mass to Volume ratio, ECV and Circumferential strain
Left ventricular mass to volume ratio correlated significantly with ECV (R= 0.337, p= 0.006) and native T1 (R= 0.341, p= 0.006). Circumferential strain and strain rate correlated significantly with left ventricular mass to volume ratio (R= 0.733, p <0.0001 and R= −0.642, p<0.0001 respectively).
Discussion
In this study, T1 mapping by CMR demonstrated greater diffuse fibrosis as measured by ECV in subjects with HTN LVH as compared to HTN Non-LVH and control subjects. Higher ECV values were associated with reduced peak systolic circumferential strain and early diastolic circumferential strain rate across all subjects. Furthermore, native T1 levels were found to be longer in HTN LVH subjects when compared to normotensive controls. Similarly, increased native T1 was associated with reductions in peak circumferential systolic strain and early diastolic strain rate. Left ventricular mass to volume ratio correlated also with strain and strain rate with increased mass to volume ratio associated with increased ECV, increased native T1 and reduced circumferential strain and strain rate.
ECV and Native T1 have different sensitivity to the underlying changes in the intracellular and extracellular spaces within the myocardium. Native T1 is a function of the relaxation of water in both the extracellular and intracellular compartments and may reflect both changes in cellular hypertrophy or extracellular fibrosis. As there is fast water exchange between these compartments, without giving contrast the contribution of the intracellular and extracellular compartments cannot be separated. Since Gd contrast agents accumulate only in the extracellular space, the post-contrast T1 shortening is primarily due to a shortening of T1 relaxation time in the extracellular space (although the measured T1 is still affected by water exchange with the intracellular compartment)(19). The ECV is calculated from a combination of Native and Post-contrast measurements and reflects the volume fraction of extracellular space on a pixel-wise basis. Thus, Native T1 and ECV are sensitive to different compartments within the myocardium and thus may each reflect different aspects of the pathological changes of hypertensive heart disease.
Myocardial Fibrosis in Hypertension
Myocardial fibrosis is a common end point of many cellular and noncellular pathologic processes in hypertensive heart disease. The pathogenesis of hypertensive heart disease involves remodeling of the myocardium with fibrosis of the muscle and perivascular space, medial hypertrophy of intramyocardial coronary vasculature and cardiomyocyte hypertrophy (20). The mechanisms responsible for the development, progression and pattern of LVH are incompletely defined, but include the severity and duration of hypertension, effects of growth factors, cytokines and neurohormones, and genetic predisposition (21). Myocardial fibrosis predisposes patients to diastolic and systolic dysfunction, myocardial ischemia, and atrial and ventricular arrhythmias (22). A strong correlation has been noted between increased myocardial collagen content, and left ventricular diastolic dysfunction by echocardiography (23). This study also showed that treatment with losartan reduced the collagen content and left ventricular stiffness. This suggests that diffuse fibrosis seen in hypertensives is reversible in response to certain anti-hypertensive therapies. Reduction in diffuse fibrosis can result in improvement of diastolic function, systolic function and perhaps outcomes. Thus, measurement of diffuse fibrosis levels could serve as a therapeutic target to measure the efficacy of anti-hypertensive and other therapies.
Initial animal studies in mice with hypertensive heart disease have shown that measurement of ECV as quantified by CMR T1 measurements can detect extracellular matrix expansion due to underlying interstitial fibrosis (19). Our study likewise employs the measurement of ECV of gadolinium as a surrogate marker for underlying diffuse fibrosis among the study groups. This is the first study to measure the level of diffuse fibrosis using ECV in HTN LVH subjects as compared to HTN Non-LVH subtypes using a non-invasive imaging method. HTN LVH subjects in this study had greater diffuse fibrosis as measured by ECV. The presence of diffuse fibrosis may be an underlying mechanism contributing to the increased cardiovascular risk in HTN LVH subjects and therapies that modify diffuse fibrosis may affect the risk. The link between diffuse fibrosis and increased cardiovascular risk was examined in a recent study (24) of heart failure patients with preserved ejection fraction which found that shortened post-contrast T1 times, a marker of diffuse fibrosis, was associated with increased cardiac events. While there is greater diffuse fibrosis in HTN LVH subjects, the association between ECV and LVMI is non-linear suggesting that there may be differential stimulation of fibrosis and myocyte hypertrophy in these patients. The HTN Non-LVH subjects had better controlled blood pressures and their LV mass was not significantly higher than that of control subjects. Fibrosis in these subjects was similar to that of controls and the lack of fibrosis may be related to the lower risk of cardiovascular events for this group.
Native T1
Native T1 of HTN LVH subjects in this study were significantly higher than that of HTN Non-LVH or control subjects. Native T1 as discussed above, is affected by both intracellular myocardial tissue and the extracellular space. The extracellular fibrosis and myocardial cell hypertrophy seen in HTN LVH patients contribute to elevated native T1 levels. The measurement of native T1 as a potential predictor of increased cardiovascular events in LVH may have added value in that it does not require contrast administration, which may otherwise be contraindicated in those with stage 4 or 5 chronic kidney disease.
Diffuse fibrosis and systolic strain
Earlier studies have demonstrated reduced peak longitudinal and radial systolic strain in hypertensive patients using echocardiography and correlated the reduction in strain with increased collagen synthesis and reduced collagen degradation (25). Studies using CMR myocardial tagging have shown reduction in both circumferential and longitudinal strain in HTN patients with LVH (26). In this study, HTN LVH subjects were found to have significantly reduced peak systolic circumferential strain and e′SR. We also demonstrated a positive correlation between the peak systolic circumferential strain, average e′SR and increasing levels of diffuse fibrosis as measured by ECV and native T1 levels, consistent with the expected relationship between myocardial function and fibrosis. Reduced systolic strain has been previously described in heart failure patients with preserved ejection fraction, many of whom have HTN LVH and similar characteristics (27). A possible mechanism linking ECV to reduced systolic strain in such patients may be increased extracellular matrix deposition leading to increased left ventricular stiffness, resulting in reduced end-diastolic muscle fiber length and, by Frank-Starling’s law, reduced cardiac muscle contraction and LV systolic strain. Indeed, prior studies have also demonstrated that diffuse fibrosis has been linked with worsening systolic/diastolic function and adverse LV remodeling (22). However further studies are needed to verify this hypothesis.
Limitations
The study is limited by a relatively small sample size; however, this is the largest study to date evaluating ECV in hypertensive heart disease and LVH. Given the small sample size of this study the effect of variables such as age, gender, diabetes, hypertension duration or anti-hypertensive medications such as renin-angiotensin inhibitors on ECV and native T1 could not be evaluated. While the severity of LVH by CMR was relatively mild in this study, it was associated with increased levels of ECV and higher native T1, suggesting significantly greater diffuse fibrosis in the HTN LVH group when compared to the other groups. There are differing methods of T1 mapping, and although consensus guidelines have recently been published regarding use of T1 mapping, further research is needed prior to establishing a standardized method of T1 mapping for clinical use (28). The method that we used in this study was previously compared to that of the standard MOLLI technique and produced similar results (15). Also, the applicability of results to an individual subject is less certain given the higher variability of T1 relaxation times and thus, ECV when only measured in a single subject. The use of multiple points for the calculation of partition coefficient and ECV in our study is advantageous as it allows us to check the assumption of linearity at different time points to verify the equilibrium assumption and it enables an assessment of the uncertainty in determining. The use of only two time points (one pre and one post) does not permit the measure of uncertainty of the fit and may be more sensitive to measurement outliers. Two of our control subjects as mentioned above had elevated ECV levels and it is unclear if these results are due to normal variation or due to undetermined pathologies.
Future Directions
There is limited data on the prognostic value of diffuse fibrosis as measured by ECV in hypertensive subjects. Additionally, the prognostic value of Native T1 levels has yet to be studied in this study population. While diffuse fibrosis in HTN LVH subjects may be an underlying mechanism that explains the increased cardiovascular morbidity and mortality seen in these subjects, further studies are needed to conclusively link the presence of diffuse fibrosis with hard outcomes in these patients. Currently only one study has evaluated the prognostic capability of T1 mapping in predicting cardiovascular events in a similar study population (24).
Conclusions
The present study demonstrates that HTN LVH patients have greater diffuse fibrosis and reduced circumferential strain and circumferential strain rate when compared to HTN Non-LVH and control subjects. While diffuse fibrosis is linearly related to worsening circumferential strain, variations in ECV among patients with LVH may provide insight into the differential expression of fibrosis and myocyte hypertrophy among patients with hypertensive heart disease. Measurement of ECV and native T1 levels may serve as a useful novel target to monitor the efficacy of therapies for HTN patients.
Supplementary Material
Acknowledgments
Funding Sources: Sujith Kuruvilla receives grant support from the NIH T32 5T32EB003841. Michael Salerno acknowledges grant support from NIH K23 HL112910. Ellen Keeley receives grant support from NIH HL97074 and American Heart Association G13IRG14560018.
Abbreviations
- HTN
Hypertension
- LVH
Left ventricular hypertrophy
- LGE
Late gadolinium enhancement
- CMR
Cardiac magnetic resonance
- ECV
Extracellular volume
- EF
Ejection fraction
- HCT
Hematocrit
- RV
Right ventricle
- LV
Left ventricle
- LVMI
Left ventricular mass index
Footnotes
Disclosures: Dr. Salerno and Dr. Kramer receive research support from Siemens Healthcare.
Publisher's Disclaimer: This is a PDF file of an unedited manuscript that has been accepted for publication. As a service to our customers we are providing this early version of the manuscript. The manuscript will undergo copyediting, typesetting, and review of the resulting proof before it is published in its final citable form. Please note that during the production process errors may be discovered which could affect the content, and all legal disclaimers that apply to the journal pertain.
References
- 1.Go AS, Mozaffarian D, Roger VL, et al. Heart disease and stroke statistics--2013 update: a report from the American Heart Association. Circulation. 2013;127:e6–e245. doi: 10.1161/CIR.0b013e31828124ad. [DOI] [PMC free article] [PubMed] [Google Scholar]
- 2.Janardhanan R, Desai AS, Solomon SD. Therapeutic approaches to diastolic dysfunction. Curr Hypertens Rep. 2009;11:283–91. doi: 10.1007/s11906-009-0048-z. [DOI] [PubMed] [Google Scholar]
- 3.Kannel WB, Gordon T, Castelli WP, Margolis JR. Electrocardiographic left ventricular hypertrophy and risk of coronary heart disease. The Framingham study. Ann Intern Med. 1970;72:813–22. doi: 10.7326/0003-4819-72-6-813. [DOI] [PubMed] [Google Scholar]
- 4.Levy D, Garrison RJ, Savage DD, Kannel WB, Castelli WP. Prognostic implications of echocardiographically determined left ventricular mass in the Framingham Heart Study. N Engl J Med. 1990;322:1561–6. doi: 10.1056/NEJM199005313222203. [DOI] [PubMed] [Google Scholar]
- 5.Querejeta R, Varo N, López B, et al. Serum carboxy-terminal propeptide of procollagen type I is a marker of myocardial fibrosis in hypertensive heart disease. Circulation. 2000;101:1729–35. doi: 10.1161/01.cir.101.14.1729. [DOI] [PubMed] [Google Scholar]
- 6.Rossi MA. Pathologic fibrosis and connective tissue matrix in left ventricular hypertrophy due to chronic arterial hypertension in humans. J Hypertens. 1998;16:1031–41. doi: 10.1097/00004872-199816070-00018. [DOI] [PubMed] [Google Scholar]
- 7.Levy D, Larson MG, Vasan RS, Kannel WB, Ho KK. The progression from hypertension to congestive heart failure. JAMA. 1996;275:1557–62. [PubMed] [Google Scholar]
- 8.Cuspidi C, Giudici V, Negri F, et al. Left ventricular geometry, ambulatory blood pressure and extra-cardiac organ damage in untreated essential hypertension. Blood Press Monit. 2010;15:124–31. doi: 10.1097/MBP.0b013e328337ceeb. [DOI] [PubMed] [Google Scholar]
- 9.Flett AS, Hayward MP, Ashworth MT, et al. Equilibrium contrast cardiovascular magnetic resonance for the measurement of diffuse myocardial fibrosis: preliminary validation in humans. Circulation. 2010;122:138–44. doi: 10.1161/CIRCULATIONAHA.109.930636. [DOI] [PubMed] [Google Scholar]
- 10.Pickering TG, Hall JE, Appel LJ, et al. Recommendations for blood pressure measurement in humans and experimental animals: part 1: blood pressure measurement in humans: a statement for professionals from the Subcommittee of Professional and Public Education of the American Heart Association Council on High Blood Pressure Research. Circulation. 2005;111:697–716. doi: 10.1161/01.CIR.0000154900.76284.F6. [DOI] [PubMed] [Google Scholar]
- 11.Olivotto I1, Maron MS, Autore C, et al. Assessment and significance of left ventricular mass by cardiovascular magnetic resonance in hypertrophic cardiomyopathy. J Am Coll Cardiol. 2008;52(7):559–66. doi: 10.1016/j.jacc.2008.04.047. [DOI] [PubMed] [Google Scholar]
- 12.Van der Geest RJ1, Buller VG, Jansen E, et al. Comparison between manual and semiautomated analysis of left ventricular volume parameters from short-axis MR images. J Comput Assist Tomogr. 1997;21(5):756–65. doi: 10.1097/00004728-199709000-00019. [DOI] [PubMed] [Google Scholar]
- 13.Schulz-Menger J1, Bluemke DA, Bremerich J, et al. Standardized image interpretation and post processing in cardiovascular magnetic resonance: Society for Cardiovascular Magnetic Resonance (SCMR) board of trustees’ task force on standardized post processing. J Cardiovasc Magn Reson. 2013;15(1):35. doi: 10.1186/1532-429X-15-35. [DOI] [PMC free article] [PubMed] [Google Scholar]
- 14.Messroghli DR, Greiser A, Fröhlich M, Dietz R, Schulz-Menger J. Optimization and validation of a fully-integrated pulse sequence for modified look-locker inversion-recovery (MOLLI) T1 mapping of the heart. J Magn Reson Imaging. 2007;26:1081–6. doi: 10.1002/jmri.21119. [DOI] [PubMed] [Google Scholar]
- 15.Salerno M, Janardhanan R, Jiji RS, et al. Comparison of methods for determining the partition coefficient of gadolinium in the myocardium using T1 mapping. J Magn Reson Imaging. 2013;38:217–24. doi: 10.1002/jmri.23875. [DOI] [PMC free article] [PubMed] [Google Scholar]
- 16.Kim D, Gilson WD, Kramer CM, Epstein FH. Myocardial tissue tracking with two-dimensional cine displacement-encoded MR imaging: development and initial evaluation. Radiology. 2004;230(3):862–871. doi: 10.1148/radiol.2303021213. [DOI] [PubMed] [Google Scholar]
- 17.Spottiswoode BS, Zhong X, Lorenz CH, Mayosi BM, Meintjes EM, Epstein FH. Motion-Guided Segmentation for Cine DENSE MRI. Medical Image Analysis. 2009;13(1):105–115. doi: 10.1016/j.media.2008.06.016. [DOI] [PMC free article] [PubMed] [Google Scholar]
- 18.Spottiswoode BS, Zhong X, Hess AT, et al. Tracking myocardial motion from cine DENSE images using spatiotemporal phase unwrapping and temporal fitting. IEEE Trans Med Imaging. 2007;26:15–30. doi: 10.1109/TMI.2006.884215. [DOI] [PubMed] [Google Scholar]
- 19.Coelho-Filho OR, Mongeon FP, Mitchell R, et al. Role of transcytolemmal water-exchange in magnetic resonance measurements of diffuse myocardial fibrosis in hypertensive heart disease. Circ Cardiovasc Imaging. 2013;6:134–41. doi: 10.1161/CIRCIMAGING.112.979815. [DOI] [PMC free article] [PubMed] [Google Scholar]
- 20.Díez J, González A, López B, Querejeta R. Mechanisms of disease: pathologic structural remodeling is more than adaptive hypertrophy in hypertensive heart disease. Nat Clin Pract Cardiovasc Med. 2005;2:209–16. doi: 10.1038/ncpcardio0158. [DOI] [PubMed] [Google Scholar]
- 21.Hill JA, Olson EN. Cardiac plasticity. N Engl J Med. 2008;358:1370–80. doi: 10.1056/NEJMra072139. [DOI] [PubMed] [Google Scholar]
- 22.McLenachan JM, Dargie HJ. Ventricular arrhythmias in hypertensive left ventricular hypertrophy. Relationship to coronary artery disease, left ventricular dysfunction, and myocardial fibrosis. Am J Hypertens. 1990;3:735–40. doi: 10.1093/ajh/3.10.735. [DOI] [PubMed] [Google Scholar]
- 23.Díez J, Querejeta R, López B, González A, Larman M, Martínez Ubago JL. Losartan-dependent regression of myocardial fibrosis is associated with reduction of left ventricular chamber stiffness in hypertensive patients. Circulation. 2002;105:2512–7. doi: 10.1161/01.cir.0000017264.66561.3d. [DOI] [PubMed] [Google Scholar]
- 24.Mascherbauer J, Marzluf BA, Tufaro C, et al. Cardiac magnetic resonance postcontrast t1 time is associated with outcome in patients with heart failure and preserved ejection fraction. Circ Cardiovasc Imaging. 2013;6:1056–65. doi: 10.1161/CIRCIMAGING.113.000633. [DOI] [PubMed] [Google Scholar]
- 25.Plaksej R, Kosmala W, Frantz S, et al. Relation of circulating markers of fibrosis and progression of left and right ventricular dysfunction in hypertensive patients with heart failure. J Hypertens. 2009;27:2483–91. doi: 10.1097/HJH.0b013e3283316c4d. [DOI] [PubMed] [Google Scholar]
- 26.Palmon LC, Reichek N, Yeon SB, et al. Intramural myocardial shortening in hypertensive left ventricular hypertrophy with normal pump function. Circulation. 1994;89:122–31. doi: 10.1161/01.cir.89.1.122. [DOI] [PubMed] [Google Scholar]
- 27.Kraigher-Krainer E1, Shah AM1, Gupta DK1, et al. Impaired systolic function by strain imaging in heart failure with preserved ejection fraction. J Am Coll Cardiol. 2014;63(5):447–56. doi: 10.1016/j.jacc.2013.09.052. [DOI] [PMC free article] [PubMed] [Google Scholar]
- 28.Moon JC, Messroghli DR, Kellman P, et al. Myocardial T1 mapping and extracellular volume quantification: a Society for Cardiovascular Magnetic Resonance (SCMR) and CMR Working Group of the European Society of Cardiology consensus statement. J Cardiovasc Magn Reson. 2013;15:92. doi: 10.1186/1532-429X-15-92. [DOI] [PMC free article] [PubMed] [Google Scholar]
Associated Data
This section collects any data citations, data availability statements, or supplementary materials included in this article.