

Significance
We present here an entirely novel concept in the field of cell–cell adhesion, whereby the flexibility of the extracellular domains of cadherin molecules determines the characteristics and behavior of intercellular junctions. The structure of the ectodomain of the desmosomal cadherin desmoglein 2 shows it is flexible in its calcium-bound form. This flexibility of the desmosomal cadherin ectodomains may be key in facilitating a unique property of desmosomes: the ability to switch from strong calcium-independent hyperadhesion in adult tissues to weaker calcium-dependent adhesion in wounds.
Keywords: cadherins, desmosomes, adhesion, small-angle X-ray scattering, structure
Abstract
Desmosomes and adherens junctions are intercellular adhesive structures essential for the development and integrity of vertebrate tissue, including the epidermis and heart. Their cell adhesion molecules are cadherins: type 1 cadherins in adherens junctions and desmosomal cadherins in desmosomes. A fundamental difference is that desmosomes have a highly ordered structure in their extracellular region and exhibit calcium-independent hyperadhesion, whereas adherens junctions appear to lack such ordered arrays, and their adhesion is always calcium-dependent. We present here the structure of the entire ectodomain of desmosomal cadherin desmoglein 2 (Dsg2), using a combination of small-angle X-ray scattering, electron microscopy, and solution-based biophysical techniques. This structure reveals that the ectodomain of Dsg2 is flexible even in the calcium-bound state and, on average, is shorter than the type 1 cadherin crystal structures. The Dsg2 structure has an excellent fit with the electron tomography reconstructions of human desmosomes. This fit suggests an arrangement in which desmosomal cadherins form trans interactions but are too far apart to interact in cis, in agreement with previously reported observations. Cadherin flexibility may be key to explaining the plasticity of desmosomes that maintain tissue integrity in their hyperadhesive form, but can adopt a weaker, calcium-dependent adhesion during wound healing and early development.
Vertebrate tissues contain two principal types of adhesive intercellular junctions: adherens junctions (AJs) and desmosomes. AJs are involved in dynamic cell interactions in development and disease, whereas desmosomes are responsible for strong adhesion in epithelia and cardiac muscle (1, 2). Both types of intercellular junction are essential for development and normal tissue homeostasis. Their adhesion is mediated by cadherins: type 1 cadherins in AJs and desmosomal cadherins (desmogleins and desmocollins) in desmosomes. A conundrum arises because the extracellular (EC) domains of type 1 cadherins form regular arrays in crystals and when inserted into liposomes (3, 4), but such arrays have not been observed in AJs in vivo. In contrast, desmosomes exhibit ordered arrays of the EC domains in vivo (5). In functional terms, the ordered array in desmosomes is associated with strong, calcium-independent adhesion, known as hyperadhesion, which can revert rapidly to a less organized, calcium-dependent form on tissue wounding (6, 7). AJs, in contrast, are always calcium-dependent (8, 9).
The desmosomal cadherins, desmogleins 1–4 (Dsg1–Dsg4) and desmocollins 1–3 (Dsc1–Dsc3), are transmembrane glycoproteins with ectodomains made of five extracellular cadherin domains (EC1–EC5). Malfunction of these proteins results in serious pathologies (10). Dsg2 is the most ubiquitous desmosomal cadherin, expressed in all desmosome-forming tissues including epithelia, myocardium, and lymph nodes (11). Dsg2 is highly expressed in melanoma cells (12), and mutations in Dsg2 are lethal in familial arrhythmogenic right ventricular dysplasia (13). Sequence similarity suggests that desmosomal cadherins have a domain structure similar to that of type 1 cadherins (6). However, structural information on the 3D architecture of Dsgs and Desmocollins (Dscs) is still lacking, which limits the understanding of their specific role in desmosomal adhesion and dynamics.
We report here the first structural and biophysical characterization, to our knowledge, of the entire ectodomain of Dsg2. We show that this ectodomain has significant conformational interdomain flexibility even in its calcium-bound form, providing a structural basis for desmosomal plasticity. The structure is shorter than the extended conformations reported for X-ray structures of type 1 cadherins and shows an excellent fit with the electron tomography (ET) of human desmosomes (14), which is consistent with the lack of cis interactions observed for desmosomal cadherins (15).
Results and Discussion
The full-length ectodomain (EC1–EC5) of mouse Dsg2 (mDsg2) was expressed in Chinese hamster ovary (CHO) cells and purified to homogeneity (Fig. S1). N-linked glycosylation of purified mDsg2 was confirmed by mobility shift in SDS/PAGE after treatment with peptide-N-glycosidase F (PNGase F) (Fig. S1). Size-exclusion chromatography with multiangle light scattering (SEC-MALLS) showed mDsg2 as monodisperse and monomeric in solution, with a molecular mass of 68 kDa (Fig. S1). This mass represents an excess of 5 kDa over the value calculated from the protein sequence alone (63 kDa) and is consistent with two or three N-glycans, depending on their composition.
Hydrodynamic parameters for mDsg2 with or without added Ca2+ were determined using analytical ultracentrifugation (AUC) and SEC/MALLS (Fig. 1A and Fig. S1). Samples with added Ca2+ will be referred to here as Dsg2-Ca, and samples without as Dsg2-EDTA. Sedimentation velocity profiles showed well-defined peaks for either sample (Fig. 1A), with sedimentation coefficients of 3.49S (Dsg2-Ca) and 3.91S (Dsg2-EDTA). Hydrodynamic radius (Rh = 4.6 nm) and frictional ratio (f/f0 = 1.7) indicate that Dsg2-Ca is anisotropic and behaves as a prolate particle. In contrast, Dsg2-EDTA has a more compact shape (Rh = 4.1 nm, f/fo = 1.54). The different sedimentation and elution profiles indicate that both forms are clearly distinct in shape and hydrodynamic behavior (Fig. 1 and Fig. S1).
Fig. 1.
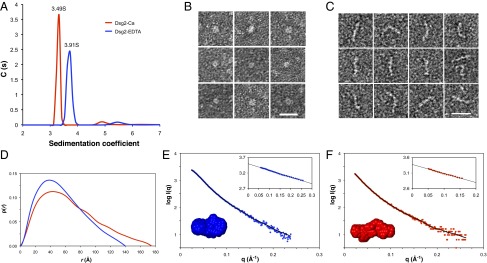
Structural and biophysical analyses of mDsg2. (A) Fitted distribution of the sedimentation coefficients for Dsg2-EDTA (blue) and Dsg2-Ca (red). The higher sedimentation coefficient in the absence of Ca2+ indicates a more compact particle, consistent with the lower Rh of 4.1 nm and a f/f0 of 1.54 compared with the sample with Ca2+ (Rh, 4.6 nm; f/f0, 1.72). Representative EM images of Dsg2-EDTA (B) and Dsg2-Ca (C) samples after negative staining. The Dsg2-EDTA particles appear as compact globules, whereas the Dsg2-Ca particles display a range of morphologies, some of them bent or curled at the ends. (Scale bar, 20 nm.) (D) The p(r) distribution plot for Dsg2-EDTA (blue) and Dsg2-Ca (red) shows Dmax of 140 and 175 Å, respectively. SAXS profiles showing the log of X-ray scattering intensity (logI) as a function of the scattering vector q for the experimental scattering data Dsg2-EDTA (blue) (E) and Dsg2-Ca (red) (F). The normalized fit to the experimental data (from the program GNOM) is superimposed as a black line). (Inset, top right) Guinier plot (logI vs. q2) of the low q region of the X-ray scattering data where the radius of gyration (Rg) can be measured from the gradient of the slope . (Inset, bottom left) Average DAMMIN models for Dsg2-Ca (red) and Dsg2-EDTA (blue).
Hydrodynamic parameters were consistent with observations of both forms under negative staining electron microscopy (EM) (Fig. 1 B and C and Fig. S2). The Dsg2-Ca form showed significant conformational variability, with molecules adopting a number of more or less extended different conformations (L-shaped, S-shaped, rod-like) (Fig. 1C). In the Dsg2-EDTA form, almost all molecules (97%) appeared compact (Fig. 1B and Fig. S2). Average contour lengths (19.2 nm) and end-to-end/contour length ratios (0.8) for Dsg2-Ca are consistent with individually elongated, but not completely extended, particles (Fig. S2).
The molecular shape and particle dimensions of mDsg2 in solution were investigated by small-angle X-ray scattering (SAXS). Measurements were collected on both Dsg2-Ca and Dsg2-EDTA samples. Estimates of the radius of gyration (Rg) were obtained from the Guinier region with PRIMUS (16), and the maximum dimension (Dmax) was obtained from indirect Fourier transformation of the SAXS profiles using GNOM (17) (Fig. 1 D–F). For Dsg2-EDTA, Rg was 40 Å and Dmax was 140 Å. In contrast, larger values were observed for Dsg2-Ca, with an Rg of 51 Å and a Dmax of 175 Å (Fig. S1D). These data indicate that mDsg2 is more extended in the presence of calcium while being shorter and compact in the absence of calcium, thus confirming the hydrodynamic analysis.
The probable atom-pair distribution function p(r) (Fig. 1D) is also consistent with shape differences for both samples. Dsg2-EDTA presents a broad symmetrical curve with a maximum at 40 Å, less than half its Dmax, suggesting the molecule adopts a compact oblate shape. The Dsg2-Ca curve shows clear asymmetry, typical of elongated molecules. The Kratky-Debye plots (Fig. S3A) show that in both cases, the protein is folded, but the Dsg2-Ca plot plateaus at higher q, indicating greater flexibility. In agreement with these observations, the lack of a clear plateau in the Porod-Debye plot for the Dsg2-Ca data also indicates flexibility of the particles compared with the equivalent plot for the Dsg2-EDTA data (Fig. S3B). Porod exponents of 2.6 and 2.9 for Dsg2-Ca and Dsg2-EDTA, respectively, suggests a more compact shape in the absence of calcium, which is supported by an increase in cross-sectional radius from 22.4 to 24.3 Å.
Particle shapes were restored ab initio from the experimental scattering profiles in DAMMIN (18), using q < 0.24 Å−1. An averaged filtered envelope was then produced with DAMAVER (19) (Fig. 1 E and F). Averaged envelopes have dimensions of 126 × 60 × 40 Å for Dsg2-EDTA and 173 × 40 × 30 Å for Dsg2-Ca, matching the dimensions estimated from EM (Fig. S2). Calculated hydrodynamic parameters of the ab initio models, with Rg values of 4.4 and 4.9 nm and sedimentation coefficients of 3.6S and 3.4S for Dsg2-EDTA and Dsg2-Ca, respectively, are also in good agreement with the experimental parameters (Fig. S1).
The conformational flexibility was investigated using the ensemble optimization method (EOM) (20) on a pool of 10,000 models generated from the five individual EC domains of mDsg2. The EOM ensemble analysis of Dsg2-Ca shows a very broad distribution of Rg and Dmax values (Fig. 2A and Fig. S4), reflecting a significant degree of interdomain flexibility. The average Rg (53.3 Å) and Dmax (179 Å) of the final ensemble match well the values estimated by GNOM and show a reasonable agreement with the SAXS data, with χ2 = 1.10 (= 1.38). Extended conformers similar to the X-ray structures of classical cadherins (Dmax > 220 Å) are minimally represented in the ensemble distribution (Fig. S4) and absent in the final ensemble models. These results indicate that Dsg2-Ca is flexible in solution and may adopt a number of different conformations, such as those represented by the final ensemble (Fig. 2B). As expected, the Dsg2-EDTA EOM analysis shows a distribution that is much narrower than the initial pool and shifted toward compact forms, with an average Rg of 40.4 Å and Dmax of 132.03 Å for the final ensemble (Fig. 2A and Fig. S4), and with χ2 = 1.18 (= 1.22). The models selected by EOM are quite compact and bent at the interdomain linkers (Fig. 2C).
Fig. 2.

EOM ensemble analysis. (A) Rg distribution of the random pool and selected ensembles for Dsg2-EDTA (blue) and Dsg2-Ca (red) generated with EOM. Ab initio shape restoration of Dsg2-Ca (B) and Dsg2-EDTA (C); superimposed are the models of the final ensemble.
Nevertheless, an in-depth analysis of the EOM results shows that a large proportion of models in the ensembles are inconsistent with the experimental hydrodynamic data. This is readily apparent when plotting the calculated Rg versus sedimentation coefficients for each of the 10,000 models generated by EOM, where only a small number of models have values consistent with the sharp distribution of s observed experimentally (Fig. 3A). In particular, the EOM distributions of both Dsg2-Ca and Dsg2-EDTA show peaks for models with Rg values around 45 Å (Fig. 2A), but their corresponding s values fall completely outside the range of measured s values (Fig. 3A).
Fig. 3.
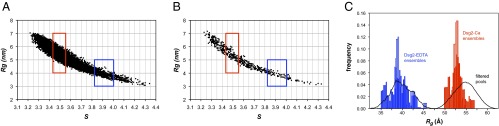
Pool filtering analysis. Plots of Rg vs. sedimentation coefficients (s) as calculated with SoMo for the Ranch model pool (A) and the TAMD model pool (B). Dots represent the pairwise values for each individual model generated. The range of experimentally determined values for s (±1σ) is shown as red boxes for Dsg2-Ca and blue boxes for Dsg2-EDTA. (C) Rg distribution of EOM ensembles for the filtered subsets generated by Ranch (solid bars) and by TAMD with CNS (open bars).
A novel approach was adopted to address this inconsistency, where subsets of conformers for Dsg2-Ca and Dsg2-EDTA were selected on the basis of their calculated sedimentation coefficients and then fitted to experimental SAXS profiles. One subset was selected from the initial EOM pool of 10,000 random models (Fig. 3A). The second subset was selected from a pool of 500 models generated by restrained torsion angle molecular dynamics (TAMD) with crystallography and NMR system (CNS) (21) (Fig. 3B).
These subsets were used for ensemble analysis, using both GAJOE (20) and the minimal ensemble search (Mes) (22), as implemented in FoXS (23). This procedure yielded a narrower distribution of the optimized ensemble (Fig. 3C and Fig. S4). The FoXS-Mes analysis identified two main conformers from the filtered EOM subset (with 87% and 13% contributions) and three from the filtered TAMD subset (54%, 18%, and 28%). Both ensembles showed a good fit with the experimental SAXS data, with χ2 of 1.19 and 1.24, respectively, and of 1.45 and 1.55 (Fig. S4). The use of experimental hydrodynamic data in combination with multiple approaches to generate molecular models proved a fast and robust way to select stereochemically sound models to describe our SAXS data.
The more elongated type 1 cadherin X-ray structures showed poor agreement with the SAXS profile (χ2 = 7–8). These structures have a significantly larger Rg (>6.4 nm), consistent with their more extended conformations, and are >28% longer than the average ab initio Dsg2 models (Fig. S1). Clearly, the best fit to our experimental data came from models with a higher degree of interdomain flexibility than that observed in the X-ray structures (3, 24).
Two factors that differentiate desmosomal from type 1 cadherins may contribute to Dsg2 flexibility: lower degree of glycosylation and poor conservation of calcium binding sites. Glycosylation is an important modulator of rigidity in proteins (25–27), and type 1 cadherins are extensively glycosylated, with up to 9 N- and 16 O-glycosylated sites predicted (28, 29), and 15 observed in cadherin crystal structures (3, 24). In contrast, desmogleins have fewer predicted N-linked glycosylation sites than classical cadherins. There are five predicted glycosylation sites in hDsg2, three already identified in human cells (30, 31), four in Dsg3 [two confirmed (30)], and two in Dsg1 and Dsg4 (unconfirmed). There are four predicted N-glycosylation sites in mDsg2 (Fig. S1), with only one confirmed experimentally (31). Recently, information for O-glycosylation in Dsg2 (three sites) and Dsc2 (one site) has also been reported (28).
Our molecular mass data are consistent with at least two, or possibly three, N-glycans present in the protein expressed in CHO cells. This limited glycosylation may allow for flexibility, as we observed in our solution studies, and perhaps the same occurs for other desmogleins and desmocollins, although no structural information is yet available for these proteins.
Strict sequence conservation at the interdomain linkers of type 1 cadherins, containing the DXND/E calcium-binding motifs, ensures full octahedral coordination of three Ca2+ ions (Table S1 and Figs. S5 and S6). In contrast, Dsgs show several substitutions in these motifs that result in the loss of essential residues for Ca2+ coordination (Fig. 4A and Fig. S5 and Table S1). Predicted Ca2+ binding sites are more conserved for Dscs, apart from one substitution in hDsc2 (Fig. S5). In mDsg2, three residue substitutions occur at the EC3–EC4 linker region: N334 to V (or K in hDsg2), Q375 to A, and D424 to S, resulting in the loss of three Ca2+-coordinating side chains out of the seven observed in type 1 cadherins (3, 24) (Fig. 4B). Furthermore, three residues in the EC4–EC5 linker region appear to be too distant for proper Ca2+ coordination (Fig. 4C). Human Dsgs1–Dsgs4 also show several substitutions at EC3–EC4 and EC4–EC5 linker regions (Fig. 4A and Fig. S5). This weaker coordination will affect the Ca2+-binding affinity and result in enhanced interdomain flexibility of these molecules. Our conclusion is also consistent with the well-established concept that Ca2+-binding rigidifies type 1 cadherins (32, 33) and with the kinked structure of Drosophila N-cadherin, which has a Ca2+-free interdomain linker between EC2 and EC3 (34).
Fig. 4.

Calcium coordination in Dsg2 is not conserved. (A) Table listing the residues involved in EC3–EC4 and EC4–EC5 interdomain calcium coordination. Nonconservative substitutions in mDsg2 and hDsgs are in red; residues located too far for proper coordination are in brackets. (B) Side chain coordination of one of the three Ca2+ ions at the EC3–EC4 region; residues coordinating the same Ca2+ ion (purple) in N-cadherin (PDB ID code 3Q2W, orange chain) and in the mDsg2 homology model in green. (C) Coordination of one of the three Ca2+ ions at the EC4–EC5 region; the two Ca2+ binding residues D470 and D525 located in loop regions are too distant from the calcium ion, leaving only residues N444 and D472 available for coordination. Gray spheres are the other two Ca2+ ions.
The Dsg2-Ca ab initio model was docked into the ET map of the human desmosome (14). This gave an excellent match with the 3D architecture of the desmosome (Fig. 5). An array generated from the fitted models (Fig. 5 and Fig. S7) reveals a clear midline (Fig. 5D and Movie S1), as observed in EM images of desmosomes (6). The fitting indicates clear trans-dimer interactions across the midline region, extending along parallel rows, separated by deep valleys. However, cis interactions are not possible across the rows or columns because distances between them are too great (57 and 64 Å, respectively) (Fig. 5). This argues strongly against a model in which trans and cis interactions combine to form a zipper-like structure along the midline, as observed in the crystal structures of type 1 cadherins. Instead, we propose a model for the desmosome architecture in which parallel rows of Dsgs or Dscs form only trans interactions across the midline (Fig. 5 and Fig. S7). Importantly, this new model reconciles the structural data (14) with the experimental evidence that desmosomal cadherins, in desmosome-forming cells, form homophilic isoform-specific interactions in trans, with no evidence of cis interactions (15). Although there are no cis interactions, it is possible that at the midline, trans interactions are enhanced in vivo in some way not represented by the resolution that our techniques afford.
Fig. 5.

Fitting of the ab initio model into the desmosome tomography maps. (A) The electron density maps derived from the ET of the human native epidermal desmosome (14) were used to fit the DAMMIN model for Dsg2-Ca. Excellent fit was obtained, as shown in B, where four DAMMIN models illustrate the trans dimer interactions across the midline (MD). (C) Side view of the four DAMMIN models shown in B. Side (D) and top (E) view projections of an idealized array generated with the DAMMIN models from the fitting into the ET maps. A midline (MD) is clearly visible on the side view projection.
The segregation between Dsgs and Dscs may be related to significant differences in the sequences of their EC1 and EC2 domains, which provide the trans and cis interfaces in type 1 cadherins (35, 36). Desmosomal cadherins contain the conserved Trp2 in their A-strand and the hydrophobic binding pocket necessary for adhesion via strand-swapped dimerization, as described for type 1 cadherins (35). However, differences between Dscs and Dsgs in the A-strand trans interface may explain their high isoform specificity observed experimentally (15). Dsgs contain more basic and acid residues in the A-strand (up to 14 in total) than Dscs (only three acid) or type 1 cadherins (four basic and three acid) (Fig. S5). All these residues are surface-exposed, as observed in the structure of the EC1 domain of Dsg2 (PDB ID code 2YQG), and may promote strong ionic interactions between Dsgs, selecting against the less charged interfaces of Dscs.
The A-strand motif Ile-Pro-Pro, conserved in type I cadherins and in Dscs (Pro-Ile-Pro), is absent in Dsgs in which one of the residues is Ala. This motif is important to favor the dissociation of the adhesive group, facilitating strand-swap dimerization. Mutations in this motif (Pro to Ala) increase the affinity of trans homophilic dimers (37), an idea that aligns well with the hyperadhesion in desmosomes and desmosomal cadherin specificity. Furthermore, adhesion in type 1 cadherins occurs in a two-step mechanism that uses an intermediate X-dimer to facilitate the conversion from monomers to strand-swapped dimers. Conservation of the X-dimer interface is important in controlling the kinetics of this mechanism. This interface is poorly conserved in desmosomal cadherins: the Lys/Arg14 residue conserved in type 1 cadherins is Leu in Dscs and Asp in Dsgs; the Lys14Glu mutation in type 1 cadherins prevents X-dimer formation (38). Thus, it is reasonable to assume that this intermediate in adhesion is not formed in desmosomal cadherins.
Finally, the cis interface conserved across subtypes of type 1 cadherins is only partially present in the EC1 of desmosomal cadherins and is absent in their EC2 domains. This lack of predicted cis interface supports the experimental cross-linking data and the ET models, as discussed earlier. Overall, the flexibility observed for Dsg2 and the significant differences in the adhesion interfaces of desmosomal cadherins suggest a different mechanism for strand-swapped dimerization for these proteins. Although this mechanism remains to be elucidated for desmosomal cadherins, it appears to be driven by specific, homophilic interactions and favors strong adhesion.
Here we present evidence that, as in classical cadherins (32), absence of Ca2+ causes the ectodomain of Dsg2 to collapse into a compact particle. In the presence of Ca2+, that is, under physiological conditions, a substantial conformational change is evident, although it does not result in an extended molecule, as observed for type 1 cadherins (3, 24, 32, 33, 39–42). Interdomain flexibility is consistent with the data measured by the different techniques, indicating that the ectodomain of Dsg2 may adopt different conformations significantly shorter than a fully extended molecule. The Dsg2 ectodomain is, on average, 50 Å shorter than the X-ray structures of type 1 cadherins ectodomains (3, 24), but it agrees with the dimensions reported for human desmosomes (14). That study estimated an average intermembrane distance of 350 ± 30 Å, which is exactly the length of two Dsg2 ectodomains with an average of 175 Å each emanating from opposite cells. In contrast, it is difficult to reconcile with the longer type 1 cadherins (>220 Å) unless substantial overlap at the midline and/or an increase in the intermembrane distance is considered.
We explain this flexibility based on the lack of sequence conservation at two interdomain calcium-binding sites (EC3–EC4 and EC4–EC5) that would loosen the conformational rigidity observed in classical cadherins, which have full occupancy of Ca2+ in all sites.
These unexpected findings explain, at least in part, a fundamental unsolved question and crucial difference in in vivo behavior between desmosomes and AJs. Thus, in vivo, where cadherin ectodomains are constrained by their membrane insertion and cytoskeletal attachment, type 1 cadherin ectodomains may be unable to undergo the conformational changes needed to adopt an ordered arrangement. In contrast, desmosomal cadherin ectodomains, being flexible, can pack into ordered arrays, despite their basal attachments. Furthermore, the highly regular architecture of the desmosomal plaque (43–45) may determine the spacings between rows of desmosomal cadherins, resulting in the ordered arrays observed in vivo in a way that is incompatible with ectodomain cis interactions. We believe this flexibility is key to the unique plasticity and dynamic properties of desmosomes. Their hyperadhesive state is essential in maintaining tissue integrity but can switch to the unordered state when required.
Materials and Methods
The ectodomain of mDsg2 (residues 1–560) was expressed in mammalian CHO cells with a C-terminal His6-tag and purified by Ni-NTA affinity chromatography, followed by SEC, in 20 mM Tris⋅Base at pH 8.0, 0.5 M NaCl, 1 mM EDTA, with or without added 5 mM CaCl2. SEC-MALLS and AUC data on purified mDsg2 were collected on a Wyatt Helios 18-angle laser photometer and a Beckman Optima XL-A ultracentrifuge, respectively. Samples for EM were prepared on carbon-filmed 400-mesh copper grids and stained with 1.25% (wt/vol) uranyl acetate. Low-dose images (<10 e/Å2) were obtained on an FEI Tecnai 12 twin-electron microscope at 120 keV. Images were recorded at a magnification of ×42,000 on a 2,000 × 2,000-pixel cooled CCD camera. SAXS measurements were collected on the I22 beam line at Diamond Light Source at a distance of 2.5 m, using an X-ray wavelength of 0.1 nm. Analyses were done with the ATSAS package (46), Scatter (47), and the FoXS server (23). Particle shapes were restored ab initio with DAMMIN (18), and molecular models with multiple interdomain conformations were generated using EOM (20) and by restrained TAMD in CNS (21). Hydrodynamic parameters were calculated with SoMo (48). DAMMIN Dsg2-Ca models were docked into six positions on the EM tomography map of native human epidermal desmosomes (EMData Bank 1374) (14) and used to derive a regular array. Images of the molecular docking were produced with PyMol (49) and Chimera (50). Further details are given in SI Materials and Methods.
Supplementary Material
Acknowledgments
We thank Dr. Marc Malfois for his support during the SAXS data collection and processing at the Diamond Synchrotron Light Source, Adam Huffman for general information technology help, and Deepankar Gahloth for assistance with homology modeling. We thank the Medical Research Council for financial support (G0700074).
Footnotes
The authors declare no conflict of interest.
This article is a PNAS Direct Submission.
This article contains supporting information online at www.pnas.org/lookup/suppl/doi:10.1073/pnas.1420508112/-/DCSupplemental.
References
- 1.Ivanov AI, Naydenov NG. Dynamics and regulation of epithelial adherens junctions: Recent discoveries and controversies. Int Rev Cell Mol Biol. 2013;303:27–99. doi: 10.1016/B978-0-12-407697-6.00002-7. [DOI] [PubMed] [Google Scholar]
- 2.Kowalczyk AP, Green KJ. Structure, function, and regulation of desmosomes. Prog Mol Biol Transl Sci. 2013;116:95–118. doi: 10.1016/B978-0-12-394311-8.00005-4. [DOI] [PMC free article] [PubMed] [Google Scholar]
- 3.Boggon TJ, et al. C-cadherin ectodomain structure and implications for cell adhesion mechanisms. Science. 2002;296(5571):1308–1313. doi: 10.1126/science.1071559. [DOI] [PubMed] [Google Scholar]
- 4.Taveau JC, et al. Structure of artificial and natural VE-cadherin-based adherens junctions. Biochem Soc Trans. 2008;36(Pt 2):189–193. doi: 10.1042/BST0360189. [DOI] [PMC free article] [PubMed] [Google Scholar]
- 5.Rayns DG, Simpson FO, Ledingham JM. Ultrastructure of desmosomes in mammalian intercalated disc; appearances after lanthanum treatment. J Cell Biol. 1969;42(1):322–326. doi: 10.1083/jcb.42.1.322. [DOI] [PMC free article] [PubMed] [Google Scholar]
- 6.Garrod DR, Berika MY, Bardsley WF, Holmes D, Tabernero L. Hyper-adhesion in desmosomes: Its regulation in wound healing and possible relationship to cadherin crystal structure. J Cell Sci. 2005;118(Pt 24):5743–5754. doi: 10.1242/jcs.02700. [DOI] [PubMed] [Google Scholar]
- 7.Kimura TE, Merritt AJ, Garrod DR. Calcium-independent desmosomes of keratinocytes are hyper-adhesive. J Invest Dermatol. 2007;127(4):775–781. doi: 10.1038/sj.jid.5700643. [DOI] [PubMed] [Google Scholar]
- 8.Wallis S, et al. The alpha isoform of protein kinase C is involved in signaling the response of desmosomes to wounding in cultured epithelial cells. Mol Biol Cell. 2000;11(3):1077–1092. doi: 10.1091/mbc.11.3.1077. [DOI] [PMC free article] [PubMed] [Google Scholar]
- 9.Kimura TE, et al. Desmosomal adhesiveness is developmentally regulated in the mouse embryo and modulated during trophectoderm migration. Dev Biol. 2012;369(2):286–297. doi: 10.1016/j.ydbio.2012.06.025. [DOI] [PubMed] [Google Scholar]
- 10.Al-Jassar C, Bikker H, Overduin M, Chidgey M. Mechanistic basis of desmosome-targeted diseases. J Mol Biol. 2013;425(21):4006–4022. doi: 10.1016/j.jmb.2013.07.035. [DOI] [PMC free article] [PubMed] [Google Scholar]
- 11.Schäfer S, Koch PJ, Franke WW. Identification of the ubiquitous human desmoglein, Dsg2, and the expression catalogue of the desmoglein subfamily of desmosomal cadherins. Exp Cell Res. 1994;211(2):391–399. doi: 10.1006/excr.1994.1103. [DOI] [PubMed] [Google Scholar]
- 12.Peitsch WK, et al. Desmoglein 2 depletion leads to increased migration and upregulation of the chemoattractant secretoneurin in melanoma cells. PLoS ONE. 2014;9(2):e89491. doi: 10.1371/journal.pone.0089491. [DOI] [PMC free article] [PubMed] [Google Scholar]
- 13.Bhuiyan ZA, et al. Desmoglein-2 and desmocollin-2 mutations in dutch arrhythmogenic right ventricular dysplasia/cardiomypathy patients: Results from a multicenter study. Circ Cardiovasc Genet. 2009;2(5):418–427. doi: 10.1161/CIRCGENETICS.108.839829. [DOI] [PubMed] [Google Scholar]
- 14.Al-Amoudi A, Díez DC, Betts MJ, Frangakis AS. The molecular architecture of cadherins in native epidermal desmosomes. Nature. 2007;450(7171):832–837. doi: 10.1038/nature05994. [DOI] [PubMed] [Google Scholar]
- 15.Nie Z, Merritt A, Rouhi-Parkouhi M, Tabernero L, Garrod D. Membrane-impermeable cross-linking provides evidence for homophilic, isoform-specific binding of desmosomal cadherins in epithelial cells. J Biol Chem. 2011;286(3):2143–2154. doi: 10.1074/jbc.M110.192245. [DOI] [PMC free article] [PubMed] [Google Scholar]
- 16.Konarev PV, Volkov VV, Sokolova AV, Koch MHJ, Svergun DI. PRIMUS: A Windows-PC based system for small-angle scattering data analysis. J Appl Cryst. 2003;36(5):1277–1282. [Google Scholar]
- 17.Svergun DI. Determination of the regularization parameter in indirect-transform methods using perceptual criteria. J Appl Cryst. 1992;25(4):495–503. [Google Scholar]
- 18.Svergun DI. Restoring low resolution structure of biological macromolecules from solution scattering using simulated annealing. Biophys J. 1999;76(6):2879–2886. doi: 10.1016/S0006-3495(99)77443-6. [DOI] [PMC free article] [PubMed] [Google Scholar]
- 19.Volkov VV, Svergun DI. Uniqueness of ab initio shape determination in small-angle scattering. J Appl Cryst. 2003;36(3):860–864. doi: 10.1107/S0021889809000338. [DOI] [PMC free article] [PubMed] [Google Scholar]
- 20.Bernadó P, Mylonas E, Petoukhov MV, Blackledge M, Svergun DI. Structural characterization of flexible proteins using small-angle X-ray scattering. J Am Chem Soc. 2007;129(17):5656–5664. doi: 10.1021/ja069124n. [DOI] [PubMed] [Google Scholar]
- 21.Brunger AT. Version 1.2 of the Crystallography and NMR system. Nat Protoc. 2007;2(11):2728–2733. doi: 10.1038/nprot.2007.406. [DOI] [PubMed] [Google Scholar]
- 22.Pelikan M, Hura GL, Hammel M. Structure and flexibility within proteins as identified through small angle X-ray scattering. Gen Physiol Biophys. 2009;28(2):174–189. doi: 10.4149/gpb_2009_02_174. [DOI] [PMC free article] [PubMed] [Google Scholar]
- 23. Schneidman-Duhovny D, Hammel M, Sali A (2010) FoXS: A web server for rapid computation and fitting of SAXS profiles. Nucleic Acids Res 38:W540–W544. [DOI] [PMC free article] [PubMed]
- 24.Harrison OJ, et al. The extracellular architecture of adherens junctions revealed by crystal structures of type I cadherins. Structure. 2011;19(2):244–256. doi: 10.1016/j.str.2010.11.016. [DOI] [PMC free article] [PubMed] [Google Scholar]
- 25.Yoshimasu MA, Tanaka T, Ahn JK, Yada RY. Effect of N-linked glycosylation on the aspartic proteinase porcine pepsin expressed from Pichia pastoris. Glycobiology. 2004;14(5):417–429. doi: 10.1093/glycob/cwh024. [DOI] [PubMed] [Google Scholar]
- 26.Shental-Bechor D, Levy Y. Effect of glycosylation on protein folding: A close look at thermodynamic stabilization. Proc Natl Acad Sci USA. 2008;105(24):8256–8261. doi: 10.1073/pnas.0801340105. [DOI] [PMC free article] [PubMed] [Google Scholar]
- 27.Solá RJ, Rodríguez-Martínez JA, Griebenow K. Modulation of protein biophysical properties by chemical glycosylation: Biochemical insights and biomedical implications. Cell Mol Life Sci. 2007;64(16):2133–2152. doi: 10.1007/s00018-007-6551-y. [DOI] [PMC free article] [PubMed] [Google Scholar]
- 28.Vester-Christensen MB, et al. Mining the O-mannose glycoproteome reveals cadherins as major O-mannosylated glycoproteins. Proc Natl Acad Sci USA. 2013;110(52):21018–21023. doi: 10.1073/pnas.1313446110. [DOI] [PMC free article] [PubMed] [Google Scholar]
- 29.Lommel M, et al. Protein O-mannosylation is crucial for E-cadherin-mediated cell adhesion. Proc Natl Acad Sci USA. 2013;110(52):21024–21029. doi: 10.1073/pnas.1316753110. [DOI] [PMC free article] [PubMed] [Google Scholar]
- 30.Ramachandran P, et al. Identification of N-linked glycoproteins in human saliva by glycoprotein capture and mass spectrometry. J Proteome Res. 2006;5(6):1493–1503. doi: 10.1021/pr050492k. [DOI] [PubMed] [Google Scholar]
- 31.Wollscheid B, et al. Mass-spectrometric identification and relative quantification of N-linked cell surface glycoproteins. Nat Biotechnol. 2009;27(4):378–386. doi: 10.1038/nbt.1532. [DOI] [PMC free article] [PubMed] [Google Scholar]
- 32.Pokutta S, Herrenknecht K, Kemler R, Engel J. Conformational changes of the recombinant extracellular domain of E-cadherin upon calcium binding. Eur J Biochem. 1994;223(3):1019–1026. doi: 10.1111/j.1432-1033.1994.tb19080.x. [DOI] [PubMed] [Google Scholar]
- 33.Nagar B, Overduin M, Ikura M, Rini JM. Structural basis of calcium-induced E-cadherin rigidification and dimerization. Nature. 1996;380(6572):360–364. doi: 10.1038/380360a0. [DOI] [PubMed] [Google Scholar]
- 34.Jin X, et al. Crystal structures of Drosophila N-cadherin ectodomain regions reveal a widely used class of Ca²+-free interdomain linkers. Proc Natl Acad Sci USA. 2012;109(3):E127–E134. doi: 10.1073/pnas.1117538108. [DOI] [PMC free article] [PubMed] [Google Scholar]
- 35.Chen CP, Posy S, Ben-Shaul A, Shapiro L, Honig BH. Specificity of cell-cell adhesion by classical cadherins: Critical role for low-affinity dimerization through beta-strand swapping. Proc Natl Acad Sci USA. 2005;102(24):8531–8536. doi: 10.1073/pnas.0503319102. [DOI] [PMC free article] [PubMed] [Google Scholar]
- 36.Posy S, Shapiro L, Honig B. Sequence and structural determinants of strand swapping in cadherin domains: Do all cadherins bind through the same adhesive interface? J Mol Biol. 2008;378(4):954–968. doi: 10.1016/j.jmb.2008.02.063. [DOI] [PMC free article] [PubMed] [Google Scholar]
- 37.Vendome J, et al. Molecular design principles underlying β-strand swapping in the adhesive dimerization of cadherins. Nat Struct Mol Biol. 2011;18(6):693–700. doi: 10.1038/nsmb.2051. [DOI] [PMC free article] [PubMed] [Google Scholar]
- 38.Harrison OJ, et al. Two-step adhesive binding by classical cadherins. Nat Struct Mol Biol. 2010;17(3):348–357. doi: 10.1038/nsmb.1784. [DOI] [PMC free article] [PubMed] [Google Scholar]
- 39.Koch AW, Pokutta S, Lustig A, Engel J. Calcium binding and homoassociation of E-cadherin domains. Biochemistry. 1997;36(25):7697–7705. doi: 10.1021/bi9705624. [DOI] [PubMed] [Google Scholar]
- 40.Pertz O, et al. A new crystal structure, Ca2+ dependence and mutational analysis reveal molecular details of E-cadherin homoassociation. EMBO J. 1999;18(7):1738–1747. doi: 10.1093/emboj/18.7.1738. [DOI] [PMC free article] [PubMed] [Google Scholar]
- 41.Häussinger D, et al. Calcium-dependent homoassociation of E-cadherin by NMR spectroscopy: Changes in mobility, conformation and mapping of contact regions. J Mol Biol. 2002;324(4):823–839. doi: 10.1016/s0022-2836(02)01137-3. [DOI] [PubMed] [Google Scholar]
- 42.Häussinger D, et al. Proteolytic E-cadherin activation followed by solution NMR and X-ray crystallography. EMBO J. 2004;23(8):1699–1708. doi: 10.1038/sj.emboj.7600192. [DOI] [PMC free article] [PubMed] [Google Scholar]
- 43.Miller K, Mattey D, Measures H, Hopkins C, Garrod D. Localisation of the protein and glycoprotein components of bovine nasal epithelial desmosomes by immunoelectron microscopy. EMBO J. 1987;6(4):885–889. doi: 10.1002/j.1460-2075.1987.tb04834.x. [DOI] [PMC free article] [PubMed] [Google Scholar]
- 44.North AJ, et al. Molecular map of the desmosomal plaque. J Cell Sci. 1999;112(Pt 23):4325–4336. doi: 10.1242/jcs.112.23.4325. [DOI] [PubMed] [Google Scholar]
- 45.Al-Amoudi A, et al. The three-dimensional molecular structure of the desmosomal plaque. Proc Natl Acad Sci USA. 2011;108(16):6480–6485. doi: 10.1073/pnas.1019469108. [DOI] [PMC free article] [PubMed] [Google Scholar]
- 46.Konarev PV, Petoukhov MV, Volkov VV, Svergun DI. ATSAS 2.1, a program package for small-angle scattering data analysis. J Appl Cryst. 2006;39(2):277–286. doi: 10.1107/S0021889812007662. [DOI] [PMC free article] [PubMed] [Google Scholar]
- 47.Rambo RP, Tainer JA. Characterizing flexible and intrinsically unstructured biological macromolecules by SAS using the Porod-Debye law. Biopolymers. 2011;95(8):559–571. doi: 10.1002/bip.21638. [DOI] [PMC free article] [PubMed] [Google Scholar]
- 48.Rai N, et al. SOMO (SOlution MOdeler) differences between X-Ray- and NMR-derived bead models suggest a role for side chain flexibility in protein hydrodynamics. Structure. 2005;13(5):723–734. doi: 10.1016/j.str.2005.02.012. [DOI] [PubMed] [Google Scholar]
- 49. The PyMOL Molecular Graphics System. Version 1.5.0.4. New York: Schrodinger, LLC.
- 50.Pettersen EF, et al. UCSF Chimera—a visualization system for exploratory research and analysis. J Comput Chem. 2004;25(13):1605–1612. doi: 10.1002/jcc.20084. [DOI] [PubMed] [Google Scholar]
Associated Data
This section collects any data citations, data availability statements, or supplementary materials included in this article.