

Significance
We present an analytical framework for understanding community-level vulnerability to tsunamis that integrates population exposure, demographic sensitivity, and evacuation potential.We identify three types of communities along the US Pacific Northwest coast that are directly threatened by tsunamis associated with a Cascadia subduction zone earthquake: (i) demographically diverse with low numbers of exposed people, (ii) high numbers of exposed populations but sufficient time to evacuate, and (iii) moderate numbers of exposed populations but insufficient time to evacuate. This approach is a significant advance over current practice because traditional measures of social vulnerability do not relate population structure to specific hazard characteristics. Results help managers to develop risk reduction strategies that are tailored to local conditions and needs.
Keywords: vulnerability, tsunami, evacuation, hazard, disaster
Abstract
Many coastal communities throughout the world are threatened by local (or near-field) tsunamis that could inundate low-lying areas in a matter of minutes after generation. Although the hazard and sustainability literature often frames vulnerability conceptually as a multidimensional issue involving exposure, sensitivity, and resilience to a hazard, assessments often focus on one element or do not recognize the hazard context. We introduce an analytical framework for describing variations in population vulnerability to tsunami hazards that integrates (i) geospatial approaches to identify the number and characteristics of people in hazard zones, (ii) anisotropic path distance models to estimate evacuation travel times to safety, and (iii) cluster analysis to classify communities with similar vulnerability. We demonstrate this approach by classifying 49 incorporated cities, 7 tribal reservations, and 17 counties from northern California to northern Washington that are directly threatened by tsunami waves associated with a Cascadia subduction zone earthquake. Results suggest three primary community groups: (i) relatively low numbers of exposed populations with varied demographic sensitivities, (ii) high numbers of exposed populations but sufficient time to evacuate before wave arrival, and (iii) moderate numbers of exposed populations but insufficient time to evacuate. Results can be used to enhance general hazard-awareness efforts with targeted interventions, such as education and outreach tailored to local demographics, evacuation training, and/or vertical evacuation refuges.
During the last decade, tsunamis have killed hundreds of thousands of people and destroyed coastal communities throughout the world (1). Geologic evidence of past events and geophysical models of potential sources suggest that many communities face substantial tsunami hazards. Although tsunami scenarios are often regional, local vulnerability varies because of how communities choose to use tsunami-prone areas, the types of people in hazard zones, the local conditions that enable or hinder evacuations, and the ability and willingness to mitigate threats.
The sustainability and hazards literature includes multiple efforts to conceptualize vulnerability, yet they share a common perspective that it is influenced by the exposure, sensitivity, and resilience of a system to a threat (2–5). Efforts to measure population vulnerability to tsunamis primarily have relied on indices that summarize population exposure (6), potential building damage (7), or institutional aspects of resilience (8). Indices also have been developed based on characteristics of people that make them more sensitive to hazards in general but are detached from a specific hazard context (9). These approaches are of limited utility to practitioners because they focus on individual components of vulnerability and inadequately capture the complex interactions between natural events and at-risk populations. For example, exposure to tsunamis should not be interpreted as a loss estimate given the potential for evacuations. Age as a vulnerability indicator for reasons related to mobility (2, 9) will likely have greater relevance for tsunamis requiring self-evacuations within minutes than they do for events with hours of warning.
To address these shortcomings, we developed an analytical approach for hazard-specific vulnerability assessment that considers population exposure, demographic sensitivity, and short-term resilience. This approach is an advance over traditional vulnerability measures because it relates compositional aspects of the population and landscape to the hazard. We focus on the tsunami threat posed by earthquakes associated with the Cascadia subduction zone (CSZ) in the US Pacific Northwest, where regional impacts could be analogous to those in Japan during the 2011 Tohoku disaster. Of all tsunami-prone areas in the United States, CSZ-related tsunamis represent one of the greatest threats to human safety (10) based on the regional extent of the source (∼1,000 km from northern California to Washington), the limited amount of time available for evacuations (15–-30 min for many communities), and the thousands of people that would need to self-evacuate (6, 11, 12).
The policy-relevant questions that drive this research are determining where loss of life is possible, what types of interventions could best serve at-risk populations, and what knowledge networks can be established to connect communities with similar issues. The work addresses the lack of pedestrian-evacuation studies to guide US tsunami risk-reduction efforts (10) by integrating geospatial and statistical methods, specifically demographic overlays to gauge exposure, anisotropic path distance models to estimate potential travel times to safety (13), and clustering algorithms (14) to segment coastal settlements into distinctive types. It deviates from current practices of developing indicators to rank geographic areas and instead focuses on the similarities and differences in community vulnerability. Community classification provides policymakers and practitioners with a framework for understanding vulnerability drivers and actionable information, as well as helps to minimize the reductionism and oversimplification involved in translating the multidimensional construct of vulnerability into a single index score.
Results
All coastal communities in the US Pacific Northwest are threatened to varying degrees by CSZ-related tsunami inundation. In this section, we first characterize community variations in population vulnerability separately in terms of exposure, demographic sensitivity, and short-term resilience of at-risk individuals to tsunamis and discuss how results from this approach may influence emergency management decisions. We then characterize population vulnerability as a combination of these factors and discuss the value of this holistic perspective.
Population Exposure.
We first classified communities in terms of exposure, here defined as the number of people and businesses in tsunami-hazard zones. This definition follows the vulnerability component of exposure described in Turner et al. (3) and Polsky et al. (4), but differs from others’ use of the term to describe physical characteristics of the hazard. We explicitly recognize hazard characteristics in the hazard zone delineation and in evacuation modeling assumptions.
The tsunami hazard zones in northern California, Oregon, and Washington that are associated with a CSZ earthquake contain 94,872 residents, 42,424 employees, 486 public venues, 440 dependent-care facilities, and 2,314 businesses with a significant customer presence. These at-risk populations and businesses are distributed unevenly across 49 incorporated cities, 7 tribal reservations, and 17 counties (Fig. 1), ranging from estimates of 1 resident in Coquille to 12,322 residents in Aberdeen (Fig. 2). The majority of at-risk populations are on the Washington coast; for example, 48% of the residents in the tsunami-hazard zone for the region are in Pacific and Grays Harbor Counties.
Fig. 1.

List of incorporated cities, Indian Reservations (IRs), and counties with land in tsunami hazard zones associated with CSZ earthquakes, arranged geographically north to south. Community classes and text colors refer to a statistical cluster analysis of population exposure, demographic sensitivity, and evacuation potential.
Fig. 2.
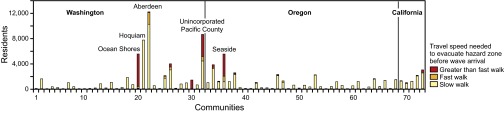
Number of residents, by community, in tsunami hazard zones associated with a CSZ earthquake. Community names are listed in Fig. 1. Cumulative bar graphs note the total number of residents that could evacuate assuming various travel speeds.
Cluster analysis suggests that there are three distinct community groups that characterize population exposure to CSZ tsunamis (Fig. 3A). The first group includes Aberdeen, Seaside, and Eureka. On average, members of this group are 2–4 SDs above the mean in terms of the number of residents, employees, public venues, dependent-care facilities, and community businesses in tsunami hazard zones. Communities in the second group are 1–2 SDs above the mean and include Crescent City, Hoquiam, Ocean Shores, Port Townsend, and the unincorporated portions of Grays Harbor and Pacific Counties. The second group differs from the first group in terms of higher percentages of residents in the tsunami hazard zone (29% of regional totals compared with 21%) but lower percentages of employees (21% compared with 42%) and dependent-care facilities (28% compared with 43%). The third group contains the remaining communities and counties, with relatively lower numbers of at-risk population across the five categories, although certain communities have high numbers of exposed populations in specific categories (e.g., 3,846 residents in Warrenton; 1,445 employees in Newport). If risk reduction efforts emphasized communities with the highest population exposure, then resources may be focused on the seven communities and two counties of the first two groups (Fig. 3A), which together account for 50% of the residents, 63% of the employees, 53% of the public venues, 71% of the dependent-care facilities, and 64% of the community businesses in tsunami hazard zones.
Fig. 3.
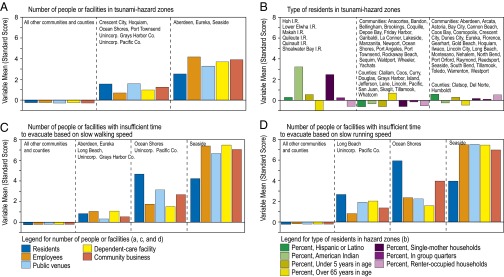
Community classifications based on cluster analyses of (A) the number of people or facilities in tsunami hazard zones, (B) the type of residents in tsunami hazard zones, (C) the number of people or facilities with insufficient time to evacuate based on a slow walking speed of 1.1 m/s, and (D) the number of people or facilities with insufficient time to evacuate based on a fast walking speed of 1.52 m/s. The bars in each chart represent the cluster’s average deviation from the mean for each variable used to determine the set of clusters.
Demographic Sensitivity.
We then characterized the sensitivity of communities based on the demographic characteristics of their exposed residential populations. Analysis was limited to commonly used demographic variables (2, 9) associated with block-level data in the 2010 US Census because of the small size of the hazard zone relative to larger census units. Geospatial analysis of census blocks identified the percentage of residents in the tsunami hazard zone for each jurisdiction with certain attributes of race and ethnicity, age, house structure, and tenancy. Cluster analysis of these data identified three primary community groupings. The first group (Fig. 3B) includes six tribal reservations in Washington (Hoh, Lower Elwa, Makah, Quileute, Quinault, and Shoalwater Bay), which predictably had higher percentages of American Indian or Alaska Native (ranging from 66% to 91%) compared with an average of 4% for the remaining communities in the study area. The percentage of single-mother households in the tsunami hazard zones of these communities was also high (ranging from 10% to 29%) compared with an average of 5% for the remaining communities. The percentage of residents greater than 65 y in age was relatively low (from 6% to 12%) compared with an average of 26% for the remaining communities. The other two community groupings (Fig. 3B) are distinguished by relatively minor differences in racial composition, housing tenure, and age. Basing risk reduction efforts on demographic differences may result in practitioners focusing on the needs of tribal communities (group 1), older residents (group 2), and renters and Hispanic or Latino populations (group 3).
Resilience.
Previous efforts to characterize resilience have focused largely on demographic and institutional characteristics (8). For local tsunami threats, the ability to reach higher ground before wave arrival is a critical aspect of population vulnerability to tsunami hazards in this region, and this can be conceived as short-term resilience. An individual has little to no resilience to survive a local tsunami if he or she must travel 15 km on foot in less than 15 min to reach high ground. Vertical evacuation in buildings may be an option for some but not all individuals, given the likelihood of destroyed or flooded structures (15). We do not consider vertical evacuation, given the lack of systematic studies across this region to gauge building performance to the CSZ earthquake and tsunami impacts.
Based on pedestrian evacuation models and assuming a slow walking speed of 1.1 m/s for evacuees, we estimate that there are 21,562 residents, 6,372 employees, 142 public venues, 50 dependent-care facilities, and 473 businesses with a significant customer presence in places where travel times out of hazard zones are greater than predicted wave arrival times. Washington contains the majority of the residents with insufficient time to evacuate (67%), followed by Oregon (29%) and California (4%), whereas Oregon has the majority of employees with insufficient time to evacuate (43%), followed by Washington (36%) and California (21%). Percentages of dependent-care facilities, public venues, and community businesses with insufficient travel time to safety vary only slightly in Washington (44–49%), Oregon (43–48%), and California (2–13%). Although Aberdeen has the highest number of residents in tsunami hazard zones, other communities, such as Seaside and Ocean Shores, have higher numbers of residents that may have insufficient time to evacuate before the arrival of the first tsunami waves (Fig. 2).
Cluster analysis suggests that there are four distinct community groups based on the number of at-risk individuals with insufficient time to evacuate (Fig. 3C). Seaside occupies a group by itself, representing the community with consistently the highest number of employees (2,435), public venues (51), dependent-care facilities (22), and community businesses (182). Ocean Shores and unincorporated Pacific County comprise a second group and differ from Seaside in terms of higher or comparable numbers of residents (5,491 and 4,272, respectively, compared with 4,450 in Seaside) but fewer employees and the suite of business types. A third group includes Aberdeen, Eureka, Long Beach, and unincorporated Grays Harbor County and are characterized by communities with relatively fewer individuals that would have insufficient time (e.g., magnitudes in the 1,000–2,000 range instead of the 2,000–6,000 range for residents). The fourth group includes all of the remaining communities and represents communities with fewer, if any, individuals that would have difficulty evacuating.
Another element of short-term resilience to tsunamis is an individual’s ability to move faster during an evacuation. To demonstrate where increased travel speeds may be the most effective in saving lives, we modeled travel times assuming a fast walking speed of 1.52 m/s (13). Using this new travel speed, we estimate that there are still 15,970 residents, 4,807 employees, 102 public venues, 36 dependent-care facilities, and 328 businesses with a significant customer presence in tsunami hazard zones where evacuation travel times to safety are greater than predicted wave arrival times. The majority of the residents (77%), employees (59%), and certain business types (71%) are in Ocean Shores, Seaside, and unincorporated Pacific County (Fig. 2). A cluster analysis (Fig. 3D) suggests that there are four distinct types of places: (i) Seaside, primarily due to large presence of employees and businesses; (ii) Ocean Shores, due to the high number of residents and community businesses; (iii) Long Beach and unincorporated Pacific County, due to the moderately high number of residents; and (iv) all of the remaining communities that have very few, if any, individuals that would have difficulty evacuating if traveling at a fast walking speed.
Evacuation-modeling results can be used for risk reduction efforts in two ways. Programs that include evacuation training may focus on Aberdeen and Eureka, which contain some of the highest numbers of individuals and businesses in tsunami hazard zones but most, if not all, may have sufficient time to evacuate (Fig. 2). Mitigation planners with resources to build vertical-evacuation refuges may instead focus on communities such as Ocean Shores, Seaside, Long Beach, and the unincorporated parts of Pacific County due to their high number of individuals and businesses that are in areas where travel times out of hazard zones exceed wave arrival time.
Comprehensive Clusters of Population Vulnerability.
A combined analysis was conducted to derive overall community clusters based on (i) the number of people and businesses in the tsunami hazard zone, (ii) the demographic characteristics of residents in the zone, (iii) the number of people and businesses that may have insufficient time to evacuate assuming a slow walking speed, and (iv) the number of people and businesses that may have insufficient time to evacuate assuming a fast walking speed. Results from this analysis indicate there are 3 primary community groupings and 11 secondary community groupings (Fig. 4). Group 1 includes the majority of the communities, which have relatively low numbers of residents, employees, or customer-heavy businesses in the tsunami hazard zones that will likely have sufficient time to reach high ground before tsunami wave arrival. The three secondary clusters in this group relate to variations in demographic characteristics; for example, group 1a has relatively higher percentages of Hispanic or Latino residents and renter-occupied households, group 1b represents relatively higher percentages of residents over 65 y in age, and group 1c represents the tribal reservations with relatively higher percentages of American Indian and single-mother households.
Fig. 4.
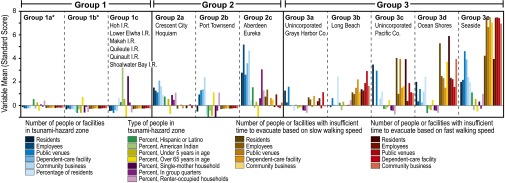
Communication classification based on a collective cluster analysis of the number of people or facilities in tsunami hazard zones, the type of residents in tsunami hazard zones, the number of people or facilities with insufficient time to evacuate based on a slow walking speed of 1.1 m/s and the number of people or facilities with insufficient time to evacuate based on a fast walking speed of 1.52 m/s. Communities in groups 1a and 1b (noted with asterisks) are identified in Fig. 1.
Group 2 includes five communities and is characterized by relatively high numbers of populations in tsunami hazard zones but in areas where successful evacuations are likely given a slow or fast walking speed (Fig. 4). Three secondary community groupings reflect variations in the number of exposed populations and their ability to successfully evacuate. Group 2a represents two communities (Crescent City and Hoquiam) with relatively high numbers of exposed populations but high likelihood of successful evacuations given the short distances to high ground. Group 2b (Port Townsend) is very similar to group 2a and varies by a higher number of community businesses in the hazard zone and relatively lower percentages of residents that are Hispanic or Latino, American Indian, younger than 5 y in age, and single-mother households. Group 2c represents two communities (Aberdeen and Eureka) that have very high numbers of exposed populations that may have difficulty evacuating everyone at a slow walking speed but may be successful at a fast walking speed.
Group 3 includes three communities and two counties (Fig. 4), which are characterized by moderately high numbers of exposed populations and businesses but in areas where successful evacuations are unlikely even at fast walking speeds. The primary distinction between secondary groupings is due to increasing numbers of individuals and businesses in areas where successful evacuations are unlikely even assuming a fast walking speed, ranging from unincorporated Grays Harbor County (group 3a) on the low end to Seaside (group 3e) on the high end of the spectrum. Although Seaside has the highest number of employees and certain business types in these areas, Ocean Shores and unincorporated Pacific County (groups 3d and 3c, respectively) have higher mean values for residents. This result suggests that population vulnerability is highest for residents in Ocean Shores and unincorporated Pacific County, but is highest for customers, dependent-care populations, tourists, and employees in Seaside.
Discussion
How to best reduce loss of life from future tsunamis is a complex question given the local vulnerability context and the multiple strategies that can be implemented. Although tsunami hazards are often characterized by practitioners as regional threats requiring a common response (e.g., move to high ground) with little acknowledgment of demographic considerations (10), our results identify three community groupings with distinct vulnerability issues (Figs. 1 and 4). Most of the communities (group 1) have people in tsunami hazard zones, but the magnitude of the exposed population is lower than other communities, and the populations may have sufficient time to evacuate before wave arrival. Successful evacuations are not guaranteed in these communities, because individuals still need to understand the threat, recognize signs of imminent waves, and take self-protective action. Education efforts that recognize demographic differences (e.g., age, race and ethnicity, and residents vs. tourists) may be the best course of action for these communities.
Tsunami education will be useful in group 2 communities (Fig. 4), but they could also benefit from evacuation training. Although Crescent City, Hoquiam, Port Townsend, Aberdeen, and Eureka have some of the highest numbers of individuals and businesses in tsunami hazard zones, at-risk individuals may have enough time to evacuate, especially if they had additional training on where and on how fast they may need to go to reach high ground. For example, the percentage of Aberdeen residents in the tsunami hazard zone that may have sufficient time to evacuate rises to 99% if some individuals move at a fast walking speed.
Group 3 communities (Fig. 4) may warrant consideration of vertical evacuation refuges to create safe havens, because at-risk populations may not have enough time to evacuate even at a fast walking speed. Within each group 3 community, there are likely to be multiple sites that could provide refuge, and each may provide benefits to different population groups (16).
Our results show how recognizing the variations in population exposure, demographic sensitivity, and resilience for evacuations provides advantages over existing rank-based indices that focus individually on population exposure inventories or demographic sensitivity. An emphasis on the number of individuals in hazard zones would lead policymakers to focus on group 2 communities. A focus on demographic attributes alone would lead them to focus on education efforts in communities with few people in the tsunami hazard (group 1) or in communities where successful evacuations are unlikely (group 3). An emphasis on community rankings may lead practitioners and the media to focus on communities such as Seaside and Ocean Shores and unintentionally ignore or at least downplay the other communities.
An integrated treatment of vulnerability places societal issues in a risk reduction context and provides practitioners and policymakers with actionable information for community specific interventions. However, rather than simply saying “places are different and have unique needs,” our approach identifies shared risks in a way that allows for the development of knowledge networks between communities with similar issues. To leverage limited funds, public officials in one community could learn from case studies conducted in communities with similar issues or possibly work together to seek out mutually beneficial projects. For example, Seaside (OR) may have more in common with Ocean Shores (WA) because of similar evacuation challenges than neighboring communities in Oregon (Figs. 1 and 4). Officials in Aberdeen (WA) and Eureka (CA) may also find common ground in tsunami vulnerability issues. An international knowledge network of communities could provide opportunities for direct learning of effective mitigation and preparedness, response during actual disasters, and postdisaster recovery.
We hope our analysis will broaden the discussion of how communities vary in their vulnerability to sudden-onset hazards and how results can be used to develop effective risk reduction efforts. Further research should consider variations in evacuation behavior, response capabilities of at-risk individuals, the reliability of evacuation routes, and the sensitivity of the clustering modeling. Future clustering analysis could be a practitioner-driven process constructed around specific risk reduction options and/or hierarchical to provide additional nuance, as opposed to our approach that assumed no a priori knowledge of the communities or strategies. The clear mitigation-based groupings did not drive our cluster analysis, but rather serve as evidence for the utility of the approach. This observation may not be as clearly evident in other studies. Despite these limitations, our results demonstrate the highly variable nature of community vulnerability to tsunami hazards. Given the multidimensional nature of community vulnerability to natural hazards, we contend that typologies of vulnerability provide a richer characterization to practitioners and policymakers than rank-based indices.
Although we focused on deterministic hazards and current population distributions, the approach has utility for characterizing population vulnerability to probabilistic hazards, as well as incorporating changes in population distributions and landscapes over time. Variables to represent exposure, sensitivity, and resilience may be similar for other sudden-onset hazards that require pedestrian evacuation (e.g., volcanic lahars, flash floods) but could vary for other hazards. For example, short-term resilience variables may emphasize vehicular evacuation potential for hurricanes or institutional capacity for contending with chronic coastal hazards or drought conditions.
Materials and Methods
Our analysis focused on inventorying the number and characteristics of individuals in tsunami-hazard zones, modeling evacuation travel times to safety, and classifying communities with similar vulnerability attributes. We discuss here the various elements required to compile such estimates.
Tsunami Hazard Delineation.
State agencies vary somewhat in how they have delineated tsunami hazard zones associated with CSZ earthquakes; therefore, we used published zones that have similar source and modeling assumptions. Tsunami hazard zones in Oregon and in Whatcom, Skagit, Island, and San Juan counties (WA) reflect an Mw 9.0 earthquake with source parameters of the LI scenario, a deterministic scenario assuming 650–800 y of slip accumulation and a 95% CI (17). In Pacific and Grays Harbor counties, the hazard zone is based on a combination of the L1 source parameters and earlier work associated with the 1A with asperity deterministic scenario for an Mw 9.1 earthquake that assumes 450 y of slip accumulation (18). In Clallam and Jefferson counties, hazard zones in populated areas are based on the 1A with asperity scenario (19), and the undeveloped areas reflect a 25-ft contour line (11). For the two California counties, we used the statewide maximum tsunami hazard zone (20, 21), which is considered to be similar to the L1 CSZ scenario (21). Estimated arrival time of the first tsunami wave varies across the study area but is assumed to be 15 min in California and Oregon (17), 25 min for the open ocean coast of Washington (18), 45 min along the Strait of Juan de Fuca (19, 22–24), 2 h for Skagit County in Washington (25), and 2.5 h for Whatcom County, WA (26).
Unit of Comparison.
Comparative analyses focused on incorporated cities, tribal boundaries, and the remaining land in the various counties, as delineated in the 2010 US Census (27).
Population Demography.
Residential distributions were generated by disaggregating population counts in 2010 Census block data (27) to residence points manually interpreted in 1-m resolution, red-green-blue (RGB)-band orthorectified imagery taken between 2009 and 2012 (28). Demographic factors, such as age, ethnicity, and tenancy, can amplify an individual’s sensitivity to hazards and reduce their ability to respond (9, 29). For the residents in the tsunami zones of each community, we inventoried demographic attributes available at the census-block level and related to ethnicity (Hispanic or Latino), race (American Indian and Alaska Native, Asian, black or African American, Native Hawaiian and other Pacific Islander, and white), age (individuals <5 and >65 y in age), sex based on particular family structures (female-headed households with children under 18 y of age and no spouse present), and tenancy (group quarters and renter-occupied households). Some attributes were excluded from the statistical cluster analysis because they demonstrated low variability (white) or low percentages of the exposed population in communities (Asian, black or African American, and Native Hawaiian and other Pacific Islander). The percentage of a community’s residents in the hazards zone is also calculated to determine the scope of disruption to the community that could result from a tsunami. Employee locations and counts were identified using the 2012 Infogroup Employer Database (30). The North American Industrial Classification System (NAICS) codes in this database were used to identify community support businesses (e.g., banks, government offices, grocery stores, and religious organizations), dependent-care facilities (e.g., child and elderly services, schools, and medical facilities), and public venues (e.g., accommodations and outdoor venues).
Pedestrian Evacuation Modeling.
Vehicular evacuations are not evaluated due to the probable earthquake damage to roads (15). Pedestrian travel times to safety are based on an anisotropic, path distance model that focuses on the slope and land cover of an area to calculate the most efficient paths on foot to safety from every location in a hazard zone (13). Difficulty of traveling through each location is represented as a cost in terms of increased travel time. Anisotropy incorporates direction of travel and path distance calculates distances and slopes between cells of varying elevations. Land cover and elevation derived slope data are transformed into speed conservation values (SCVs) and represent the proportion of maximum travel speeds that are expected on areas with given conditions. Slope SCVs are based on Tobler’s hiking function (31), and slopes were derived from 1-m resolution elevation data (32), except for less-populated portions of Washington in which coarser data, such as 3- and 10-m National Elevation Dataset data, were used. Land cover SCVs are based on Soule and Goldman’s (33) energy cost terrain coefficients for certain land cover types, and land cover was derived from a supervised and manual classification of the previously described imagery (28). Cost surfaces that integrate land cover and slope variability are converted to maps of pedestrian travel times using travel speed assumptions of a slow walk and fast walk (1.1 and 1.52 m/s, respectively) (34).
Cluster Analysis.
Cluster analysis is a statistical procedure based on the assumption that each community belongs to a class, but that the class membership is unobserved and unknown. Class memberships were estimated using the K-means algorithm in the R statistical computing language version 3.0.1 (14). Independent models were run for the demographic, exposure, and short-term resilience variables. For each model, solutions with a number of output classes (K) set between 2 and 10 were estimated, with 1,000 random initializations for each setting of K. For each set of variables, a combination of manual inspection and statistical criteria (i.e., within and between cluster sum of squares) were used to select a final model. The combined classification combines the class assignments for demographic, exposure, and short-term resilience variables.
Acknowledgments
We thank Mara Tongue, Dr. Tim Frazier, and two anonymous reviewers for insightful reviews of earlier versions of the article. This research was supported by the US Geological Survey Land Change Science Program and National Science Foundation Award 1333271.
Footnotes
The authors declare no conflict of interest.
This article is a PNAS Direct Submission.
References
- 1. National Geophysical Data Center/World Data Service for Geophysics (2013) Global historical tsunami database. Available at www.ngdc.noaa.gov/hazard/tsu_db.shtml. Accessed December 29, 2013.
- 2.Clark G, et al. Assessing the vulnerability of coastal communities to extreme storms: the case of Revere, MA, USA. Mitig Adapt Strategies Glob Change. 1998;3(1):59–82. [Google Scholar]
- 3.Turner BL, 2nd, et al. A framework for vulnerability analysis in sustainability science. Proc Natl Acad Sci USA. 2003;100(14):8074–8079. doi: 10.1073/pnas.1231335100. [DOI] [PMC free article] [PubMed] [Google Scholar]
- 4.Polsky C, Neff R, Yarnal B. Building comparable global change vulnerability assessments: The vulnerability scoping diagram. Glob Environ Change. 2007;17(3/4):472–485. [Google Scholar]
- 5.Birkmann J, et al. Framing vulnerability, risk and societal responses–the MOVE framework. Nat Hazards. 2013;67(2):193–211. [Google Scholar]
- 6.Wood N. 2007. Variations in community exposure and sensitivity to tsunami hazards in Oregon. USGS Scientific Investigations Report 2007-5283 (USGS, Reston, VA)
- 7.Dominey-Howes D, et al. Estimating probable maximum loss from a Cascadia tsunami. Nat Hazards. 2010;53(1):43–61. [Google Scholar]
- 8. US Indian Ocean Tsunami Warning System Program (2007) How resilient is your coastal community? A guide for evaluating coastal community resilience to tsunamis and other coastal hazards. US Indian Ocean Tsunami Warning System No. 27-IOTWS-07 (United States Agency for International Development, Bangkok, Thailand)
- 9.Cutter S, Boruff B, Shirley W. Social vulnerability to environmental hazards. Soc Sci Q. 2003;4(1):242–261. [Google Scholar]
- 10.National Research Council . Tsunami Warning and Preparedness: An Assessment of the US Tsunami Program and the Nation’s Preparedness Efforts. Committee on the Review of the Tsunami Warning and Forecast System and Overview of the Nation’s Tsunami Preparedness. National Research Council; Washington, DC: 2011. [Google Scholar]
- 11.Wood N, Soulard C. USGS Scientific Investigations Report 2008-5004. USGS; Reston, VA: 2008. Variations in community exposure and sensitivity to tsunami Hazards on the open-ocean and Strait of Juan de Fuca coasts of Washington. [Google Scholar]
- 12.Wood N, Ratliff J, Peters J. 2012. Community exposure to tsunami hazards in California. USGS Scientific Investigations Report 2012-5222 (USGS, Reston, VA)
- 13.Wood N, Schmidtlein M. Community variations in population exposure to near-field tsunami hazards as a function of pedestrian travel time to safety. Nat Hazards. 2013;65(3):1603–1628. [Google Scholar]
- 14.Hartigan J, Wong M. A K-means clustering algorithm. Appl Stat. 1979;28:100–108. [Google Scholar]
- 15.Cascadia Region Earthquake Workgroup . Cascadia Subduction Zone Earthquakes—A Magnitude 9.0 Earthquake Scenario. Oregon Dept of Geology and Mineral Industries; Portland, OR: 2013. [Google Scholar]
- 16.Wood N, Jones J, Schelling J, Schmidtlein M. Tsunami vertical-evacuation planning in the U.S. Pacific Northwest as a geospatial, multi-criteria decision problem. Int J of Disaster Risk Reduction. 2014;9:68–83. [Google Scholar]
- 17.Priest G, et al. 2013. Tsunami inundation scenarios for Oregon. Oregon Department of Geology Mineral Industries Open-File Report O-13-19 (Oregon Department of Geology Mineral Industries, Portland, OR)
- 18.Walsh T, et al. 2000. Tsunami hazard map of the southern Washington coast: Olympia, Wash. Washington Department of Natural Resources Geologic Map GM-49 (Washington Department of Natural Resources, Olympia, WA)
- 19.Walsh T, Myers E, III, Baptista A. 2002a. Tsunami inundation map of the Port Angeles, Washington area: Olympia, Wash. Washington Department of Natural Resources Open File Report 2002-1 (Washington Department of Natural Resources, Olympia, WA)
- 20. State of California (2009) Tsunami inundation map. Available at www.conservation.ca.gov/cgs/geologic_hazards/Tsunami/Inundation_Maps/Pages/Statewide_Maps.aspx. Accessed August 14, 2014.
- 21.Wilson R, et al. 2010. Development of new databases for tsunami hazard analysis in California. USGS Open-File Report 2010-1152 (USGS, Reston, VA)
- 22.Walsh T, Myers E, III, Baptista A. 2002b. Tsunami inundation map of the Port Townsend, Washington area: Olympia, Wash. Washington Department of Natural Resources, Open File Report 2002-2 (Washington Department of Natural Resources, Olympia, WA)
- 23.Walsh T, Myers E, III, Baptista A. 2003a. Tsunami inundation map of the Quileute, Washington area: Olympia, Wash. Washington Department of Natural Resources, Open File Report 2003-1 (Washington Department of Natural Resources, Olympia, WA)
- 24.Walsh T, Myers E, III, Baptista A. 2003b. Tsunami inundation map of the Neah Bay, Washington area: Olympia, Wash. Washington Department of Natural Resources, Open File Report 2003-2 (Washington Department of Natural Resources, Olympia, WA)
- 25.Walsh T, et al. 2004. Tsunami hazard map of the Anacortes-Whidbey area, Washington. Washington Department of Natural Resources, Open File Report 2005-1 (Washington Department of Natural Resources, Olympia, WA)
- 26.Walsh T, et al. 2004. Tsunami hazard map of the Bellingham area, Washington. Washington Department of Natural Resources, Open File Report 2004-15 (Washington Department of Natural Resources, Olympia, WA)
- 27. US Census Bureau (2011) American FactFinder. Available at factfinder2.census.gov/faces/nav/jsf/pages/index.xhtml. Accessed May 1, 2011.
- 28. US Department of Agriculture (2014) Geospatial data gateway. Available at datagateway.nrcs.usda.gov/. Accessed April 1, 2014.
- 29.Heinz Center . Human Links to Coastal Disasters. The H. John Heinz III Center for Science, Economics and the Environment; Washington, DC: 2002. [Google Scholar]
- 30. Infogroup (2012) Employer database. Available at www.infousagov.com/employer.asp. Accessed October 1, 2012.
- 31.Tobler W. 1993 Three presentations on geographical analysis and modeling—Non-isotropic geographic modeling. Speculations on the geometry of geography; and global spatial analysis. UCSB. National Center for Geographic Information and Analysis Technical Report 93-1. Available at www.ncgia.ucsb.edu/Publications/Tech_Reports/93/93-1.PDF. Accessed October 1, 2012.
- 32. WatershedSciences (2010) LIDAR remote sensing data collection. Available at pugetsoundlidar.ess.washington.edu/. Accessed August 7, 2013.
- 33.Soule RG, Goldman RF. Terrain coefficients for energy cost prediction. J Appl Physiol. 1972;32(5):706–708. doi: 10.1152/jappl.1972.32.5.706. [DOI] [PubMed] [Google Scholar]
- 34.US Department of Transportation . Manual on Uniform Traffic Control Devices for Streets and Highways. Federal Highway Administration; Washington, DC: 2009. [Google Scholar]