
Fig. 2.
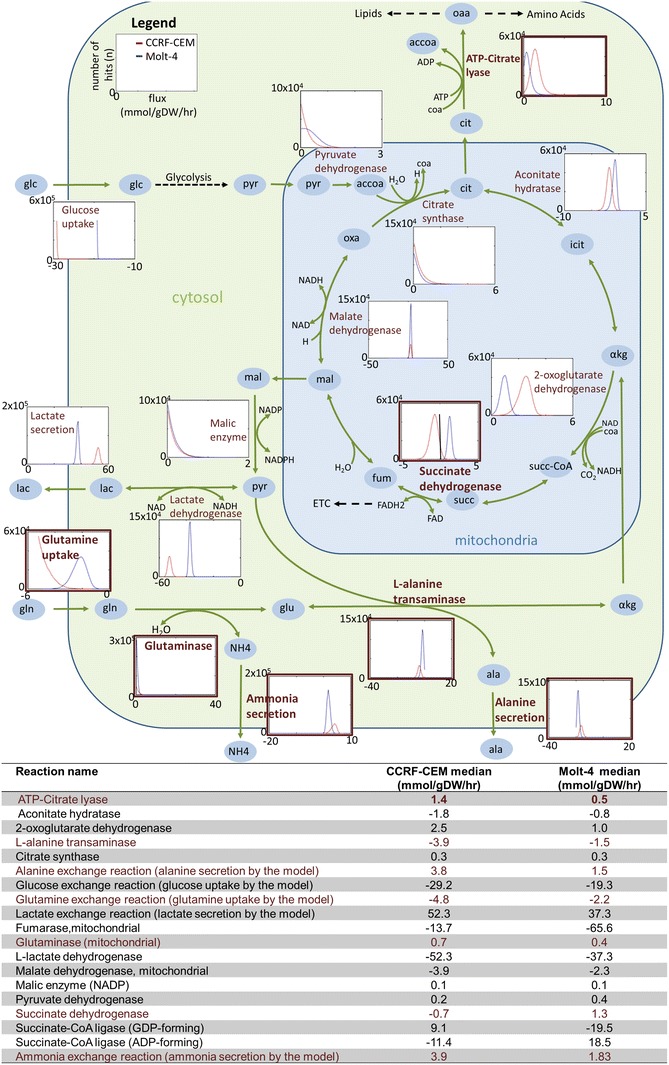
Differences in the use of the TCA cycle by the CCRF-CEM model (red) and the Molt-4 model (blue). The table provides the median values of the sampling results. Negative values in histograms and in the table describe reversible reactions with flux in the reverse direction. There are multiple reversible reactions for the transformation of isocitrate and α-ketoglutarate, malate and fumarate, and succinyl-CoA and succinate. These reactions are unbounded, and therefore histograms are not shown. The details of participating cofactors have been removed. Atp ATP, cit citrate, adp ADP, pi phosphate, oaa oxaloacetate, accoa acetyl-CoA, coa coenzyme-A, icit isocitrate, αkg α-ketoglutarate, succ-coa succinyl-CoA, succ succinate, fum fumarate, mal malate, oxa oxaloacetate, pyr pyruvate, lac lactate, ala alanine, gln glutamine, ETC electron transport chain