Fig. 6.
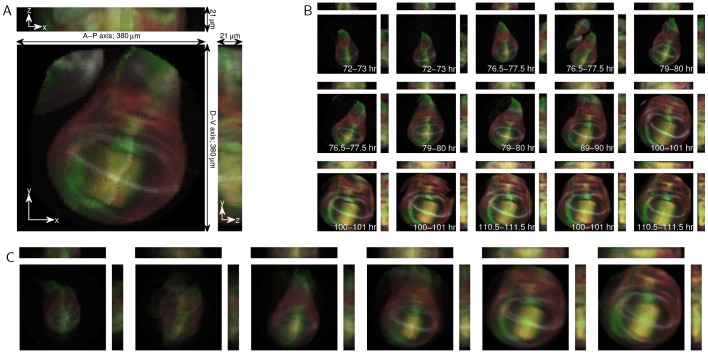
Analysis of 3D Drosophila wing disc z-stacks. (A) Maximum projections of an example 3D Drosophila wing disc z-stack. The anterior-posterior (A-P) and dorsal-ventral (D-V) axes are indicated. Discs express the Dad-GFP reporter construct (green) and are stained for Spalt (red), Wingless (gray) and Patched (gray). Projections along the x, y and z axes are shown. (B) Example 3D images, ordered using diffusion maps. The time cohort, as assessed by an expert, is indicated for each image, and the rank correlation coefficient between the diffusion maps ordering and the expert timing is 0.9427. (C) The average developmental trajectory for the registered and ordered images.

