

Abstract
Attending to a feature enhances visual processing of that feature, but it is less clear what occurs to unattended features. Single-unit recording studies in middle temporal (MT) have shown that neuronal modulation is a monotonic function of the difference between the attended and neuron's preferred direction. Such a relationship should predict a monotonic suppressive effect in psychophysical performance. However, past research on suppressive effects of feature-based attention has remained inconclusive. We investigated the suppressive effect for motion direction, orientation, and color in three experiments. We asked participants to detect a weak signal among noise and provided a partially valid feature cue to manipulate attention. We measured performance as a function of the offset between the cued and signal feature. We also included neutral trials where no feature cues were presented to provide a baseline measure of performance. Across three experiments, we consistently observed enhancement effects when the target feature and cued feature coincided and suppression effects when the target feature deviated from the cued feature. The exact profile of suppression was different across feature dimensions: Whereas the profile for direction exhibited a “rebound” effect, the profiles for orientation and color were monotonic. These results demonstrate that unattended features are suppressed during feature-based attention, but the exact suppression profile depends on the specific feature. Overall, the results are largely consistent with neurophysiological data and support the feature-similarity gain model of attention.
Keywords: attention, feature, suppression
Introduction
Selective attention prioritizes the processing of a small portion of information from the vast amount of information that impinges on the visual system. The effects of attention have been extensively studied at both the behavioral and physiological levels, particularly for spatial attention (for reviews see Carrasco, 2011; Kastner & Ungerleider, 2000; Reynolds & Chelazzi, 2004). However, attention can also select specific features (e.g., red color, rightward motion), even when different features occupy the same spatial location (Scolari, Ester, & Serences, 2014; Maunsell & Treue, 2006). In this study, we focus on the perceptual effects of feature-based attention, and in particular, how attention affects the representation of visual features.
This question has been directly assessed in single-unit recording studies where monkey subjects attended to directions of motion while neuronal activity in the motion sensitive area, MT, was measured (Martinez-Trujillo & Treue, 2004; Treue, & Martinez-Trujillo, 1999). These authors found that attending to a direction enhanced activity for neurons preferring similar directions, while it suppressed activity for neurons preferring dissimilar directions, essentially giving rise to a sharpened population activity for the attended feature. This finding has led to the influential feature-similarity gain model of attention, which maintains that the amount of neuronal modulation depends on the similarity between the attended feature and the neuron's preferred feature. Many studies in humans, using both neuroimaging and psychophysics, have found results consistent with feature-similarity gain model (Arman, Ciaramitaro, & Boynton, 2006; Bondarenko et al., 2012; Lankheet & Vestraten, 1995; Liu & Hou, 2011; Liu, Larsson, & Carrasco, 2007; Liu & Mance, 2011; Saenz, Buracas, & Boynton, 2002, 2003; Serences & Boynton, 2007; White & Carrasco, 2011; Zhang & Luck, 2008). However, these studies typically employed only two feature values (e.g., upward vs. downward motion, vertical vs. horizontal orientation) and assessed the effect of attention by comparing the attended versus unattended feature. As such, these studies did not permit a systematic assessment of the profile of attentional modulation within a feature dimension.
A basic prediction from the neurophysiological data (Khayat, Neibergall, & Martinez-Trujillo, 2010; Martinez-Trujillo & Treue, 2004; Treue & Martinez-Trujillo, 1999) is that as stimulus features deviate more from the attended feature, their representations are monotonically modulated such that similar features are enhanced and dissimilar features are suppressed. This prediction has received limited investigation in the literature. Two studies, one testing orientation (Tombu & Tsotsos, 2008) and one testing motion direction (Ho, Brown, Abuyo, Ku, & Serences, 2012) have found nonmonotonic modulation of feature processing, inconsistent with this prediction. For both direction and orientation, these authors found the highest performance for the attended feature, with decreasing performance as the feature deviated more from the attended feature, but a “rebound” effect such that the most dissimilar feature (orthogonal orientation and opposite direction) exhibited a relative increase in performance. These studies used different designs and tasks to measure the effect of attention. Furthermore, certain elements in the design and data of these studies limited the inferences drawn from their results. For example, Tombu and Tsotsos (2008) did not include a neutral condition, so it is difficult to assess enhancement versus suppression, whereas Ho et al. (2012) used a visual search task that likely involved shifts of spatial attention, which could confound the interpretation of their results. We will present more in-depth discussions of these studies in the General discussion.
Our goal here is to measure the modulation profile due to feature-based attention, for both the direction and orientation features. In addition, we also examined the modulation profile for color, an important visual feature but with little systematic investigation in terms of how attention affects its perceptual representation. We used the same task for all three features, in a design that maximized our ability to detect modulations of the sensory representations of these features. Our results showed clear suppression effects for all features that were largely consistent with the predictions of the feature-similarity gain model.
Experiment 1: Attention to direction of motion
In the first experiment, we tested the effect of feature-based attention to directions of motion. Participants were cued to attend to a particular direction and detected a coherent motion signal that could move in various directions. This allowed us to assess how attention modulates direction-selective mechanisms during motion detection.
Methods
Participants
A total of six observers participated in this experiment. All of them were graduate and undergraduate students at Michigan State University and were naive as to the purpose of the experiment. All participants had normal or corrected-to-normal vision. Participants gave informed consent and were compensated at the rate of $10/hr. All experimental protocols were approved by the Institutional Review Board at Michigan State University.
Visual stimuli
Visual stimuli were generated using MGL (http://justingardner.net/mgl), a set of OpenGL libraries running in Matlab (Mathworks, Natick, MA). We used the random dot motion stimulus, which was based on classic studies in neurophysiology (Newsome & Pare, 1988). The motion stimulus consisted of white moving dots (size: 0.05°) in a circular aperture (6°), presented on a dark background. The circular aperture was centered on the fixation point (white, size: 0.3°), which was surrounded by a small occluding region (0.7°) of the background luminance such that no dots would appear too close to the fixation point. The dots were plotted in three interleaved sets of equal number, with an effective density of 16.8 dots/deg2/s and a speed of 4°/s. Each single dot was presented on the screen for one video frame (life time = 16.7 ms). Importantly, only a portion of dots moved in a particular direction between frames, while the rest of the dots were redrawn in random locations. The stimuli were presented on a 19-in. CRT monitor refreshed at 60 Hz and set at a resolution of 1024 × 768. Observers were stabilized with a chinrest and viewed the display from a distance of 57 cm in a dark room.
Task and procedures: Training
We first trained all observers to familiarize them with the task, until their performance stabilized so that we could choose appropriate stimulus levels for the attention task (see below). Observers detected the presence of coherent motion in a two-interval forced choice (2-IFC) (Figure 1). Each trial started with a 0.5-s fixation interval, then a 0.7-s blank interval, after which two intervals of random dot motion stimuli were shown, each for 0.3 s, and separated by 0.7 s, and finally followed by a 0.5-s feedback interval after the responses. One interval always contained 0% coherent motion (noise) while the other interval contained a motion stimulus at one of seven coherence levels: 2%, 4%, 8%, 16%, 32%, 64%, and 96% (signal), via the method of constant stimuli. The presentation order of the signal and noise interval was randomized. Observers were instructed to judge which interval contained the coherent motion signal by pressing the 1 or 2 key on the numeric keypad of a standard computer keyboard. A sound was played for incorrect interval judgments after observer pressed the key. An intertrial interval of 1.5 s then followed.
Figure 1.
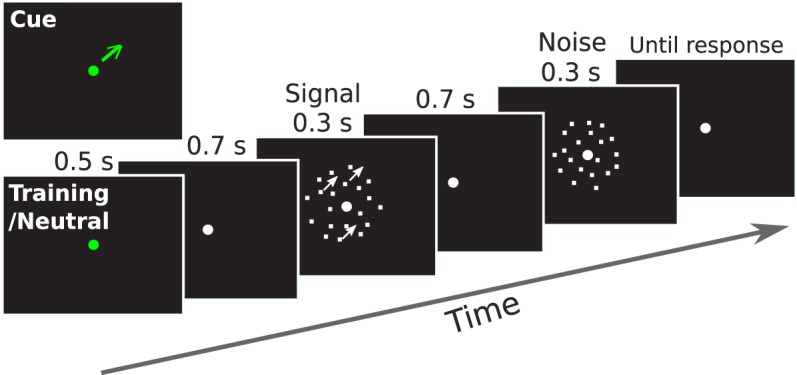
Schematic of a trial in Experiment 1. Observers detected the presence of coherent motion in a 2-IFC task.
We fit the proportion of correct data with a Weibull function using maximum-likelihood estimation, as implemented in psignifit (Wichmann & Hill, 2001; see Figure 2A for an example fit). We defined threshold as the coherence level corresponding to ∼65% correct in the 2-IFC task. Observers performed the motion detection task in 48-trial blocks until their coherence threshold did not show a sizeable drop in consecutive four-block units. On average, the practice session was 27 blocks long (i.e., 1,296 trials), with a range of 18–30 blocks across observers. The training task was divided into three to four sessions, each lasting about 60 min.
Figure 2.
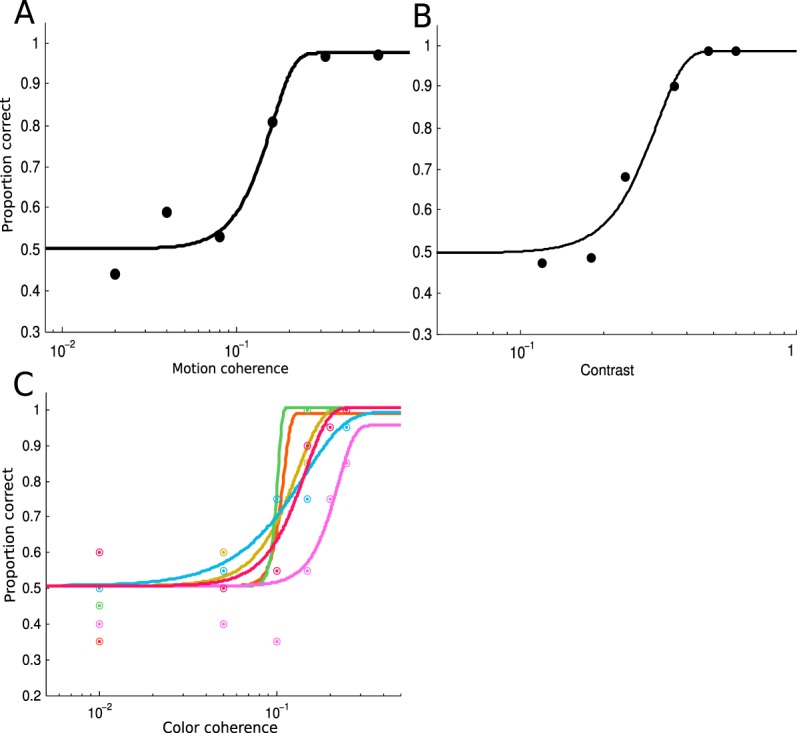
Threshold data from the training sessions of the three experiments. Data from a representative subject from each experiment is plotted. Solid lines are Weibull fits of the psychometric functions. (A) Threshold data from Experiment 1. (B) Threshold data from Experiment 2. (C) Threshold data from Experiment 3, in which we separately measured threshold for each of the six colors, coded by the color of the symbols and lines (see Figure 6B). Threshold data are noisier in the color experiment, presumably due to a smaller number of trials per color.
Task and procedures: Attention
The attention task was similar to the training task, except we introduced a cueing and validity manipulation (Figure 1). The strength of the motion signal was determined by data in the training sessions. At the beginning of each trial in the cued blocks, an arrow cue appeared for 0.5 s (length: 0.3°, center 0.65° to the fixation). This cue accurately indicated the direction of the signal on 69% of the trials. In the remaining 31% of trials, the invalid trials, the signal moved in a different direction from the cued direction, with the difference set to one of the 12 possible offset values (±30°, ±60°, ±90°, ±120°, ±150°, ±180°). On each trial, the cue's direction was randomly sampled from 120 possible directions ranging from 0° to 357° (step size: 3°). Observers were instructed to attend to the cued direction, as it would help them to detect the motion signal. We also ran the neutral (no-cue) condition in separate blocks, in which the fixation dot turned green to indicate the impending motion stimuli. Signal direction in the neutral trials was randomly sampled from the same 120 possible directions as in the cued trials. In both the cued and neutral condition, observers were instructed to report which interval contained the coherent motion signal by pressing the 1 or 2 key on the numeric keypad. There was no feedback at the end of the trial during the attention task.
Each session consisted of four blocks, with one neutral block and three cued blocks. The order of these blocks was randomized for each session. The neutral block contained 40 trials and cued blocks contained 50 trials, and each observer completed five sessions. In total, each observer completed 200 neutral trials and 750 cued trials, which was composed of ∼520 valid trials and ∼19 invalid trials in each target offset (∼38 trials when collapsed across the sign of the offset, see Results below).
Results and discussion
The average coherence threshold was 0.10 (SD = 0.02) as determined in the training sessions (see Methods). We calculated accuracy as a function of the offset between the cue and signal direction (a signal detection analysis using d′ as the performance measure produced very similar results in this and subsequent experiments). Since the clockwise and counterclockwise offsets showed similar results, we collapsed across the sign of the offset to produce six offset levels (30°, 60°, 90°, 120°, 150°, 180°). Average performance showed a U-shaped function (Figure 3). Figure 3 also shows performance in the neutral condition (dashed horizontal line), when participants had no expectation of the signal direction. We used the neutral condition to assess attentional effect—a higher-than-neutral performance would indicate attentional enhancement and a lower-than-neutral performance would indicate attentional suppression. The U-shaped function crossed the neutral performance level, showing both enhancement and suppression due to feature-based attention. At the individual level, we found five out of six participants who showed the U-shaped function. Compared to the neutral performance, valid cues (0° offset) yielded significantly higher accuracy, t0°(5) = 6.53, p < 0.01, demonstrating an enhancement. The invalid cues produced significantly lower accuracies in 60°, 90°, 120°, and 150° offset conditions, t60°(5) = 4.55, p < 0.01; t90°(5) = 3.04, p < 0.05; t120°(5) = 4.54, p < 0.01; t150°(5) = 2.58, p < 0.05, but not in 30° and 180° offset conditions, t30°(5) = 0.04, p = 0.97; t180°(5) = 0.22, p = 0.83. To further characterize the shape of the modulation function, we fit the average cued data with both a linear and a quadratic function. In addition, we also fit the same data with a linear function with an intercept but zero slope. We refer to this function as “no-modulation fit,” as it describes a scenario where performance is not affected by the cueing manipulation. We then compared the fits using Bayesian Information Criterion (BIC), and found a quadratic fit to be a better description of the data than a linear fit (Bayes factor = 2.76 × 10³) and the no-modulation fit (Bayes factor = 3.07 × 10³).
Figure 3.
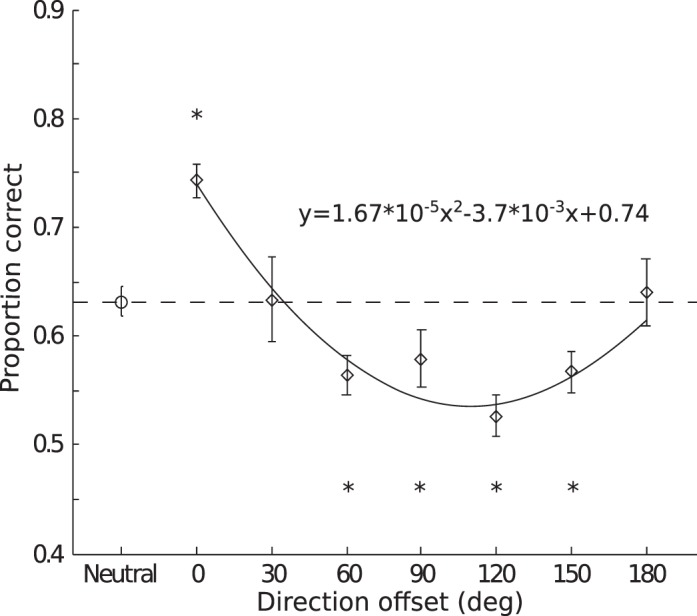
Results for Experiment 1. Group averaged accuracy as a function of the cue-to-target offset in direction. Error bars are the estimated within-subject standard error following the method of Loftus and Masson (1994). Asterisks indicate the significance level in paired t tests (*p < 0.05). The solid line is a quadratic fit of the average accuracy in the cued trials as a function of direction offset.
These results showed a significant enhancement effect when the cued direction was consistent with that of the target, demonstrating that participants were indeed utilizing the cue to orient their attention. The attentional enhancement effect was consistent with the idea that attending to a feature enhances its processing, which has been supported by a large number of studies using a variety of tasks (Arman et al., 2006; Lankheet & Vestraten, 1995; Liu & Hou, 2011; Liu et al., 2007; Liu & Mance, 2011; Saenz et al., 2002, 2003; Serences & Boynton, 2007; White & Carrasco, 2011; Zhang & Luck, 2008). Our observed attentional enhancement thus suggests that a similar feature-enhancement mechanism also operates in our motion detection task. Importantly, we also systematically manipulated the target offset from the cued direction, which allowed us to measure how attention modulates the activity of direction selective mechanisms. Here we observed a suppression effect in most of the offset conditions. Interestingly, the suppression effect exhibited a U-shaped function such that maximum suppression occurred for offsets close to orthogonal direction (90°), but no suppression was found for the opposite direction (180°). Interestingly, this “rebound effect” was not predicted by single-unit data from monkey MT (Martinez-Trujillo & Treue, 2004; Treue & Martinez-Trujillo, 1999), which showed maximal suppression for neurons tuned to the opposite direction as the attended direction. Thus, if detection relies on the neurons most sensitive to the target feature (Butts & Goldman, 2006; Hol & Treue, 2001; Jazayeri & Movshon, 2006; Regan & Beverley, 1985), one would expect a monotonic modulation function such that the opposite direction will exhibit the largest suppression. This was clearly not what we observed. The implications of this finding will be discussed in more detail in the General discussion. For now, we note that our experiment revealed a robust suppression effect due to feature-based attention to motion direction.
Experiment 2: Attention to orientation
Experiment 2 was designed to investigate whether attention-induced suppression is a general phenomenon or specific to motion direction. Orientation is one of the most important visual features and has been widely used in studies of feature-based attention. However, it is not clear whether attention to an orientation causes a suppression of other orientations and if such suppression also exhibits a “rebound” effect. Here we used a similar experimental paradigm to test the effect of orientation-based attention.
Methods
Participants
Six observers participated in this experiment; all were graduate and undergraduate students at Michigan State University and were naive as to the purpose of the experiment. All participants had normal or corrected-to-normal vision. Participants gave informed consent and all were compensated at the rate of $10/hr. Four observers also participated in Experiment 1.
Visual stimuli
The orientation stimuli were Gabor patches (spatial frequency, 2 cycles/°) in a circular aperture (size, 6°) presented on a gray background (56 cd/m2). The circular aperture was centered on the fixation cross (black, size: 0.2°), which was presented in the center of the screen throughout the experiment. The mask stimulus contained random pixel noise in the same aperture, with pixel luminance drawn from a Gaussian distribution (M = 56 cd/m2, SD = 28 cd/m2), truncated at ±2 standard deviations. The stimuli were presented on a 19-in. CRT monitor (1024 × 768 pixel, 60-Hz refresh rate, with gamma-corrected luminance levels), and observers viewed the display at a distance of 57 cm, with their heads stabilized via a chinrest in a dark room.
Task and procedures: Training
Similar to Experiment 1, here we first trained each observer on the task to select appropriate stimulus levels for the attention task. Observers detected the presence of a Gabor patch in a 2-IFC task (Figure 4). Each trial started with a 0.5-s fixation interval, then a 0.5-s blank interval, after which two intervals of stimuli were shown, separated by 0.5 s. Each interval contained five frames of stimulus, with each frame presented for 0.017 s (one video frame). In the noise interval, all five frames were noise stimuli (each noise stimulus was randomly generated on each trial); in the signal interval, the third frame was a Gabor patch while the remaining four frames were noise stimuli (Figure 4). The contrast of the Gabor patch was varied via the method of constant stimuli: 0.12, 0.18, 0.24, 0.36, 0.48, 0.60. The presentation order of the signal and noise intervals was randomized. Observers were instructed to report which interval contained the signal (Gabor patch) by pressing the 1 or 2 key on the numeric keypad of a standard computer keyboard. Observers were instructed to respond as accurately as possible. A sound was played as feedback on incorrect trials after observer response, after which an intertrial interval of 1.5 s followed.
Figure 4.
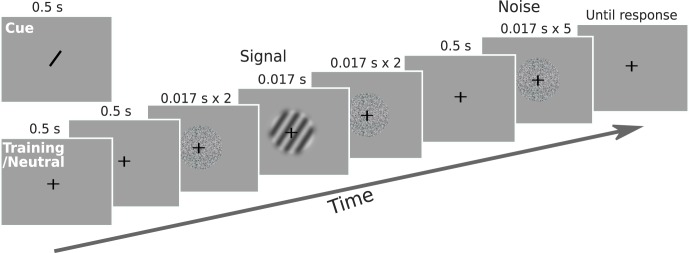
Schematic of a trial in Experiment 2. Observers detected the presence of an oriented grating in a 2-IFC task. In one interval, two noise frames preceded and followed the grating; in the other interval, five noise frames were shown consecutively.
We fit the proportion correct data with a Weibull function using psignifit (Wichmann & Hill, 2001; see Figure 2B for an example fit) and defined threshold as the contrast level corresponding to ∼65% correct in the 2-IFC task. Observers performed the orientation detection task in 60-trial blocks until their contrast threshold did not show a sizeable drop in consecutive four-block units. On average, the practice session was 18 blocks long (i.e., 1,080 trials), with a range of 16–21 blocks across observers. The training task was divided into two sessions, each lasting about 40 min.
Task and procedures: Attention
The attention task was similar to the training task, except we introduced a cueing and validity manipulation. For the orientation signal, the contrast level was determined by data in the training sessions (see above). At the beginning of the trial, a line cue appeared for 0.5 s (length: 0.6°, drawn through fixation), to indicate the likely orientation of the signal. The cue was valid on 69% of trials, when the signal was in the cued orientation. On the invalid trials (31%), the signal was in a different orientation than the cued orientation, with the difference set to one of six possible offset values (±30°, ±60°, ±90°). On each trial, the cue's direction was randomly sampled from 30 possible orientations ranging from 0° to 174° (step size = 6°). Observers were instructed to attend to the cued orientation, as it would help them detect the orientation signal. We also ran a neutral (no-cue) condition in separate blocks, in which the fixation dot turned green to indicate the impending stimuli. Signal orientation in the neutral trials was randomly sampled from the same 30 possible orientations as in the cued trials. In both the cued and neutral condition, observers were instructed to report which interval contained the orientation signal (Gabor patch) by pressing the 1 or 2 key on the numeric keypad.
Each session consisted of five blocks, with one neutral block and four cued blocks. The order of these blocks was randomized for each session. The neutral block contained 48 trials and cued block contained 60 trials. Each observer completed two sessions, for a total of 96 neutral trials and 480 cued trials, which was composed of ∼330 valid trials and ∼25 invalid trials in each target offset (∼50 trials when collapsed across the sign of the offset, see Results below).
Results and discussion
The average contrast threshold was 0.20 (SD = 0.03) as determined in the training sessions. We calculated accuracy as a function of the offset between the cue and signal orientation. The clockwise and counterclockwise offsets showed similar results; hence we collapsed across the sign of the offset to produce three offset levels (30°, 60°, 90°). Average performance showed a monotonic decreasing function (Figure 5). Performance in the neutral condition, when participants had no expectation of the signal orientation, served as the baseline to assess attentional effects. The monotonic decreasing function crossed the neutral performance level, showing both enhancement and suppression effects. Compared to the neutral condition, valid cues (offset 0°) yielded significantly higher accuracy, t(5) = 3.83, p < 0.05, while invalid cues produced significantly lower accuracy in the 90° offset condition, t90°(5) = 3.13, p < 0.05, but not in the 30° and 60° offset conditions, t30°(5) = 0.8, p = 0.46; t60°(5) = 1.75, p = 0.14. We fit the average cued data with a linear, a quadratic, and a zero-slope linear (no-modulation) function. Model comparison using BIC revealed a linear fit to be a better description of the data than a quadratic fit (Bayes factor = 1.5) and the no-modulation fit (Bayes factor = 625).
Figure 5.
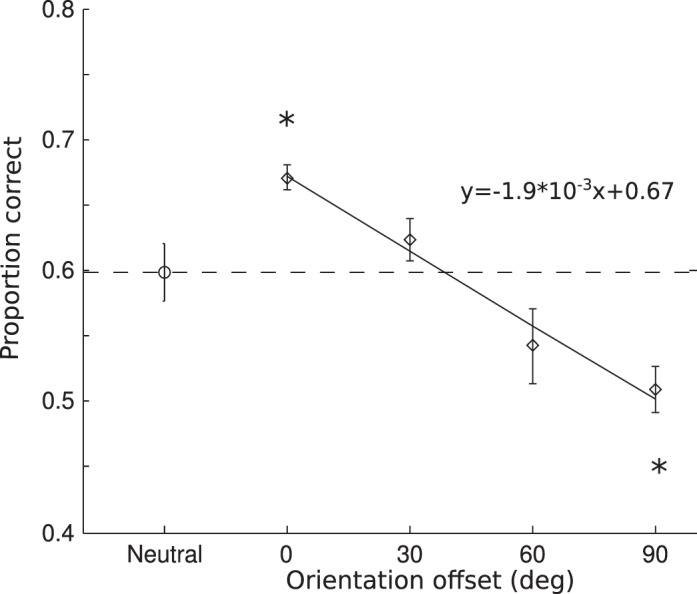
Results for Experiment 2. Group averaged accuracy as a function of the cue-to-target offset in orientation. Other notations are same as in Figure 2. The solid line is a linear fit of the average accuracy in the cued trials as a function of orientation offset.
We found a significant facilitation in performance when the cued orientation was consistent with the target orientation, which validates the cueing manipulation in this experiment. Again, this result suggests that the processing of the cued orientation feature was enhanced, consistent with previous studies of feature-based attention. Importantly, when target orientation differed from the cued orientation, a monotonic decline of performance was observed, such that the orthogonal orientation was significantly suppressed. Interestingly, we did not observe a rebound effect as in Experiment 1 where the most dissimilar feature showed less suppression than intermediate features. Thus the rebound effect is likely not a general phenomenon in feature-based attention, but could be specific to direction of motion. The monotonic decline is more consistent with the prediction of the feature-similarity gain model.
Experiment 3: Attention to color
In this experiment, we further explored attention-induced suppression in the domain of color. Color is another salient visual feature that has been extensively used in studies of visual attention. However, previous research tended to treat colors as discrete categories (e.g., searching a red item among blue and green items), thus making it difficult to investigate how attention affects the underlying visual representation of color, which is based on the continuous physical attribute of wavelength. This is presumably caused by the complexity of color mechanisms (Eskew, 2009), as well as the technical difficulty in manipulating color stimuli.
We are inspired by recent work in visual perception and memory using the Commission internationale de l'éclairage (CIE) color space. For example, Brouwer and Heeger (2009) found that fMRI response patterns in high-level visual areas can be used to reconstruct the CIE color space. Zhang and Luck (2008) showed that memory representation for colors can be modeled by a normal distribution in the CIE color space. These results suggest that the CIE color space (specifically, the CIE L*a*b space) can serve as a proxy of the internal color representation, which provided a representational space for us to investigate the effect of attention on color representation. We devised a color analog of the motion coherence stimulus and asked observers to detect a color target in a 2-IFC procedure similar to previous experiments to test the effect of color-based attention.
Methods
Participants
Six graduate and undergraduate students from Michigan State University participated in this experiment. All participants had normal or corrected-to-normal vision and reported to have normal color vision. We informally assessed their color vision by presenting them the Dvorine Pseudo-Isochromatic Plates (Dvorine, 1963), for which all participants correctly identified all the numbers. Participants gave informed consent and were compensated at the rate of $10/hr. One of the observers participated in the other two experiments.
Visual stimuli
The color stimuli were static arrays of 240 colored dots (dot size: 0.1°), whose locations were restricted to a 4°-thick annulus centered on the fixation (inner radius = 1°, outer radius = 5°). The dots were drawn in one of six possible colors, which were evenly spaced along a circle in CIE L*a* b* color space (radius = 79, a = 25, b = 38, luminance = 74). The hues were selected based on a pilot color-naming experiment, which showed that these colors can be roughly described as orange, yellow, green, blue, purple, and red (in order of appearance on the circle; Figure 6B). The spatial location of each dot was randomly assigned for each stimulus. Stimuli were presented on a 21-in. CRT monitor with a refresh rate of 100 Hz. The monitor was calibrated with an i1Pro spectrophotometer (X-Rite, Grand Rapids, MI), to derive the transformation from the CIE L*a*b space to the monitor RGB space (Westland & Ripamonti, 2004). Participants rested their heads on a chin rest that was positioned 57 cm away from the monitor.
Figure 6.

(A) Schematic of a trial in Experiment 3. Observers detected the presence of a dominant color in a 2-IFC task. (B) Depiction of the color wheel in the CIE L*a*b space. The circles represent the six equally spaced hues on the wheel that were used as colors for the dot stimuli. (C) Average accuracy on neutral trials for individual colors. Error bars are the estimated within-subject standard error.
We introduced a color analog of motion coherence using the dot stimuli. Zero color coherence is defined as equal proportion in the number of dots among all six colors (i.e., 40 dots per color), whereas a nonzero coherence indicates one color had a larger proportion than the other colors. In the latter case, the color with a larger proportion is referred to as dominant color, and the other five colors are equally proportioned. Numerically, the coherence was defined by the following equation:
 |
where Ps is the proportion of dots in the dominant color, and Pn is proportion of dots in each nondominant color, with the following constraint:
 |
That is, all nondominant colors are equally proportioned after accounting for the dominant color.
Task and procedures: Training
We first trained each observer on the task to select appropriate color coherence levels for the attention task. Observers detected the presence of a dominant color in a 2-IFC task (Figure 6A). Each trial started with a 0.5-s fixation period, after which two intervals of stimuli were shown, each for 0.3 s and separated by 0.4 s. One interval contained a 0% coherent stimulus where the six colors were equal in proportion (noise), while the other interval contained a nonzero coherent stimulus where one color had a larger proportion than the other five colors (signal). We used the method of constant stimuli with six coherence levels (1%, 5%, 10%, 15%, 20%, 25%, as defined above) to train observers on the basic color detection task. Observers were instructed to report the interval that contained the dominant color by pressing the 1 or 2 key on the numeric keypad of a standard computer keyboard, and they were instructed to respond as accurately as possible. A sound was played as feedback on incorrect trials after observer response, after which an intertrial interval of 1.5 s followed.
We fit the proportion correct data with a Weibull function using psignifit (Wichmann & Hill, 2001; see Figure 2C for an example fit) and found the data could be well fit by a Weibull. We defined threshold as the coherence level corresponding to ∼70% correct in the 2-IFC task. Separate fits were performed for each target color to derive six color coherence thresholds. Observers practiced the color detection task in blocks of 72 trials (average: 18 blocks, range: 15–21). The whole training procedure was divided into two to three sessions, each lasting about 45 min.
Task and procedures: Attention
The attention task is similar to the training task, except we introduced a cueing and validity manipulation. For the strength of the color signal, we used coherence levels as measured in the training sessions (see above). Note the signal strength was different for each target color, as determined in the training sessions. This was done to compensate for possible differences in sensitivity to different colors. At the beginning of the trial, a color cue appeared for 0.6 s (radius 0.3°, drawn on fixation), to indicate the likely color of the signal. The cue was valid on 70% of trials, when the signal was the same color as the cue. In the remaining 30% of trials (invalid trials), the signal had a different color than the cue, with the difference set to one of six possible offset values along the color wheel (±60°, ±120°, ±180°). On each trial, the cued color was randomly selected from the six colors (orange, yellow, green, blue, purple, and red). Observers were instructed to attend to the cued color, as it would help them to detect the color signal. We also ran the neutral (no-cue) condition in separate blocks, in which the fixation dot turned gray to indicate the impending stimuli. In both the cued and neutral condition, observers were instructed to report which interval contained the color signal by pressing the 1 or 2 key on the numeric keypad. Observers performed the color detection task in three separate sessions, with six neutral blocks and 20 cued blocks in total. The neutral block contained 30 trials and cued block contained 96 trials. In total, each observer completed 180 neutral and 1920 cued trials, which was composed of 224 valid trials and 16 invalid trials in each target offset for each color (∼32 trials when collapsed across the sign of the offset).
Results and discussion
The average coherence threshold across colors and observers was 0.13 (SD = 0.01). Because we measured separate coherence threshold for each color, we first examined performance in the neutral condition for the six colors. Figure 6C shows average performance across observers in the neutral condition for each of the six colors. Although performance was around 70% (expected level given the thresholding procedure), there were also some variations among colors. This is probably caused by relatively small amount of data collected for each color in the thresholding sessions, making the estimate less accurate. Importantly, performance for all colors was in an intermediate range such that both attentional enhancement and suppression can be observed (i.e., no floor or ceiling effect in the neutral condition).
For the cued trials, we calculated accuracy as a function of the offset between the cued and signal color. Because of the variation in neutral performance among different colors, we used the difference between each color's cued and neutral scores as the measure of attentional effects in all subsequent analysis. We first examined attentional effects for individual cued colors (Figure 7). In general, the cued colors had the highest performance level and were consistently above zero, whereas the uncued colors showed a decline in performance. The decline was generally monotonic and always reached below zero for large offsets. Given the similarity of attentional effects across colors, we averaged these modulation functions across colors and collapsed across positive and negative offsets. The final color modulation function exhibited a monotonic decreasing shape as the cue-target offset increased (Figure 8). Note because we plotted the difference score between cued and neutral condition, a positive value would indicate attentional enhancement and a negative value would indicate attentional suppression. The color modulation function crossed the zero point, showing both enhancement and suppression due to feature-based attention. We used one-sample t tests to compare the cueing effect to 0, to assess the statistical reliability of enhancement and suppression effects. Valid cues (offset 0°) yielded significant enhancement, t0°(5) = 4.52, p < 0.01, whereas invalid cues produced a suppression effect at all offset values, t60°(5) = 3.59, p < 0.05; t120°(5) = 4.78, p < 0.01; t180°(5) = 5.98, p < 0.01. We fit the average cued data with a linear, a quadratic, and a zero-slope linear (no-modulation) function. Model comparison using BIC found a quadratic fit to be a better description of the data than a linear fit (Bayes factor = 4.05 × 10⁵) and the no-modulation fit (Bayes factor = 1.67 × 10⁷).
Figure 7.
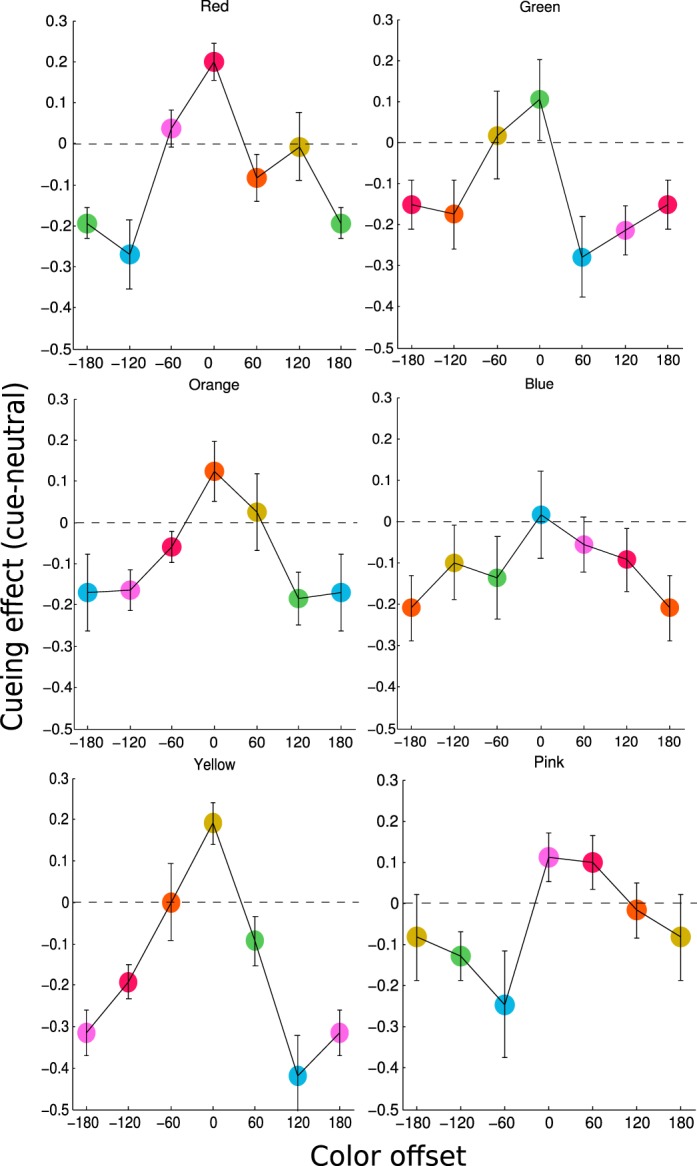
Results for individual cued colors in Experiment 3. Each panel plots the group averaged cueing effect, defined as performance difference between cued versus neutral trials for a particular cued color. The color of the target stimuli was shown as the color of the plot symbol, with the color at 0° as the cued color. Error bars are the estimated within-subject standard error.
Figure 8.
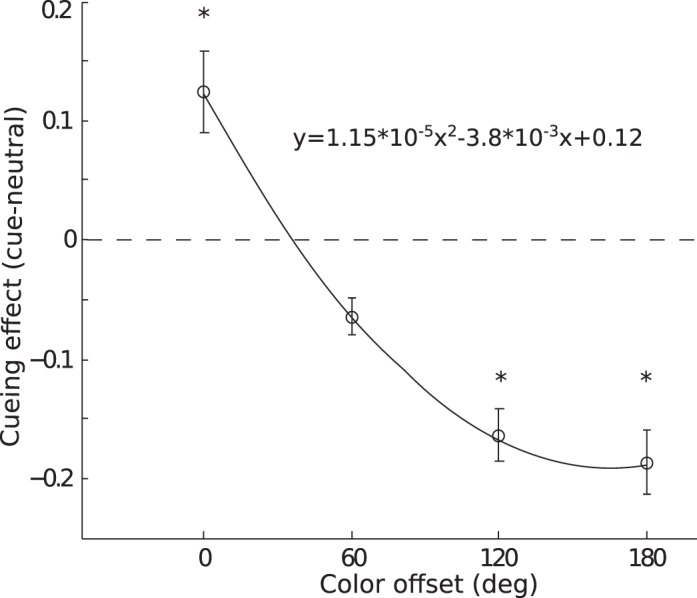
Results for Experiment 3, collapsed across individual cued colors, showing cueing effect as a function of the cue-to-target offset on the color circle. Other notations are the same as in Figure 2. The solid line is a quadratic fit of the cueing effect as a function of color offset.
We found attending to a color produced facilitation when the target color was consistent with the cued color and suppression when target color deviated from the cued color. The shape of the attentional modulation followed a monotonic decreasing function such that maximum suppression occurred for the color opposite to the cued color on the color circle (180° offset). Overall, these results are consistent with predictions of the feature-similarity gain model. Thus, the model, although first proposed based on results from motion direction (Martinez-Trujillo & Treue, 2004; Treue & Martinez-Trujillo, 1999), appears to also operate in the domain of color-based attention.
General discussion
We conducted three experiments with a detection paradigm and found that feature-based attention modulated performance via both enhancement and suppression along the feature dimension. In Experiment 1, observers' performance profiles relating the cued and actual target direction followed a U-shape function, with an enhancement effect when cue-to-target separation were around 0°, and a suppression effect when cue-to-target separation were around 90°, and finally a rebound effect when that separation was larger than 90°. In Experiment 2, the performance profile relating the cued and actual orientation showed a monotonic decreasing trend, where suppression was most pronounced when cue-to-target separation was 90°. In Experiment 3, the performance profile relating the cued and actual color also showed a monotonic decreasing trend, with maximum suppression occurring at cue-to-target separation of 180°. There was no appreciable rebound effect in the latter two experiments. These results largely support the feature-similarity gain model by providing a perceptual correlate for the underlying neuronal modulation due to attention.
Relationship to previous work
Several previous studies have measured the effect of feature-based attention on feature-selective mechanisms. In addition to the Ho et al. (2012) and Tombu and Tsotsos (2008) and studies mentioned in the Introduction, three other studies have also reported effects of attention on feature tuning. Using a masking technique, Baldassi and Verghese (2005) found that an orientation cue selectively reduced detection threshold at the cued orientation. Paltoglou and Neri (2012) used a noise classification image technique to measure tuning and found feature-based attention sharpened direction tuning but not orientation tuning. Ling, Liu, & Carrasco (2009) measured direction discrimination threshold with an external noise technique and used a computational model to infer that feature-based attention both enhanced and suppressed neural population response in a manner consistent with the feature-similarity gain model.
These studies used similar attentional manipulations in that observers were cued to attend to a particular feature prior to stimulus presentation. Beyond this commonality, however, there were many variations in design choices across experiments in terms of stimulus, task, and the measure of tuning. Perhaps not surprisingly, the results are also divergent. Whereas two studies (Baldassi & Verghese, 2005; Paltoglou & Neri, 2012) did not find evidence for suppression (another study by White & Carrasco, 2011, also failed to find suppression for the feature opposite to the cued feature), the other three studies (Ho et al., 2012; Tombu & Tsotsos, 2008; Ling et al., 2009) all reported some degree of suppression. Among the latter studies, the exact profile of attention-induced suppression also differed. Thus there lacks a consistent picture from these studies, and it is difficult to compare them directly due to significant variations in the experimental methodology.
We would like to offer that our study was optimized to measure the effect of attention on feature-selective mechanisms. First, we presented only one stimulus at a time in a fixed location, unlike most previous studies that presented multiple stimuli for which participants had to locate the target. This type of search-like paradigm would require shifts of spatial attention. Thus both spatial and feature-based attention was involved in shaping performance, which could complicate the interpretation of the results. Our 2-IFC task only presented a single stimulus at fixation, and thus eliminated the contribution of spatial attention. Second, the perceptual judgment in our task (determining which interval contained the target) was orthogonal to the cued feature. This is important because performance was not influenced by participants' perceived similarity among features. Had we asked participants to report which interval contained the cued feature, we would be measuring perceived similarity among features, instead of how attention affected feature representation (see Paltoglou & Neri, 2012, for more discussions). Lastly, our measure of attentional modulation is based on performance in a detection task, which presumably relies most on neurons tuned to the target feature (Butts & Goldman, 2006; Hol & Treue, 2001; Jazayeri & Movshon, 2006; Regan & Beverley, 1985). Thus performance on our task provides a close proxy to the underlying neural activity. In contrast, some previous studies relied on sophisticated data processing and modeling, for example, the psychophysical reverse correlation, which assumes a linear observer model (Paltoglou & Neri, 2012), or a computational model (Ling et al., 2009), which relies on assumptions about the neural architecture and neuronal response properties. Based on these considerations, we believe our simple protocol provides the most direct psychophysical measure of the effect of feature-based attention that is easy to interpret without complications due to design and analytic factors.
Attentional modulation of motion direction
In Experiment 1, attending to a direction produced a U-shaped modulation profile such that motion detection was enhanced for target moving in the attended direction, but impaired for a wide range of intermediate directions, and showed a rebound effect in the opposite direction. The rebound effect seems to be a robust finding, as it was also observed by Ho et al. (2012) under a different experimental setup. This nonmonotonic modulation profile is unexpected given neurophysiological data showing a monotonic modulation of MT neuronal activity as a function of the difference between the preferred and attended direction (Martinez-Trujillo & Treue, 2004).
One possible reconciliation between neurophysiological and behavioral data is that observers voluntarily attended to the axis of motion when cued to a direction. We think this is unlikely because we emphasized the distinction between direction and axis in our instructions and all participants were well-trained psychophysical observers. In addition, if participants always attended to the motion axis, we should expect equal performance in the valid (0° offset) and opposite (180° offset) direction, which was clearly not the case.
Another possibility is the existence of neural mechanisms tuned to the axis of motion. Direction-selective neurons tuned to two opposite directions have been found in both MT (Albright, 1984) and V1 (Conway & Livingstone, 2003; Livingstone & Conway, 2003). These neurons were probably not sampled in neurophysiological studies of attention because they constitute a minority of neurons in the visual cortex and researchers usually record from a limited number of neurons that reach certain inclusion criterion (Martinez-Trujillo & Treue, 2004; Treue & Martinez-Trujillo, 1999). However, these opposite-tuned neurons could contribute to performance in perceptual tasks. For example, it is possible that attention to upward direction enhances activity in neurons tuned to upward motion, as well as in neurons tuned to both upward and downward motion, and the enhancement in this latter group of neurons makes it easier to detect the 180° offset direction in our task.
To get further insight on this issue, we assessed participants' ability to report motion direction in our task without any attentional cueing. In a subset of training trials during Experiment 1, we asked participants to report the direction of the target (after they had indicated which interval contained the target), by clicking on a circle with a computer mouse to indicate the target direction. We then calculated the angular difference between the true target direction and the reported direction on trials that they correctly reported the target interval. The distributions of these directional errors were plotted in angular histograms in Figure 9. At high coherence (32%), the vast majority of errors centered around zero, suggesting participants clearly perceived the correct motion direction and by extension understood the concept of direction (as opposed to axis or orientation). However, even at this relatively high coherence level, there was a visible overrepresentation in the opposite direction at 180°. At the two lower coherence levels (8% and 16%), which were comparable to the coherence level used in Experiment 1 (10%), we observed a decrease in the proportion of 0° responses and an increase in the 180° responses. These results suggest that motions in the opposite directions are more easily confused with each other, and the results are consistent with the notion that bidirectional tuning might underlie performance in the motion detection task. Thus, we believe our results can still be consistent with the feature-similarity gain model, if one takes into account of the bidirectional tuning in the visual cortex.
Figure 9.
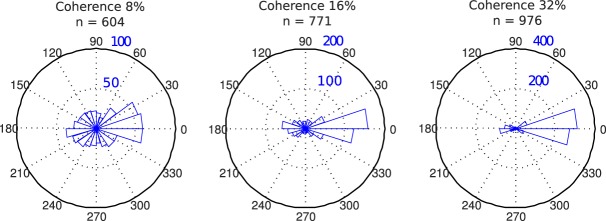
Pointing results from a subset of practice sessions in Experiment 1. Distribution of errors in pointing to target direction for three coherence levels, depicted as angular histograms in polar coordinate. Only trials on which observers correctly reported the target interval were shown. Coherence and number of trials are shown at the top of each panel.
Attentional modulation of orientation and color
In Experiment 2, we found a monotonic attentional modulation for orientation such that as the target orientation deviated more from the cued orientation, performance gradually declined. This result is directly predicted by the feature-similarity gain model. In contrast to a previous study (Tombu & Tsotsos, 2008), we did not observe any rebound effect. However, this latter study did not include a neutral condition, making it difficult to assess any suppression effect. Furthermore, the task required participants to judge whether stripes were straight or jagged, and attentional effect was only observed for jagged stimuli. This may be caused by the fact that the jagged stimuli were created by shifting segments of the stripes in an approximately orthogonal direction to the stripes' main orientation (see figure 1 in Tombu & Tsotsos, 2008), making it easier to detect the jaggedness if participants were attending to the 90° offset orientation. Thus we believe the observed rebound effect in Tombu and Tsotsos (2008) might be due to specific choices in their stimulus and task design. Our orientation data showed a monotonic modulation profile, suggesting that attention enhances neurons tuned to the attended orientation but suppresses neurons tuned to other orientations with the amount of suppression scaling with the dissimilarity between cued and preferred orientation, that is, the principle of feature-similarity gain (Martinez-Trujillo & Treue, 2004; Treue & Martinez-Trujillo, 1999). Thus, although the feature-similarity model was based on measurement of MT neurons' response to motion stimuli, our data predict that orientation-tuned neurons will exhibit similar attentional modulations when attention is directed to orientation.
In Experiment 3, we again found a monotonic-modulation function for attention to color. As the target color deviated more from the cued color, detection performance showed a gradual decline. This result is also consistent with the feature-similarity gain model, when applied to the dimension of hue specified by angles in the CIE color space. This might be somewhat surprising, as early stages of color processing is dominated by the trichromatic mechanism on the retina and opponent process in lateral geniculate nucleus (LGN) and V1 (Soloman & Lennie, 2007), neither of which exhibits tuning to hues in a continuous fashion. However, recent work has suggested that extrastriate areas such as V4 contain mechanisms tuned to hues along the spectrum (Brouwer & Heeger, 2009; Conway, Moeller, & Tsao, 2007). It is thus plausible that attention modulates these hue-tuned neuronal mechanisms according to the feature-similarity gain principle. Our data would predict such a result in a neurophysiological experiment.
Although the profile of attentional modulation is quite similar for color and orientation, we also observed a subtle difference, in that orientation modulation is best described by a linear trend, whereas color modulation is best described by a quadratic trend. Basically, the suppression of orientation was proportional to the orientation offset, whereas the suppression of color was reduced at large hue offsets. This could reflect a more uniform representation of feature similarity for orientation than that for hues. Perceptually, it seems to be the case that orientation similarity is proportional to differences in angle, whereas hue similarity is less so—at large offsets, two colors will appear quite dissimilar regardless of their separation (e.g., both the green and blue colors appear very different from the red color in Figure 6B, although red is closer to blue than to green in the color space). This implies that the modulation due to feature-similarity gain is not strictly linear for color-tuned mechanisms.
A recent study by Stormer and Alvarez (2014) reported a “surround suppression” effect in color space in a feature-based attention task. In a behavioral experiment, they presented colored dots in both the left and right visual fields and asked observers to detect brief intervals of coherent motion in both dot fields, while varying the similarity between the dot colors. In addition, dots of a third color were used as distracters in both visual fields and participants were cued to attend to two colors on each trial. They found that detection accuracy decreased and then increased as a function of the similarity between the two cued colors. Using a similar paradigm in a subsequent electroencephalography (EEG) experiment, they found steady-state visual evoked potential (SSVEP) amplitude for an ignored color in the opposite hemifield to the attended color also showed a decrease followed by an increase as a function of color similarity. These results are seemingly at odds with ours, which showed monotonic attentional modulation for color. However, there were many differences in the tasks used between the studies, making it difficult to directly compare the results. Here we note two important differences between the tasks. Stormer and Alvarez (2014) always presented a distracter color in the same location as the cued color, which might have encouraged a strategy to explicitly suppress the distracter color. In addition, participants were cued to attend to two colors in the behavioral experiment, which showed a stronger surround suppression effect than the EEG experiment. The need to ignore the distracter color and to attend to two colors, as well as the requirement to report on another feature dimension (direction of motion), made the tasks somewhat complicated, which could make it more difficult to control strategic factors. In our task, participants always attended to a single color in a single location and reported about the color feature in a standard cue validity paradigm. We believe that this simpler design allows for more direct measures of the effect of attention to color. Further research is needed to reconcile these results regarding the surround suppression effect in attention to color.
Challenges and future work
We have interpreted our findings in the framework of attention modulating the sensory representation of visual features. This framework is supported by neurophysiological data showing feature-based attention can modulate neuronal responses in visual cortex (Khayat et al., 2010; Martinez-Trujillo & Treue, 2004; Treue & Martinez-Trujillo, 1999). However, another prominent view in the literature is that attention reduces uncertainty at the decision stage without altering the sensory representation (e.g., Eckstein, Thomas, Palmer, & Shimozaki, 2000; Palmer, Verghese, & Pavel, 2000; Verghese, 2001). Although these theories were originally proposed in the domain of spatial attention, in principle, selective readout of feature detectors could also produce performance facilitation and suppression in feature-based attention tasks. A possible experimental remedy is to use a postcue to indicate the target feature, thus reducing uncertainty at the decision stage. However, postcues further complicate the overall task and could alter task strategy, and it is unlikely that postcues can eliminate selective readout. Thus, based on behavioral data alone, it would be difficult to distinguish the sensory-based versus decision-based accounts of performance modulation due to attention. Regardless of the precise underlying mechanisms, however, our results still provide a systematic characterization of how attention affects perceptual performance in three feature dimensions.
These results can be used to constrain further development of models of attention. We believe a promising avenue of future research would be to construct neurally plausible, computational models of perceptual performance (e.g., Eckstein, Peterson, Pham, & Droll, 2009; Jazayeri & Movshon, 2006). One can then implement the sensory- versus decision-based mechanisms in the model and examine how well each mechanism explains behavioral performance. Such models will also allow us to examine how physiological parameters (such as neuronal tuning width, attentional gain/suppression, and decision weights) influence behavior. Ultimately, however, the distinction between sensory- versus decision-based mechanisms might be best resolved at the neuronal level. Here, it is worth pointing out that the original neuronal data on feature-similarity gain (Martinez-Trujillo & Treue, 2004) were obtained with a task that is somewhat different from the tasks used in many other studies. Notably, the neutral condition required attention to the central fixation, which might not be the ideal baseline condition (see further discussions by White & Carrasco, 2011). Thus, more neuronal level data obtained with protocols that better isolate feature-based attention would be highly informative, particularly if combined with computational models that can link neuronal activity to behavioral performance.
Summary and conclusion
We examined the profile of attentional modulation in a cueing paradigm combined with a validity manipulation. We found suppression effects for all three features we tested: direction of motion, orientation, and color. The modulation profile exhibited a U-shaped function for direction, but largely linear functions for orientation and color. The data for orientation and color followed the predictions of the feature-similarity gain model, whereas the direction data were seemingly inconsistent with the model. However, after taking into account of neural mechanisms tuned to the axis of motion, the direction results can be reconciled with the predictions of feature-similarity gain. Overall, these results suggest that the feature-similarity gain principle of attention operates across a variety of feature dimensions and can affect the perception of features, in addition to neuronal activity.
Supplementary Material
Acknowledgments
We thank Rebecca Howe for assistance in data collection. This work was supported by a NIH grant (R01EY022727).
Commercial relationships: none.
Corresponding author: Taosheng Liu.
Email: tsliu@msu.edu.
Address: Department of Psychology, Michigan State University, East Lansing, MI, USA.
Contributor Information
Yixue Wang, Email: wangyix7@msu.edu.
James Miller, james.r.miller@email.wsu.
Taosheng Liu, Email: tsliu@msu.edu.
References
- Albright T. D.(1984). Direction and orientation selectivity of neurons in visual area MT of the macaque. Journal of Neurophysiology, 526, 1106–1130. [DOI] [PubMed] [Google Scholar]
- Arman A. C.,, Ciaramitaro V. M.,, Boynton G. M.(2006). Effects of feature-based attention on the motion aftereffect at remote locations. Vision Research, 4618, 2968–2976. [DOI] [PubMed] [Google Scholar]
- Baldassi S.,, Verghese P.(2005). Attention to locations and features: Different top-down modulation of detector weights. Journal of Vision, 56, 556–570, http://www.journalofvision.org/content/5/6/7, doi:10.1167/5.6.7. [PubMed] [Article] [DOI] [PubMed] [Google Scholar]
- Bondarenko R.,, Boehler C. N.,, Stoppel C. M.,, Heinze H. J.,, Schoenfeld M. A.,, Hopf J. M.(2012). Separable mechanisms underlying global feature-based attention. Journal of Neuroscience, 3244, 15284–15295. [DOI] [PMC free article] [PubMed] [Google Scholar]
- Brouwer G. J.,, Heeger D. J.(2009). Decoding and reconstructing color from responses in human visual cortex. Journal of Neuroscience, 2944, 13992–14003. [DOI] [PMC free article] [PubMed] [Google Scholar]
- Butts D. A.,, Goldman M. S.(2006). Tuning curves, neuronal variability, and sensory coding. PLoS Biology, 4, e92. [DOI] [PMC free article] [PubMed] [Google Scholar]
- Carrasco M.(2011). Visual attention: The past 25 years. Vision Research, 51, 1484–1525. [DOI] [PMC free article] [PubMed] [Google Scholar]
- Conway B. R.,, Livingstone M. S.(2003). Space-time maps and two-bar interactions of different classes of direction-selective cells in macaque V1. Journal of Neurophysiology, 895, 2726–2742. [DOI] [PMC free article] [PubMed] [Google Scholar]
- Conway B. R.,, Moeller S.,, Tsao D. Y.(2007). Specialized color modules in macaque extrastriate cortex. Neuron, 56, 560–573. [DOI] [PMC free article] [PubMed] [Google Scholar]
- Dvorine I.(1963). Dvorine pseudo-isochromatic plates. New York: Harcourt, Brace, & World. [Google Scholar]
- Eckstein M. P.,, Peterson M. F.,, Pham B. T.,, Droll J. A.(2009). Statistical decision theory to relate neurons to behavior in the study of covert visual attention. Vision Research, 4910, 1097–1128. [DOI] [PubMed] [Google Scholar]
- Eckstein M. P.,, Thomas J. P.,, Palmer J.,, Shimozaki S. S.(2000). A signal detection model predicts the effects of set size on visual search for feature, conjunction, triple conjunction, and dis-junction displays. Perception & Psychophysics, 623, 425–451. [DOI] [PubMed] [Google Scholar]
- Eskew R. T.(2009). Higher order color mechanisms: A critical review. Vision Research, 49, 2686–2704. [DOI] [PubMed] [Google Scholar]
- Ho T. C.,, Brown S.,, Abuyo N. A.,, Ku E. J.,, Serences J. T.(2012). Perceptual consequences of feature-based attentional enhancement and suppression. Journal of Vision, 128: 15,, 1–17, http://www.journalofvision.org/content/12/8/15, doi:10.1167/12.8.15. [PubMed] [Article] [DOI] [PMC free article] [PubMed] [Google Scholar]
- Hol K.,, Treue S.(2001). Different populations of neurons contribute to the detection and discrimination of visual motion. Vision Research, 41, 685–689. [DOI] [PubMed] [Google Scholar]
- Jazayeri M.,, Movshon J. A.(2006). Optimal representation of sensory information by neural populations. Nature Neuroscience, 9, 690–696. [DOI] [PubMed] [Google Scholar]
- Kastner S.,, Ungerleider L. G.(2000). Mechanisms of visual attention in the human cortex. Annual Review of Neuroscience, 23, 315–341. [DOI] [PubMed] [Google Scholar]
- Khayat P. S.,, Neibergall R.,, Martinez-Trujillo J. C.(2010). Attention differentially modulates similar neuronal responses evoked by varying contrast and direction stimuli in area MT. Journal of Neuroscience, 30, 2188–2197. [DOI] [PMC free article] [PubMed] [Google Scholar]
- Lankheet M. J. M.,, Vestraten F. A. J.(1995). Attentional modulation of adaptation to two-component transparent motion. Vision Research, 3510, 1401–1412. [DOI] [PubMed] [Google Scholar]
- Ling S.,, Liu T.,, Carrasco M.(2009). How spatial and feature-based attention affect the gain and tuning of population responses. Vision Research, 49, 1194–1204. [DOI] [PMC free article] [PubMed] [Google Scholar]
- Liu T.,, Hou Y.(2011). Global feature-based attention to orientation. Journal of Vision, 1110: 8, 1–8, http://www.journalofvision.org/content/11/10/8, doi:10.1167/11.10.8. [PubMed] [Article] [DOI] [PubMed] [Google Scholar]
- Liu T.,, Larsson J.,, Carrasco M.(2007). Feature-based attention modulates orientation-selective responses in human visual cortex. Neuron, 55, 313–323. [DOI] [PMC free article] [PubMed] [Google Scholar]
- Liu T.,, Mance I.(2011). Constant spread of feature-based attention across the visual field. Vision Research, 51, 26–33. [DOI] [PubMed] [Google Scholar]
- Livingstone M. S.,, Conway B. R.(2003). Substructure of direction-selective receptive fields in macaque V1. Journal of Neurophysiology, 895, 2743–2759. [DOI] [PMC free article] [PubMed] [Google Scholar]
- Loftus G. R.,, Masson M. E.(1994). Using confidence intervals in within-subject designs. Psychonomic Bulletin & Review, 1, 476–490. [DOI] [PubMed] [Google Scholar]
- Martinez-Trujillo J. C.,, Treue S.(2004). Feature-based attention increases the selectivity of population responses in primate visual cortex. Current Biology, 14, 744–751. [DOI] [PubMed] [Google Scholar]
- Maunsell J. H. R.,, Treue S.(2006). Feature-based attention in visual cortex. Trends in Neuroscience, 29, 317–322. [DOI] [PubMed] [Google Scholar]
- Newsome W. T.,, Pare E. B.(1988). A selective impairment of motion perception following lesions of the middle temporal visual area (MT). Journal of Neuroscience, 8, 2201–2211. [DOI] [PMC free article] [PubMed] [Google Scholar]
- Palmer J.,, Verghese P.,, Pavel M.(2000). The psychophysics of visual search. Vision Research, 4010–12, 1227–1268. [DOI] [PubMed] [Google Scholar]
- Paltoglou A. E.,, Neri P.(2012). Attentional control of sensory tuning in human visual perception. Journal of Neurophysiology, 1075, 1260–1274. [DOI] [PMC free article] [PubMed] [Google Scholar]
- Regan D.,, Beverley K. I.(1985). Postadaptation orientation discrimination. Journal of the Optical Society America A, 2, 147–155. [DOI] [PubMed] [Google Scholar]
- Reynolds J. H.,, Chelazzi L.(2004). Attentional modulation of visual processing. Annual Review of Neuroscience, 27, 611–647. [DOI] [PubMed] [Google Scholar]
- Saenz M.,, Buracas G. T.,, Boynton G. M.(2002). Global effects of feature-based attention in human visual cortex. Nature Neuroscience, 57, 631–632. [DOI] [PubMed] [Google Scholar]
- Saenz M.,, Buracas G. T.,, Boynton G. M.(2003). Global feature-based attention for motion and color. Vision Research, 43, 629–637. [DOI] [PubMed] [Google Scholar]
- Scolari M.,, Ester E. F.,, Serences J. T.(2014). Feature- and object-based attentional modulation in the human visual system. Nobre K.& Kastner S.. (Eds.), Oxford handbook of attention. Oxford, UK: Oxford University. [Google Scholar]
- Serences J. T.,, Boynton G. M.(2007). The representation of behavioral choice for motion in human visual cortex. Journal of Neuroscience, 2747, 12893–12899. [DOI] [PMC free article] [PubMed] [Google Scholar]
- Soloman S. G.,, Lennie P.(2007). The machinery of colour vision. Nature Review Neuroscience, 84, 276–286. [DOI] [PubMed] [Google Scholar]
- Stormer V. S.,, Alvarez G. A.(2014). Feature-based attention elicits surround suppression in feature space. Current Biology, 2417, 1985–1988. [DOI] [PubMed] [Google Scholar]
- Tombu M.,, Tsotsos J. K.(2008). Attending to orientation results in an inhibitory surround in orientation space. Perception & Psychophysics, 701, 30–35. [DOI] [PubMed] [Google Scholar]
- Treue S.,, Martinez-Trujillo J.C.(1999). Feature-based attention influences motion processing gain in macaque visual cortex. Nature, 399, 575–579. [DOI] [PubMed] [Google Scholar]
- Verghese P.(2001). Visual search and attention: A signal detection theory approach. Neuron, 314, 523–535. [DOI] [PubMed] [Google Scholar]
- Westland S.,, Ripamonti C.(2004). Computational colour science using MATLAB. Chichester, UK: John Wiley & Sons. [Google Scholar]
- White A. L.,, Carrasco M.(2011). Feature-based attention involuntarily and simultaneously improves visual performance across locations. Journal of Vision, 116: 15,, 1–10, http://www.journalofvision.org/content/11/6/15, doi:10.1167/11.6.15. [PubMed] [Article] [DOI] [PMC free article] [PubMed] [Google Scholar]
- Wichmann F. A.,, Hill N. J.(2001). The psychometric function: I. Fitting, sampling, and goodness of fit. Perception & Psychophysics, 638, 1293–1313. [DOI] [PubMed] [Google Scholar]
- Zhang W.,, Luck S. J.(2008). Discrete fixed-resolution representations in visual working memory. Nature, 4538, 233–236. [DOI] [PMC free article] [PubMed] [Google Scholar]
Associated Data
This section collects any data citations, data availability statements, or supplementary materials included in this article.