Abstract
The lens system in the human eye is able to best focus light from only one distance at a time.Therefore, many objects in the natural environment are not imaged sharply on the retina. Furthermore, light from objects in the environment is subject to the particular aberrations of the observer's lens system (e.g., astigmatism and chromatic aberration). We refer to blur created by the observer's optics as “natural” or “defocus” blur as opposed to “on-screen” blur created by software on a display screen. Although blur discrimination has been studied extensively, human ability to discriminate defocus blur in images of natural scenes has not been systematically investigated. Here, we measured discrimination of defocus blur for a collection of natural image patches, sampled from well-focused photographs. We constructed a rig capable of presenting stimuli at three physical distances simultaneously. In Experiment 1, subjects viewed monocularly two simultaneously presented natural image patches through a 4-mm artificial pupil at ±1° eccentricity. The task was to identify the sharper patch. Discrimination thresholds varied substantially between stimuli but were correlated between subjects. The lowest thresholds were at or below the lowest thresholds ever reported. In a second experiment, we paralyzed accommodation and retested a subset of conditions from Experiment 1. A third experiment showed that removing contrast as a cue to defocus blur had only a modest effect on thresholds. Finally, we describe a simple masking model and evaluate how well it can explain our experimental results and the results from previous blur discrimination experiments.
Keywords: natural images, defocus blur, accommodation, depth, contrast
Introduction
A major goal of vision science is to characterize and understand visual performance in natural tasks under natural conditions. Although this goal is difficult because of the experimental and theoretical complexities of working with natural stimuli, it is critical for basic science and practical applications. Here we consider the task of detecting and discriminating blur in natural images that are blurred by the optics of the eye (defocus, astigmatism, higher order aberrations). We refer to this kind of blur as “defocus” blur or “natural” blur as opposed to “on-screen” blur, which is created in software.
The natural environment contains objects at many distances, but the human eye can best focus light from only one distance at a time. Thus, at any one time, much of the retinal image will be somewhat blurred. Defocus blur provides useful information for many biological and perceptual tasks, including regulation of eye growth (Held, Cooper, & Banks, 2012; Nguyen, Howard, & Allison, 2005; Schaeffel & Diether, 1999; Vishwanath & Blaser, 2010; Wallman & Winawer, 2004; Watt, Akeley, Ernst, & Banks, 2005; Wildsoet & Wong, 1999), the control of accommodation (Kotulak & Schor, 1987; Kruger, Mathews, Katz, Aggarwala, & Nowbotsing, 1997), and the discrimination and estimation of depth and scale (Artal et al., 2004; Held et al., 2012; Mather & Smith, 2002; Watt et al., 2005). These tasks are ubiquitous (e.g., humans refocus their eyes approximately 150,000 times a day), and they all require detecting and discriminating defocus blur. Nonetheless, little is known about the human ability to detect and discriminate defocus blur in natural images.
The properties of a given retinal image depend on multiple factors: the particular optical properties of the observer's eye (aberrations), the focus distance of the observer's eye, the distance of the object from the observer, and the properties of the imaged object(s) (e.g., color, texture, etc.). It is difficult to systematically control all these factors in a laboratory setting. Thus, it is unsurprising that systematic investigations of defocus blur discrimination in natural images have yet to be undertaken.
In natural viewing, points in the retinal image are focused differentially, depending on whether the corresponding objects are nearer or farther than the distance at which the eye is focused. On a conventional computer display, however, all the light is presented at the same physical distance from the subject: the distance of the monitor. If the eye is focused at the monitor distance, all points in the image will be focused sharply. If the eye is focused at some other distance, all image points will be defocused with the same amount of blur. Thus, with a conventional computer display, it is very difficult to present stimuli that will cause the same pattern of retinal blur as the eye's own optics within natural scenes.
As a consequence, most previous work on blur discrimination concerns discrimination of very simple kinds of on-screen blur, typically created with a Gaussian blur kernel (Wang & Ciuffreda, 2005; Watson & Ahumada, 2011). These and other studies have obtained fairly consistent results (for review, see Watson & Ahumada, 2011). However, there are a number of limitations in these previous studies. For example, blur produced by the optics of the eye under natural viewing conditions is quite different from Gaussian on-screen blur. Additionally, human observers are highly sensitive to the exact pattern of blur created by the optics of their own eyes (Artal et al., 2004). Hence, human performance with Gaussian on-screen blur might not accurately reflect human performance under natural viewing conditions.
Other studies have measured blur discrimination thresholds with blur created by the optics of the eye. But these studies have used only simple, artificial stimuli, such as random dot stimuli, sine-wave gratings, or Maltese cross stimuli (Held et al., 2012; Nguyen et al., 2005; Wang & Ciuffreda, 2005). Simple, artificial images typically do not contain the rich statistical structure of natural images. Visual systems are likely to be tuned to the statistical properties of natural images formed in each individual observer's eye (Artal et al., 2004; Burge & Geisler, 2011). Therefore, it is possible that blur discrimination is more precise with natural defocus blur than on-screen blur and more efficient with natural images than it is with artificial images.
In the present study, we measured human defocus blur discrimination of natural images (and some artificial images). Thresholds were measured in a custom psychophysical apparatus that could present light from three different distances simultaneously. Human subjects focused at one distance, and natural images were presented at other distances. The natural images were sharp on screen, thus ensuring that all retinal blur was created by the optics of the subject's eye. The natural images selected for the study were highly heterogeneous so that we could address several fundamental questions. Does human defocus blur discrimination performance vary across different image patches? To what extent is human performance dictated by the properties of each natural image patch? Can variations (or lack of variation) in performance be explained by contrast detection and discrimination mechanisms? We found that defocus blur discrimination performance varies greatly across different image patches. Sensitivity to defocus blur increased as the standard defocus pedestal increases for both subjects above 0.125 D. In a second experiment, we paralyzed accommodation, thus removing small fluctuations in the resting accommodative state. We found that this manipulation increased sensitivity at standard defocus levels near zero. In a third experiment, we modified the stimuli so that their contrast energy in the retinal image did not change with defocus blur level. We found that there was little effect on performance for most stimuli. This result implies that defocus blur discrimination cannot be simply explained by discrimination of the total contrast energy. Finally, we describe a model to account for our data and compare our results to previous blur discrimination experiments (see Model section).
Methods
Stimuli
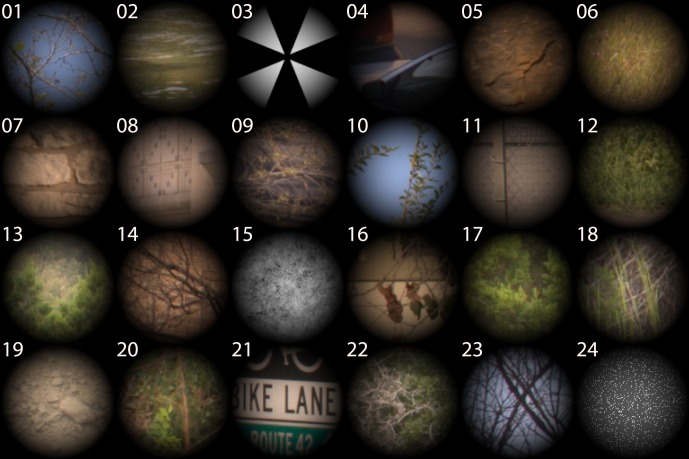
Natural image patches were selected from a database of natural images that were sharply focused. Images in this database were photographed with a Nikon D700 camera fitted with a Sigma 50-mm prime lens that was focused at optical infinity. All images in the database were in sharp focus because the camera with which the photographs were taken was always at least 16 m from the nearest object in the frame (Burge & Geisler, 2011). From the natural image database, we selected 21 patches that reflected the variety of images found in the natural environment. Patches were selected based on their color, the skew of their pixel histograms, and their image content. To enable the comparison of our data to the existing literature on blur discrimination, we also included three artificial image patches that have been widely used in previous experiments: the Maltese cross, 1/f noise, and random dots on a uniform background (Figure 1). The hard edges of the image patch borders could potentially serve as an unnatural cue. A cosine window (1.0° at half height) was used to smoothly attenuate each patch.
Figure 1.
The natural and artificial image patches that were used in the experiment. Image patches spanned the naturally occurring range of hues and skews in the pixel histogram. To ease comparison to existing data sets, a Maltese cross image, a random-dot image, and a 1/f noise image were also included in the image sets. Stimuli were smoothly attenuated with a cosine window (1.0° at half height) when displayed in the experiments.
Psychophysical apparatus
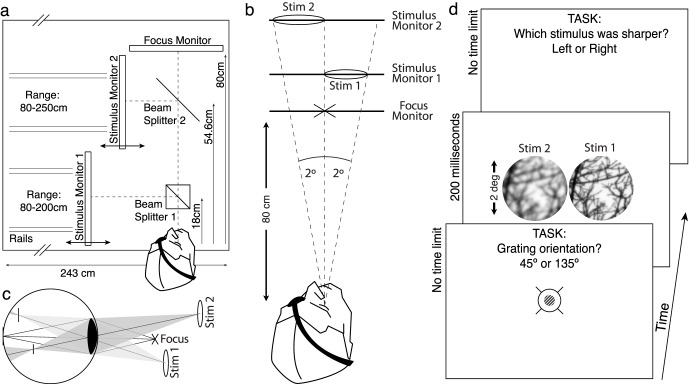
Stimuli were presented on a custom multiplane display rig. Multiplane displays enable the simultaneous presentation of stimuli at multiple physical distances from the subject. When light is presented at a distance other than the focus distance, the eye's optics will defocus it as in natural viewing. We constructed a multiplane display capable of presenting light from three different distances simultaneously. The display consisted of three computer monitors. The light from all three monitors was combined with beam splitters so that simultaneously presented stimuli would appear to come from the same visual direction side by side. Thus, points in the retinal image will be focused differentially by the eye's optics, depending on the differences between the eye's focus distance and the physical distances at which the stimuli are presented.
The multiplane display rig consisted of three identical Dell 2007fp LCD monitors, precisely positioned on an optical bench. Two of the monitors presented stimuli, and a third presented an accommodative target (see Experimental procedure for details). The monitors were controlled from a single computer using an ATI FirePro V5800 graphics card. The focus monitor (FM) was positioned at 80 cm from the eye. Stimulus monitor 1 (SM1) and stimulus monitor 2 (SM2) were positioned at variable distances from the eye (SM1: 80–200 cm, SM2: 80–250 cm; Figure 2). To enable easy repositioning of the monitors, each monitor had wheels that rode on rails that were affixed to the optical bench. Two beam splitters were oriented at 45° angles and positioned at 18 and 54.6 cm from the eye. The light from SM1 was reflected by beam splitter 1. The light from SM2 was reflected by beam splitter 2 and transmitted through beam splitter 1. The light from the FM was transmitted through beam splitter 2 and beam splitter 1 (Figure 2). All distances were measured from the nodal point of the eye. At all times, the FM displayed a mean luminance field (17.4 cd/m2) with an 8° × 8° black box centered on the optic axis. This black box defined the borders of the viewing volume, within which the accommodation target and the image patches were presented.
Figure 2.
Three-monitor psychophysical apparatus, stimulus conditions, and task. (a) Subjects on a bite bar viewed stimuli monocularly through a 4-mm artificial pupil. Light from all three monitors could be displayed simultaneously along the same line of sight. The FM was fixed at 80 cm (1.25 diopters). The stimulus monitors could be positioned at variable distances ranging from 80 cm to 200 cm (1.25 diopters to 0.5 diopters). Stimuli could thus be defocused at levels ranging from 0.00 to 0.75 diopters. (b) The viewing situation simulated by the apparatus. When the monitors were positioned at three different distances, stimuli presented on each monitor are defocused by different amounts. (c) The effect of defocus on the retinal image for the viewing conditions shown in (b). Light from the stimulus on monitor 1 will be myopically defocused. Light from monitor 2 will be myopically defocused more severely. (d) The psychophysical task. Subjects focused a low-contrast high-frequency sine-wave grating, embedded in a crosshairs target. Immediately after indicating the orientation of the sine-wave grating, two identical natural images (scaled so that their visual angles matched), were presented to the left and right of the focus position. Subjects judged which stimulus (left or right) was sharper.
Note that our multiplane display is not a true volumetric display. Volumetric displays can present simulated stimuli at any distance within a viewing volume (Akeley, Watt, Girshick, & Banks, 2004; Love et al., 2009; MacKenzie, Hoffman, & Watt, 2010; Ravikumar, Akeley, & Banks, 2011) whereas our display can present stimuli only at three discrete distances in any one trial. Most (Akeley et al., 2004; Hoffman, Girshick, & Akeley, 2008; Love et al., 2009; Ravikumar et al., 2011) but not all (Heron, Charman, & Schor, 2001; Kasthurirangan, Vilupuru, & Glasser, 2003; MacKenzie et al., 2010) volumetric displays (and spinning displays) have display planes at fixed distances relative to the view position. Presenting stimuli at distances intermediate to the fixed planes requires software interpolation (Akeley et al., 2004; Ravikumar et al., 2011) that can introduce artifacts into the retinal stimuli. For most viewing situations, these artifacts are negligible (Hoffman et al., 2008; Ravikumar et al., 2011; Wang & Ciuffreda, 2005; Watson & Ahumada, 2011). However, positioning display planes at the exact physical distances to be simulated guarantees that the retinal stimuli are artifact-free. It is for this reason that we constructed our displays as we did.
Calibration: Human subjects
The complexity of the psychophysical apparatus necessitates a series of calibration procedures to eliminate spurious cues that could confound our results. Monitors were corrected for luminance and geometric cues using both operator and subject calibrations.
First, the monitors were corrected for luminance. Light loss occurs when beam splitters reflect or transmit light. The light from SM2 and FM passed through two beam splitters (Figure 2) whereas the light from SM1 passed through only one beam splitter. Thus, more light is lost from SM2 and FM than SM1. Luminance differences between the stimuli presented on the different monitors are therefore a potential confounding cue. In the experiment, stimuli were designed to have identical luminance. To remove these luminance differences between the monitors, subjects performed the following task before each block of data was collected. Subjects were shown a standard color patch (2° × 2°) at 17.4 cd/m2 on the FM and a comparison color patch (2° × 2°) on a SM. Subjects matched the apparent luminance of the SM patch to the apparent luminance of the color patch on the FM by method of adjustment. This procedure was repeated for each color channel on each SM. Furthermore, we measured and linearized the gamma function for each monitor separately, thereby ensuring that pixel value mapped to luminance equivalently for all monitors.
Next, a calibration procedure was performed to match the size and position of the stimuli. Stimuli were designed to subtend the same visual angle regardless of monitor position. The two SMs moved on rails and could be positioned at multiple different distances. Thus, slight mispositioning of each monitor could introduce differences in the projected size of each stimulus. To eliminate this potential confounding cue, subjects performed a geometric calibration procedure before each block of trials to ensure that the stimuli subtended the same visual angle and were presented at their desired locations. First, a 2° crosshairs target was presented on the FM. Subjects matched the size and position of a similar target on each SM using a method of adjustment. Based on this calibration, stimuli in our experiment were sized so that they subtended the same visual angle through our system independent of the monitor distance. In order to swamp any residual luminance or geometrical calibration errors, the calibration settings (position, size, and luminance) were jittered a small amount (±2%) in each trial of the experiment.
Stimuli were designed to have identical resolution. Here, we distinguish between monitor pixels and image pixels. Monitor pixels are the physical pixels in the monitor; image pixels are the pixels that define the digital image. Because the SMs had identical monitor pixel pitch, the angle subtended by each monitor pixel changed as a function of monitor distance. Thus, the effective resolution of the monitor pixels in pixels/° was not necessarily equal. For example, if a SM is positioned at 200 cm, a 2° image patch subtends 250 monitor pixels corresponding to a Nyquist frequency of 62.5 cpd. If a SM is positioned at 80 cm, a 2° stimulus subtends 100 monitor pixels corresponding to a Nyquist frequency of 25 cpd. At some stage of the image preprocessing pipeline, the image pixels must be adjusted for one-to-one presentation on the monitor pixels. A simple way to present the images would be to first start with an image patch defined by 250 image pixels (for presentation on the farthest monitor) and then to down-sample it as needed for presentation on the nearer monitor. The problem with this procedure is that image patches presented on a far monitor would have higher angular resolution than image patches presented on a near monitor. To eliminate this potential confounding cue, we performed the following procedure in software. First, a Gaussian pyramid expansion increased the number of image pixels in each stimulus to 800 × 800 pixels. This is more than twice the largest number of monitor pixels on which a stimulus would ever be presented (250 × 250 pixels). Next, the images were blurred and down-sampled to twice their final presentation size. Finally, a Gaussian pyramid reduction decreased the number of images pixels in each stimulus so that the number of image pixels equaled the number of monitor pixels on which it would be presented. The stimuli were converted from 16-bit to 8-bit for presentation on the gamma-corrected monitors. (Note that although a Badal lens system is another potential solution, it would also require considerable calibration to ensure that no spurious cues would be introduced over the relevant areas of the displays.)
After collecting all the experimental data, an analysis was performed on the data of each human subject to ensure there was no SM-specific bias. Specifically, if the difference in defocus between the two stimuli was identical and no SM bias existed, then subjects should have chosen the sharper stimulus the same percentage of the time regardless of whether it was displayed on SM1 or SM2. If our numerous calibration procedures were unsuccessful in eliminating spurious monitor-specific cues, then subjects might have been biased to select the stimulus displayed on SM1 over that displayed on SM2 or vice versa. This was checked by comparing the subject's responses on all pairs of conditions that were identical except for the monitor on which each stimulus was presented. For example, we compared the percentage of times subjects chose the sharper stimulus when patch #1 was presented on SM1 with 0.25 D and on SM2 with 0.50 D to the percentage of times subjects chose the sharper stimulus when patch #1 was presented on SM1 with 0.50 D and on SM2 with 0.25 D. We defined bias as the difference between these two percentages. The bias deviates from 0.00 if a monitor bias exists. Figure 3 shows a histogram of this measure for each subject. One can see that, in both cases, the measure is approximately normally distributed around 0.00, which indicates that there was no SM bias in our experiment.
Figure 3.
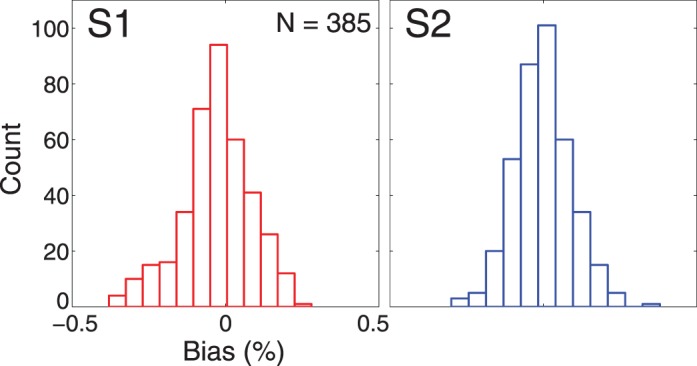
Histogram of monitor bias measure for both subjects (n = 385). Monitor bias is defined as the difference between SM1 chosen and SM2 chosen (in percentage) for each stimulus when the positions of SM1 and SM2 were reversed. A monitor bias of 0.0 indicates no bias for SM. The monitor bias measure for both subjects is normally distributed around 0. For Subject 1: mean bias = −0.03, median bias = −0.02. For Subject 2: mean bias = −0.002, median bias = 0.00.
Experimental procedure
Two experienced psychophysical subjects participated in this study. Subjects were examined by an ophthalmologist prior to the administration of eye drops in the study. Experimental protocols were approved by the humans subjects committee at UT Austin and were consistent with the Declaration of Helsinki. Subjects' heads were stabilized with a bite bar. The subject's right eye was positioned along the principle optical axis of the apparatus. Subjects viewed stimuli monocularly. A 4-mm artificial pupil was positioned less than 1 mm from the eye. A 4-mm pupil is a normal pupil size when viewing objects outdoors on a cloudy day (Wyszecki & Stiles, 1982). The retinal illumination produced by our stimuli was 218.6 Trolands (17.4 cd/m2 with a 4-mm pupil). Accommodation was not paralyzed.
The task was to indicate which of two natural image patches was in better focus (i.e., less defocused). The defocus of a given target stimulus is defined as the difference between the current power of the subject's lens and the power required to bring the target into focus:
 |
where ΔD is the defocus, Dfocus is the current power of the lens, and Dtarget is the power required to image the target sharply, expressed in units of diopters (1/m). If, for example, the eye is focused at 80 cm (1.25 D) and a stimulus is presented at 100 cm (1.00 D), the stimulus will be defocused by 0.25 diopters. Different defocus levels were presented by moving the SMs to different distances from the FM. Stimuli were always rendered sharply on the SMs.
In our experiment, image blur was created by the optics of the subject's eye as it is in natural viewing conditions. The subject's eye defocused the retinal images of the stimuli because light from each SM came from a distance that was different from the distance that the subject's eye was focused. For the retinal image to be defocused accurately, it is critical that subjects accommodate at the correct distance (80 cm) before each trial begins. To aid and assess accommodative accuracy, subjects were asked to accommodate on a focus target. The focus target was presented straight ahead on the FM. The target consisted of high-contrast crosshairs and a high-frequency sine-wave grating (40% contrast, 20 cpd, 1°) attenuated by a cosine window (0.5° at half height). The crosshairs provided a good accommodative stimulus, and the high-frequency grating provided a psychophysical means of assessing accurate accommodation (i.e., an acuity test). The sine wave was oriented at either 45° or 135°. To initiate each experimental trial, subjects indicated in a two-alternative forced choice procedure whether the grating was oriented at 45° or 135°. After this orientation judgment was made, the accommodation target disappeared, and the trial began. The frequency and contrast of the sine-wave grating were set such that small accommodation errors (±0.25 diopters) reduced orientation discrimination to near chance. There was no time limit, but most judgments were made in less than 1 s. Subjects were required to achieve and maintain a high accuracy (e.g., 95%) on the grating orientation task. Post hoc data analysis showed that both subjects maintained this level of accuracy.
In each trial, two identical image patches were rendered sharply and simultaneously on SM1 and SM2 for 200 ms. The accommodative latency in the human visual system ranges from 200 to 500 ms (Heron et al., 2001; Kasthurirangan et al., 2003). Thus, this short presentation time strongly reduced the possibility of unwanted stimulus blurring due to changing accommodation. SM2 was positioned at the standard distance. SM1 was positioned at a comparison distance. The distance of the monitor maps directly to defocus (Equation 1). From this point forward, we will refer to the standard or comparison defocus of the stimulus rather than the distance of the monitor. Each stimulus was attenuated by a cosine window (1.0° at half height) and was positioned ±1.0° left or right of straight ahead. The left/right position of the sharper (i.e., less defocused) stimulus was randomized on each trial (Figure 2). The task was to judge the position (left or right) of the sharper stimulus.
In the present study, three experiments were performed to test different aspects of defocus blur discrimination. Experiment 1 was designed to measure human sensitivity to defocus blur for 21 natural image patches. Seven standard defocus levels that ranged from 0.00 to 0.75 D in equal steps were used in our experiment (Figure 4). For most standard levels, five comparison levels were used (standard level ± 0.25 D). For standard levels at or near the limits of the defocus range (e.g., ΔD = 0.75 D), fewer comparison levels were used. Trials were blocked by standard and comparison levels. Each block consisted of 10 trials per stimulus, and each block was repeated five times. In all, each subject completed ∼42,000 trials (24 images × 10 trials × 5 blocks × 5 comparisons × 7 standards). To reduce the potential effects of learning and adaptation, the blocks were run in pseudorandom order.
Figure 4.

Example natural image patch at all seven standard defocus levels and raw psychometric data from Subject 1. In general, threshold levels increased with increased standard defocus.
Experiment 2 was designed to test whether or not accommodative fluctuations account for the elevated thresholds for discriminating defocus blur for stimuli presented near the focus distance. Cycloplegia was induced in the right eye with a single drop of cyclopentolate (1% tropicamide ophthalmic solution), thus resulting in the loss of accommodation. Trial lenses were used to adjust the effective power of the eye such that subjects reported that the crosshairs/high-frequency sine-wave target was in best subjective focus. The power of the preferred trial lens was +0.75 D for both subjects. Cyclopleged subjects reran all conditions from Experiment 1 having standard defocus levels of 0.00 D and 0.75 D. Thus, Experiment 2 was identical to Experiment 1 in all respects except that accommodation was paralyzed.
Experiment 3 was designed to test whether a difference in total visible contrast energy is necessary for accurate defocus blur discrimination. The experimental details were the same as Experiment 1 except that (a) the contrasts of the standard and comparison stimulus patches were adjusted so the contrasts of the retinal images were approximately equal and (b) that thresholds were only measured at standard defocus levels of 0.375 D. This standard defocus level was chosen because thresholds stabilized at ΔD = 0.375 D (Figure 5a) and because it was in the middle of the measured range. In addition, the data at that defocus level could not be affected by small focus biases (Figure A1). Accommodation was not paralyzed.
Figure 5.
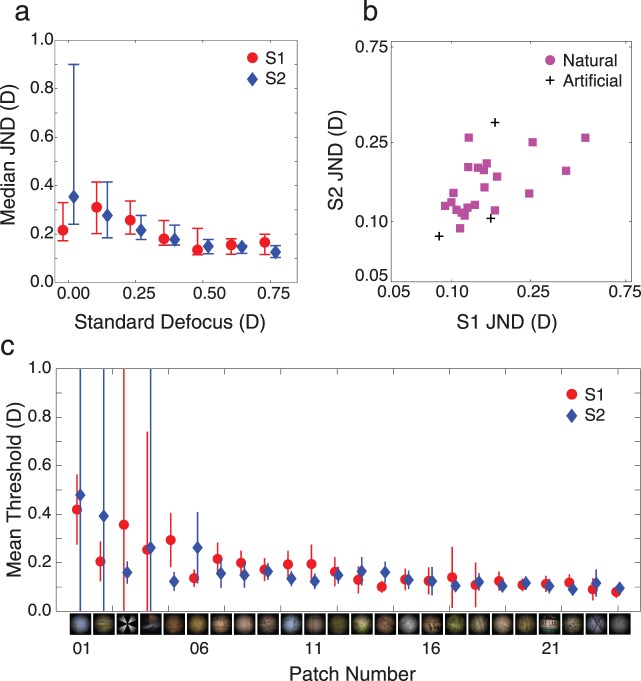
Results of Experiment 1. (a) Median thresholds (75%) in diopters across all 24 stimuli for both subjects. Error bars represent the first and third quartile of the data. Threshold variability decreased with higher standard defocus levels, and defocus discrimination sensitivity increased. This effect is more pronounced in Subject 2 (blue diamonds) but is still present in Subject 1 (red circles). Both subjects were shown the same standard defocus levels. Data points are offset in this figure to improve legibility. (b) Correlation between discrimination thresholds. Plotted is the weighted average threshold for each stimulus over the last three standard defocus levels (0.500, 0.625, and 0.75 D) for each subject. A log–log axis was chosen because confidence intervals on thresholds are roughly equal in log–log space. Thresholds were moderately correlated between subjects (0.55, p = 0.005). The Spearman rank correlation between thresholds was 0.55 (p ≪ 0.01). (c) Mean thresholds in diopters as a function of patch for each subject. Patches are ordered here, and in Figure 1, by average threshold between subjects from high to low. The Maltese cross, a standard accommodative stimulus, is among stimuli for which thresholds were highest (i.e., blur was hardest to discriminate). The random dot stimulus produced the lowest thresholds. No obvious relationship exists between image content and discrimination performance.
Results
Experiment 1: Defocus discrimination
In our experiment, an accommodative target was viewed throughout, and subjects were on average at least 95% correct in discriminating the orientation of a high-frequency sine-wave target just prior to presentation of the defocus discrimination stimuli. Nonetheless, this procedure may not eliminate mean focus errors (focus bias) less than ±0.25 D. To account for this possibility, we fit a slightly modified version of a cumulative normal to the psychometric data via maximum likelihood assuming a binomial noise model
 |
where μ̃ is the mean of the psychometric function, σtot is the slope parameter of the psychometric function corresponding to internal noise and accommodative fluctuations (see below), Dbias is the focus bias, and ΔD̃C is the corrected defocus of each comparison stimulus. The corrected defocus values are obtained by adding the focus bias (see Appendix) to the comparison and standard defocus values: ΔD̃C = ΔDC + Dbias and μ̃ = μ + Dbias, respectively. If the focus bias and all other biases equaled zero, μ̃ would equal ΔDS. The absolute value sign is used because the subjects were instructed to judge which of the two stimuli was sharper (i.e., had the lower magnitude of defocus blur). The estimated focus bias for Subject 1 was 0.00 D; the estimated focus bias for Subject 2 was −0.12 D (see Appendix for details). Note that the findings reported in this paper are robust to whether or not residual focus biases are accounted for in the fit procedure. Threshold was defined as the difference between the 75% and 50% points on the psychometric function (i.e., d' = 1.36); 95% confidence intervals on the thresholds were obtained from 1,000 bootstrapped data sets.
Across image patches, thresholds decrease on average as a function of standard defocus in both subjects (Figure 5a). At each defocus level, however, thresholds varied markedly for different image patches. For example, the lowest discrimination threshold was below the lowest defocus blur discrimination threshold ever reported (0.11 D, 4-mm pupil). For other image patches, discrimination thresholds were more than five times larger.
To examine the role that image patch content has in determining discrimination thresholds, we compared the thresholds of the two subjects on a patch-by-patch basis. The two most extreme hypotheses are that (a) threshold variation is due only to noise in the psychophysical measurements or (b) threshold variation is due only to properties of the images. If threshold variation were due only to noise, then threshold variation between the two subjects would be perfectly uncorrelated. On the other hand, if threshold variation were due only to variations in image patch content, thresholds would be perfectly correlated between the two subjects. To make this comparison, we defined a measure of overall performance for each patch. As can be seen in Figure 5a, threshold values stabilized, and confidence intervals on the thresholds decreased as the standard level increased. Thus, we summarized the performance on each patch, for each subject, as the weighted average of the thresholds of the last three standards (i.e., 0.5, 0.625, and 0.75 diopters) with weights equal to the normalized inverse variance (reliability). (Note that the results reported below are robust to different methods for summarizing performance.) These average thresholds are plotted in Figure 5b and c. Both plots show that the thresholds for the two subjects are correlated across patches.
It is useful to compare the natural image patches for which defocus discrimination was easy and those for which defocus discrimination was hard (Figure 5c). There was significant threshold variation among the natural stimuli. For example, an image of tree branches against the sky (#23 in Figure 1) was the second easiest stimulus to discriminate after the random dot image (0.12 diopters), yet discrimination performance for other images of branches against the sky (#01 and #10 in Figure 1) was significantly poorer.
Of the artificial stimuli, the random-dot stimulus had the lowest defocus discrimination threshold. On the other hand, the Maltese cross was among the one third of stimuli for which thresholds were highest. Given that the Maltese cross is one of the most commonly used stimuli in studies of defocus blur discrimination and of the accommodative response (Bharadwaj & Schor, 2006a, 2006b), researchers may have been underestimating defocus sensitivity under natural conditions. Indeed, defocus blur may be somewhat more useful in natural conditions than has previously been appreciated.
Experiment 2
Experiment 2 was designed to test whether or not accommodative fluctuations account for the elevated thresholds for discriminating defocus blur for stimuli presented near the focus distance. Previous experiments on blur detection have reported that sensitivity to changes in defocus blur increases as the blur of the standard increases (Wang & Ciuffreda, 2005; Watson & Ahumada, 2011). The results of Experiment 1 have a similar pattern of sensitivity changes, consistent with the literature. The effect is not strong in Subject 1, but it is more pronounced in Subject 2 (Figure 5a). It has been suggested that the increase in sensitivity with blur can be solely explained by relative changes in the optical transfer function (Wang & Ciuffreda, 2005). Fluctuation about the mean level of accommodation is another factor that may contribute to decreased sensitivity at low levels of blur.
In humans, under natural conditions, the refractive power of the lens fluctuates about the mean focus distance with an amplitude of 0.1–0.3 D and a temporal frequency of approximately 1.5 Hz (Campbell, Robson, & Westheimer, 1959; Charman & Heron, 1988). Accommodation was not paralyzed in Experiment 1, so it is possible that thresholds were affected by accommodative fluctuations. If fluctuations randomly change which stimulus is sharper (standard or comparison) from trial to trial, then the slope of the psychometric function may decrease, and estimated thresholds may increase.
Two factors determine how fluctuations affect thresholds: the amplitude of the fluctuation and the focus distance relative to the objects being imaged. That is,
 |
where DFM is the dioptric distance of the FM, Dbias is the subject's focus bias in diopters, Dfluc is the amplitude of the accommodative fluctuation, and Dcrit is nearest SM distance (in diopters) for which performance will be unaffected by accommodative fluctuations. (Note that the term in the parentheses is the subject's focus distance in diopters.)
Given a typical accommodative fluctuation amplitude (0.2 D; Campbell et al., 1959; Charman & Heron, 1988), and the subjects' focus bias (+0.00 D and −0.12 D), the critical distance for Subject 1 is 1.25 D (0.80 m), and the critical distance for Subject 2 is 0.93 D (1.08 m). When the standard was at 0.75 D, there were no conditions for which stimuli were presented nearer than either subject's critical distance. Thus, for both subjects, we predict that paralyzing accommodation will have no effect on thresholds at 0.75 D. On the other hand, when the standard was at 0.00 D, Subject 2 had three comparison levels nearer than his critical distance (DC = [1.25, 1.125, 1.0 D] corresponding to ΔD = [0.00, 0.125, 0.25 D]), and Subject 1 barely had one (DC = 1.25 D corresponding to ΔD = 0.00 D) (Figure 6). Thus, we predict that paralyzing accommodation will dramatically decrease thresholds for Subject 2 whereas we predict that thresholds for Subject 1 will be unaffected.
Figure 6.
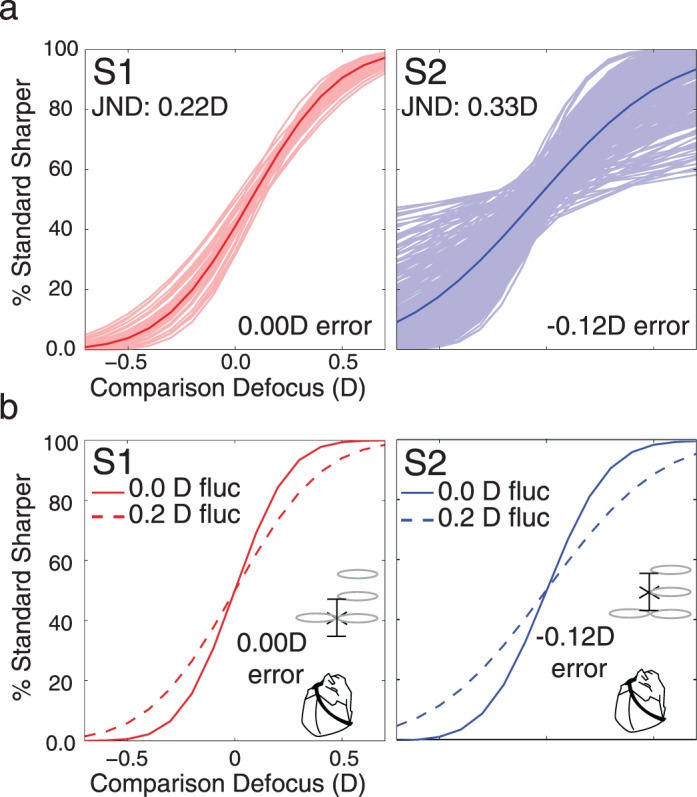
Effect of accommodative fluctuations on defocus discrimination thresholds. (a) Simulated psychometric functions. The shaded lines are 1,000 simulated psychometric functions at a standard of 0.00 D using the focus bias corresponding to each subject (0.00 D for Subject 1 and −0.12 D for Subject 2). The solid lines are the aggregate psychometric functions. The psychometric functions of Subject 2 showed more variability because of the negative focus error. (b) Simulated psychometric functions for 0.0 D and 0.2 D accommodative fluctuations. Each function represents 1,000 simulations. The threshold for Subject 2 increased more than for Subject 1 because Subject 2 had a focus error.
The results from Experiment 2 are shown in Figure 7. Results were as predicted. For Subject 2, thresholds at 0.00 D were significantly lower, and thresholds at 0.75 D were unaffected. For Subject 1, paralyzing accommodation had no effect at either 0.00 or 0.75 D. The analysis above shows that the different effects are expected when focus bias is accounted for. The results suggest that accommodative fluctuation combined with focus bias is in large part responsible for the elevation in threshold near zero defocus.
Figure 7.
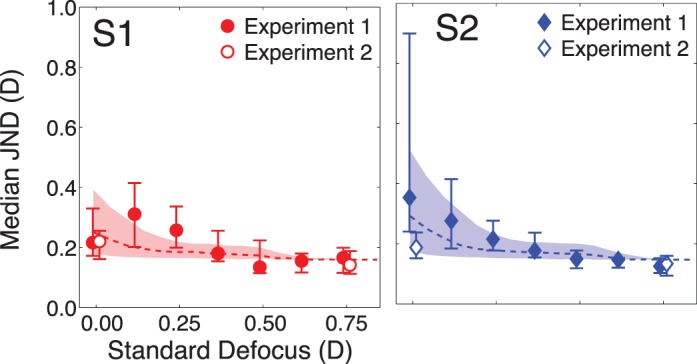
Results of Experiment 2. Median threshold versus standard defocus level for Experiment 1 (filled markers) and Experiment 2 (empty markers). As predicted, Subject 1 (red circles) showed little change in threshold at a standard defocus of 0.00 D and no change at 0.75 D. The median threshold for Subject 2 (blue diamonds) decreased at 0.00 D but not at 0.75 D. The dotted line in Figure 10 shows the simulated threshold as a function of standard defocus with an accommodative fluctuation amplitude of 0.2 D. The shaded area in Figure 10 shows stimulated thresholds with amplitudes ranging from 0.1 to 0.3 D, which is the normal range within which different human subjects vary (Charman & Heron, 1988).
Accommodative fluctuation is a source of behavioral variability that is independent of all other external and internal sources of variability. In Experiment 2, the effect of accommodative fluctuation was removed. We performed a Monte Carlo simulation to determine the degree to which discrimination thresholds in Experiment 1 could be predicted by the thresholds in Experiment 2 plus the effect of accommodative fluctuations. In each trial of the simulation, a random focus error due to accommodative fluctuation η was sampled from a sine wave with an amplitude of Dfluc. This focus error due to accommodative fluctuation was then added to the subject's mean focus distance to compute the true defocus of both standard and comparison. Specifically, for a particular simulated trial for a given standard and comparison defocus condition
 |
 |
The proportion standard monitor was chosen as sharper on the simulated trial is given by
 |
where σint is the standard deviation of the cumulative normal corresponding to the median threshold across all conditions when accommodation was frozen (Figure 7, open data points). In other words, σint represents all sources of experimental noise except for accommodative fluctuations. For a given condition, 1,000 trials were simulated to obtain simulated psychometric data, which were then fit with a cumulative normal. As with the human psychophysical data, thresholds were defined as the difference between the 75% and 50% points on the psychometric function. Based on previous reports in the literature, the amplitude of the accommodative fluctuation Dfluc was fixed at 0.2 D (Charman & Heron, 1988).
The dotted line in Figure 7 shows how thresholds are predicted to change when natural accommodative fluctuations of 0.2 D are present. The shaded area shows the effect of fluctuations of 0.1–0.3 D. Note that this prediction is parameter-free and is not a fit to the data. The data from both subjects in Experiment 1 is reasonably well accounted for by adding the effect of accommodative fluctuations to the data collected in Experiment 2. Thus, the accommodative fluctuations that are present in natural viewing will, on average, elevate defocus blur discrimination thresholds when the viewer is focused near a target.
Experiment 3
Under normal conditions, increased blur reduces contrast at all spatial frequencies. Thus, blur reduces total contrast energy. However, these contrast reductions vary systematically with the spatial frequency; that is, defocus blur causes systematic changes in spectral shape. Humans can, in general, detect changes in contrast alone and can detect changes in spectral shape alone. However, in defocus discrimination experiments, it is not clear which cue dominates. Experiment 3 was designed to test whether a difference in total visible contrast energy is necessary for accurate defocus blur discrimination.
We performed a series of steps to equalize the retinal contrast of the stimuli in each trial. First, we defined a difference signal for the standard and comparison stimuli to be the difference between the intensity profile of the windowed image patch minus the windowed mean luminance of the patch:
 |
 |
where I(x) is the input image, Ī is the local mean of the input image, W(x) is the cosine windowing function, and psfs(x) and psfC(x) are the optical point spread functions (PSFs) associated with the standard and comparison defocus levels, respectively. The local mean of the input image is given by , where N is the number of pixels in the input image. The PSFs were determined assuming a wave optics model that included the effects of diffraction (4-mm pupil), chromatic aberrations, and the defocus of the stimulus. The effect of human chromatic aberrations (Thibos, Ye, Zhang, & Bradley, 1992) on the PSF was modeled as the sum of single wavelength PSFs, weighted by the human photopic sensitivity function (Burge & Geisler, 2011).
Second, we computed the average energy of both difference signals
 |
 |
Third, we defined a contrast scaling constant, k, as the square root of the maximum energy over the minimum energy, which ensures that k ≥ 1 in all cases:
 |
Finally, we scale the contrast of the lower contrast stimulus by k
 |
This procedure ensures that retinal images associated with both stimuli have the same retinal contrast.
Defocus blur discrimination thresholds measured with contrast-equalized stimuli are shown in Figure 8a. Average thresholds are slightly higher than in Experiment 1, but both subjects clearly retained the ability to discriminate defocus. Thus, differences in retinal image contrast are not necessary for discriminating defocus blur.
Figure 8.
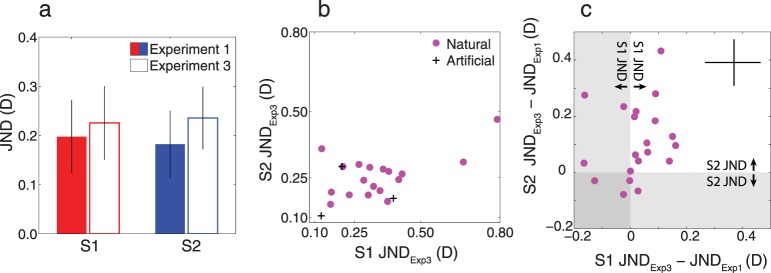
Experiment 3 results. (a) Mean threshold at standard defocus of 0.375 D collapsed across stimuli for Experiments 1 and 3 with bootstrapped 95% confidence intervals. Thresholds increased slightly for both subjects but were not significantly different. (b) Subject 2 JND from Experiment 3 versus Subject 1 JND from Experiment 3. Thresholds are correlated between subjects when contract energy is equalized (0.67, p = 0.0002). (c) The difference in the thresholds for each stimulus between Experiments 1 and 2 for Subject 2 versus the difference in thresholds for Experiments 1 and 3 for Subject 1. The difference is correlated between subjects (0.57, p = 0.004). The bars in the upper right corner represent the average 95% confidence intervals for all points.
Model for defocus blur discrimination
It is clear from Figure 5b and c that there are substantial differences in defocus discrimination thresholds across natural stimuli and across artificial stimuli. To what extent can these differences be explained by standard models of spatial frequency masking? To address this question, we evaluated a simple model in which the detectability (d') of a particular stimulus is taken to be the pooled difference between standard (baseline) and comparison responses, divided by the total baseline response within some spatial frequency band. Figure 9 shows a schematic of the model.
Figure 9.
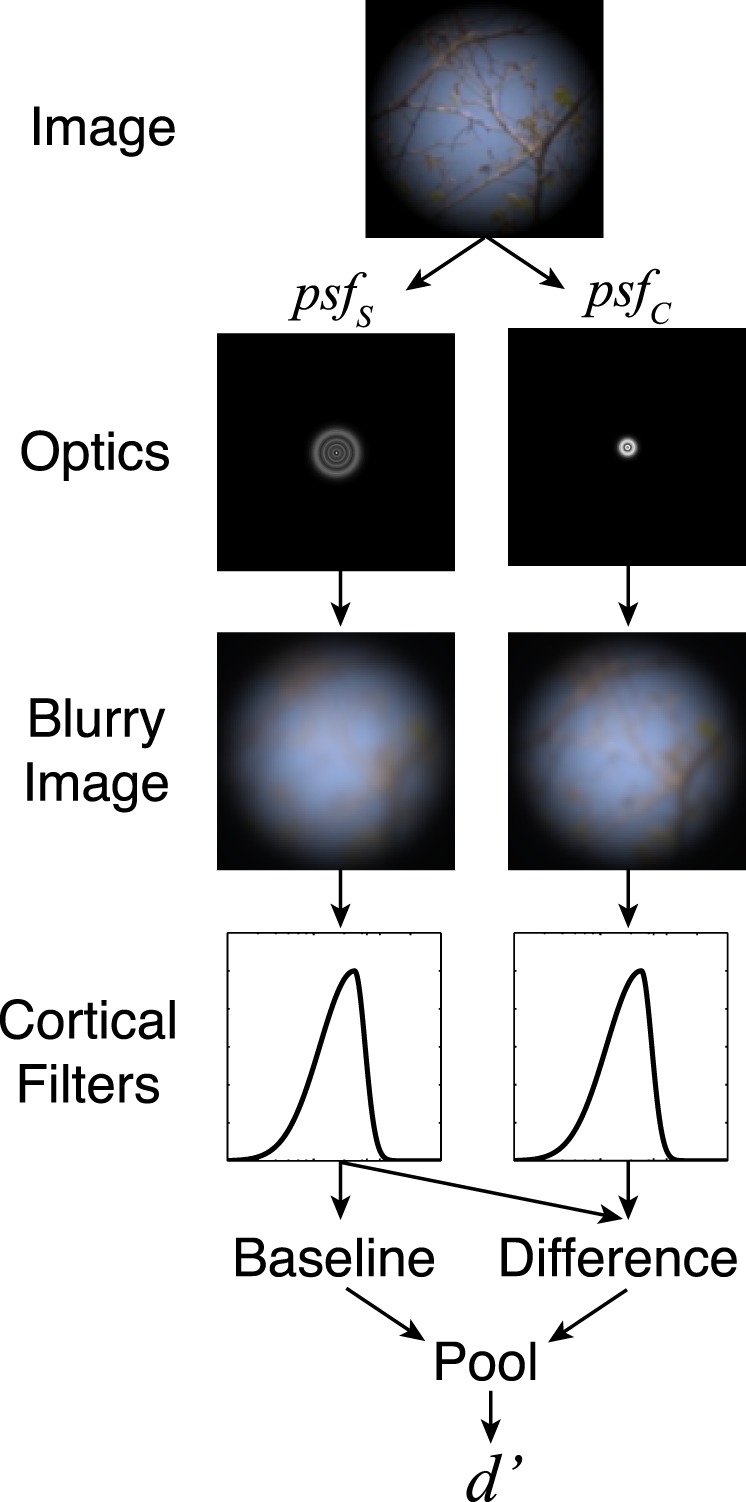
Schematic of our model for blur discrimination in natural images.
At a given defocus level, ΔD, the response in the Fourier domain is the product of three factors: the stimulus, the optics, and a band-pass filter:
 |
where u = (u,v) is the vertical and horizontal frequency, Z(u) = F{I(x)w(x)}is the Fourier transform of the windowed image, otf(u;ΔD) is the optical transfer function, and G is a band-pass filter. The optical transfer function was determined assuming the effects of diffraction (4-mm pupil), chromatic aberrations, and defocus but not the other monochromatic aberrations (e.g., Burge & Geisler, 2011, 2012). We define G as a log Gabor filter with different standard deviations above and below (σhigh and σlow) the peak frequency (μG):
 |
where . We allow the standard deviations above and below the peak to differ in order to provide a somewhat wider range of filter shapes. The signal in the space domain is obtained by taking the inverse Fourier transform:
 |
Thus, the baseline response is b(x;ΔDs), and the difference signal, which carries the defocus information, is s(x;ΔDc,ΔDs) = b(x;ΔDc) − b(x;ΔDs).
To generate predictions, we regard the baseline response as an equivalent noise power (or a normalizing contrast power). Thus, the detectability is given by
 |
where P0 is an additive noise constant, k is a scale parameter, and ρ is a pooling exponent. Note that if ρ = 2, then Equation 14 is the formula for optimal pooling of uncorrelated signals (d' summation); however, we allow ρ to vary to allow for the possibility of suboptimal pooling. In the present experiment, threshold was defined as the defocus difference corresponding to 75% correct (d' = 1.36). Thus, the predicted threshold, JND = ΔDC − ΔDS, is obtained by setting the left side of Equation 14 to 1.36 (i.e., the d' corresponding to threshold) and solving for ΔDC.
We estimated the model parameters by minimizing the mean squared error between the predicted and measured thresholds for both subjects simultaneously. The estimated parameters are P0 = 9.34e8, ρ = 3.81, μG = 9.13, σhigh = 1.71, σlow = 2.15, k = 0.035.
Figure 10a shows the correspondence between the model predictions and measured thresholds for each stimulus. Subject thresholds are calculated as described above. Model thresholds were computed in the same way, using the same weights that were applied when averaging the subject thresholds to generate a measure of overall threshold (see Experiment 1). The rms error between the model and Subject 1 is 0.053 D and between the model and Subject 2 is 0.075 D. This discrepancy between model and human thresholds is small, especially given that an optometric prescription is considered acceptable for dioptric errors less than 0.25 D. The correlations between predicted and measured thresholds are 0.52 for both subjects. Recall that the correlation between subject thresholds is 0.55. Thus, the model predicts the experimental thresholds of the two subjects as well as thresholds from one subject can predict the other.
Figure 10.
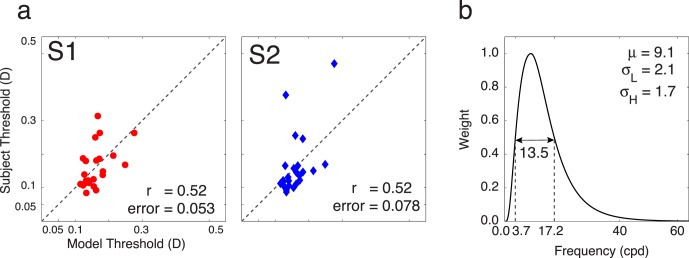
Model results. (a) Subject thresholds for blur discrimination versus predicted thresholds for blur discrimination. The correlation between predicted thresholds and subject thresholds is 0.52 for both subjects. Recall that the between-subjects correlation is 0.55. The model predicts threshold variability as well as each observer predicts each other. (b) Log Gabor weighting function on frequencies. The peak is at 9.1 cpd, and the bandwidth is 13.57.
The log Gabor filter that best accounts for the data is shown in Figure 10b. It is centered on 9.1 cpd with a bandwidth of 13.53 cpd. Watson and Ahumada (2011) reviewed data from a wide range of blur discrimination studies. All of these studies used artificial stimuli and on-screen (generally Gaussian) blur. To get some sense of how our data and model compare to these previous studies, we used our model to predict on-screen blur discrimination thresholds for a windowed edge target degraded by on-screen blur (see inset of Figure 11). For a particular on-screen blur, σscrn, the response in frequency space is the product of four elements: the windowed edge stimulus, the on-screen Gaussian blurring kernel, the optics given zero defocus, and the band-pass filter:
 |
where Z(u) is the Fourier transform of the unblurred stimulus and Gauss is the Fourier transform of the Gaussian blur kernel with standard deviation σscrn. We include the optical transfer function with ΔD = 0.0 D because we assumed that subjects in these experiments were focused on the screen where the blurred stimuli were presented. We chose a windowed edge stimulus because it is common in the blur-discrimination literature.
Figure 11.
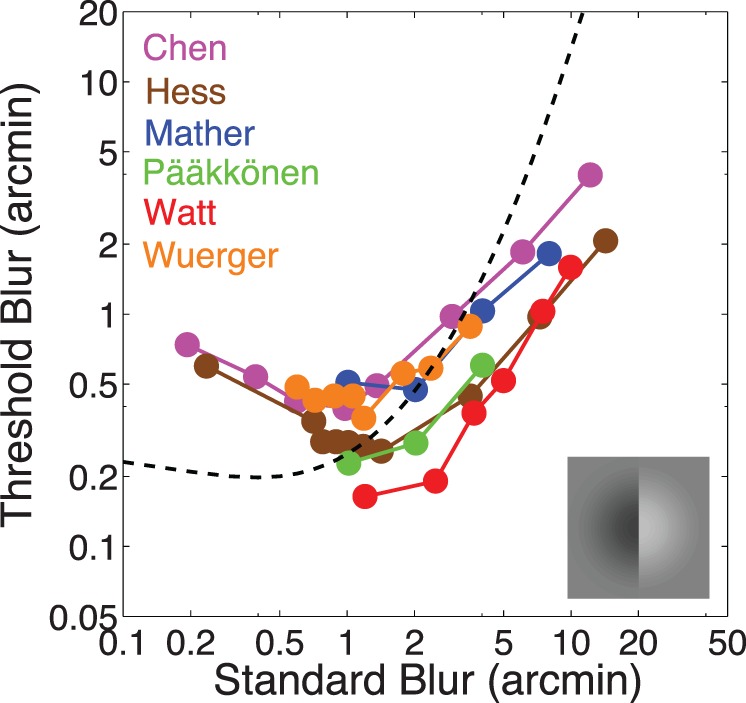
Model prediction of previous blur experiments. Figure adapted from Watson and Ahumada (2011).
In typical blur discrimination experiments, the standard stimulus is obtained by setting the standard deviation of the blur kernel to σs. The comparison stimulus is similarly obtained by setting the blur kernel standard deviation to σc. Thus, the predictions of our model are given by
 |
The dashed curve in Figure 11 shows the predictions of the model for the windowed edge target, using the parameter values estimated from our experiment. The model predicts a U-shaped function with a minimum at a Gaussian blur of about 1.0 arcmin. The symbols in Figure 11 show threshold blur functions for six blur discrimination experiments (see Watson & Ahumada, 2011, for descriptions of these experiments). Our model predicts a shallower decrease in low standard blur levels and a sharper increase at high standard blur levels. The shallow decrease in threshold is consistent with our results from Experiment 2. We note that the effective blur range in our experiment corresponds to roughly 0.0–3.0 arcmin of retinal blur.
Discussion
We measured how human defocus blur discrimination varies with defocus and with different natural image patches. We showed that discrimination thresholds strongly depend on the particular properties of the individual images being used to assess discrimination performance. In some circumstances, this fact may border on trivial. Featureless white walls or blank blue skies, for example, provide no information with which to assess the sharpness or blurriness of the retinal image. The retinal image of the wall or sky will be identical whether or not the eye is focused at the appropriate distance. Images like these, for which there is no visible contrast energy, may be considered degenerate cases. However, the images used in the present experiments were sampled to reflect the variety of scenes encountered in natural viewing (see Methods). For otherwise identical viewing conditions, simply changing the image patch resulted in marked changes in performance. That is, across different images having the same defocus level, defocus discrimination thresholds varied from ∼0.125 diopters to ∼0.625 diopters, roughly a fivefold change in threshold. Thus, in thinking about the discriminability along a given stimulus dimension, it is important to keep in mind that the particular properties of the images being used to assess discrimination may affect thresholds as much or more than the pedestal value of the relevant dimension from which a change in value is estimated.
In the second experiment, we found that the rise in blur threshold for sharply focused images (standards near 0.0 D) may be due to accommodative fluctuations and that the variability due to these fluctuations is additive. In other words, we can predict the effect of accommodative fluctuations by adding their effect to thresholds measured with accommodation frozen. This result would seem to be in conflict with earlier studies that found a rise in blur threshold at 0.0 D when accommodation is frozen (Campbell et al., 1959; Walsh & Charman, 1988). However, these earlier studies used a task in which blur was modulated sinusoidally around a standard level and the subject's task was to detect the modulation. As Walsh and Charman (1988) note, the modulation about 0.0 D is at twice the temporal frequency that occurs for modulation about defocus levels well away from 0.0 D. (Note that because of chromatic aberration this is strictly true only for the specific wavelengths that are in sharp focus.) What they don't point out is that maximum and minimum blur will be indistinguishable at the accommodated wavelength, and hence the amplitude of the modulation will be reduced by half (the temporal rms modulation of D is reduced by a factor 2.16). For monochromatic light, this alone should produce a factor-of-two increase in threshold at 0.0 D (which is in the ballpark of what they observed). For broadband (e.g., white) light, this effect may be somewhat reduced. Specifically, in the 0.0 D condition, only the long wavelengths will be modulating in blur about the sharp focus point, and thus the modulation in the short wavelengths will not be reduced by the factor of two.
In the third experiment, we found that holding overall retinal contrast energy approximately fixed has little effect on blur discrimination thresholds. Finally, we found that a contrast masking model with a spatial frequency weighting in the range known to best drive accommodation can account for our results.
Assessing visual performance with natural images
Performance in traditional psychophysical tasks is typically assessed by measuring discrimination thresholds with stereotyped artificial stimuli. Popular examples of such artificial stimuli are sine-wave gratings, Gabor patches, random dot images, and Maltese cross images. There are many reasons for following this approach. One of the most important is that simple, artificial stimuli are often easy to characterize mathematically and lend themselves well to parametric manipulation. The papers that report psychophysical results with these stimuli often conclude with statements indicating that human (or animal) discrimination thresholds of a given stimulus dimension are of such-and-such a size. For example, human defocus blur discrimination is often assessed with Maltese cross stimuli; thresholds are typically reported to be approximately 0.25 diopters with a 5-mm pupil (Wang & Ciuffreda, 2005; Watson & Ahumada, 2011). Our current understanding of visual processing mostly derives from experiments conducted in this manner.
The results of the present study suggest that such conclusions are potentially misleading. Artificial stimuli do not contain the statistical structure that most natural images contain. Visual systems are presumably tuned to process the images that are formed on the retinas during natural viewing. Therefore, when artificial images are used to assess visual performance, the differences between artificial and natural stimuli may result in performance measures that are nonrepresentative. For example, sine-wave gratings contain contrast energy only at a single frequency, Gabor patches contain contrast energy only over a narrow band of frequencies, random dot images have near delta function autocorrelation functions, and Maltese cross images have zero contrast energy within each arm of the cross. Natural images, on the other hand, typically have contrast energy distributed over a broad band of spatial frequencies that falls off approximately with the inverse of the square of spatial frequency, have autocorrelation functions that fall off with distance, and typically have at least some contrast energy at every location in the image.
Conclusions
There are three main findings of the present study. First, we found that image patch content drives discrimination thresholds in natural images. Next, we showed that the dipper effect in defocus discrimination thresholds might be due to accommodative fluctuations around fixation. Third, we showed that changes in overall contrast energy are not required to detect changes in defocus. Finally, we constructed a masking model that is sufficient to explain the results of our defocus discrimination experiment. The present study measured discrimination thresholds between two identical images. This paradigm is most applicable to accommodation, with which the visual system must compare changes in the defocus of the signal as the lens changes in power. However, when using defocus blur to estimate depth, the visual system must compare the relative defocus between two different images. A useful direction for future work would be to measure and model the ability of an observer to detect changes in defocus between different natural image patches.
Supplementary Material
Acknowledgments
Supported by NIH grant 2R01-EY011747, NSF grant IIS-1111328, and NIH Training Grant 1T32-EY021462.
Commercial relationships: none.
Corresponding author: Stephen Sebastian.
Email: sebastian@utexas.edu.
Address: Center for Perceptual Systems, University of Texas at Austin, Austin, TX, USA.
Appendix
Focus bias estimation and correction
The following procedure was used to estimate and correct for the focus bias for both subjects. The mean and standard deviation of a cumulative normal distribution and the focus bias were fit to each psychometric data set (all stimuli at all standard levels) simultaneously (Equation 1). A cumulative normal distribution, with mean, standard deviation and focus bias parameters was fit to each psychometric data set by finding the parameter values that maximized the likelihood of the data under the model (see Equation 2). The focus bias was fixed across all conditions. The focus bias for Subject 1 was 0.00 D; the focus bias for Subject 2 was −0.12 D.
Using this method to find the focus bias only improve the likelihood of the fit if the subject was focused behind the FM (i.e., negative focus bias). For Subject 2, this was the case. For Subject 1, we found that any assumed focus point in front of the monitor (i.e., positive focus bias) had no effect on the likelihood of the data under the model. For this reason, we set the focus bias of Subject 1 to 0.00 D.
Figure A1 shows the median improvement in thresholds across all patches for Subject 2 as a function of standard defocus level, given the focus bias correction. Thresholds were unchanged for Subject 1 (see above).
Figure A1.
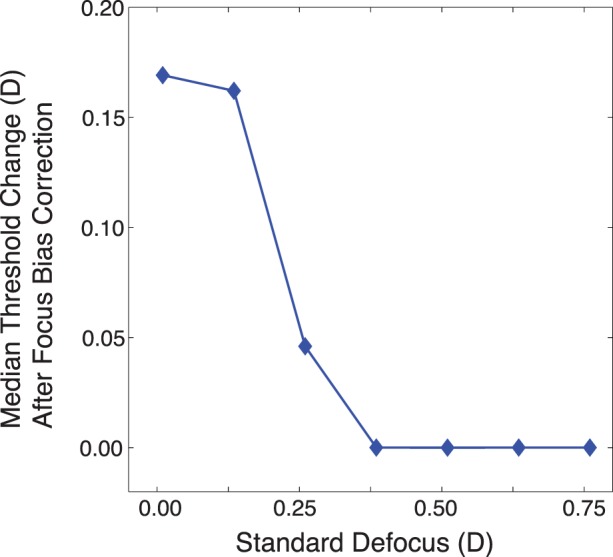
Effect of small focus errors on calculated discrimination thresholds for Subject 2. At a standard of 0.375 D, the thresholds were no longer affected by the estimated focus bias.
Contributor Information
Stephen Sebastian, Email: sebastian@utexas.edu.
Johannes Burge, jburge@sas.upenn.edu, http://burgelab.psych.upenn.edu.
Wilson S. Geisler, Email: w.geisler@utexas.edu.
References
- Akeley K.,, Watt S. J.,, Girshick A. R.,, Banks M. S.(2004). A stereo display prototype with multiple focal distances. ACM Transactions on Graphics, 233, 804–813. [Google Scholar]
- Artal P.,, Chen L.,, Fernández E. J.,, Singer B.,, Manzanera S.,, Williams D. R.(2004). Neural compensation for the eye's optical aberrations. Journal of Vision, 44: 4, 281–287, http://www.journalofvision.org/content/4/4/4, doi:10.1167/4.4.4. [PubMed] [Article] [DOI] [PubMed] [Google Scholar]
- Bharadwaj S. R.,, Schor C. M.(2006a). Dynamic control of ocular disaccommodation: First and second-order dynamics. Vision Research, 466–7, 1019–1037. [DOI] [PMC free article] [PubMed] [Google Scholar]
- Bharadwaj S. R.,, Schor C. M.(2006b). Initial destination of the disaccommodation step response. Vision Research, 4612, 1959–1972. [DOI] [PubMed] [Google Scholar]
- Burge J.,, Geisler W. S.(2011). Optimal defocus estimation in individual natural images. Proceedings of the National Academy of Sciences, USA, 10840, 16849–16854. [DOI] [PMC free article] [PubMed] [Google Scholar]
- Burge J.,, Geisler W. S.(2012). Optimal defocus estimates from individual images for autofocusing a digital camera. Proceedings of the IS&T/SPIE 47th Annual Meeting, January 2012, Burlingame, CA.
- Burge J.,, Geisler W. S.(2014). Optimal disparity estimation in natural stereo-images. Journal of Vision, 142: 1,, 1–18, http://www.journalofvision.org/content/14/2/1, doi:10.1167/14.2.1. [PubMed] [Article] [DOI] [PMC free article] [PubMed] [Google Scholar]
- Campbell F. W.,, Robson J. G.,, Westheimer G.(1959). Fluctuations of accommodation under steady viewing conditions. The Journal of Physiology, 1453, 579–594. [DOI] [PMC free article] [PubMed] [Google Scholar]
- Charman W. N.,, Heron G.(1988). Fluctuations in accommodation: A review. Ophthalmic and Physiological Optics, 82, 153–164. [DOI] [PubMed] [Google Scholar]
- Held R. T.,, Cooper E. A.,, Banks M. S.(2012). Blur and disparity are complementary cues to depth. Current Biology, 225, 426–431. [DOI] [PMC free article] [PubMed] [Google Scholar]
- Heron G.,, Charman W. N.,, Schor C.(2001). Dynamics of the accommodation response to abrupt changes in target vergence as a function of age. Vision Research, 414, 507–519. [DOI] [PubMed] [Google Scholar]
- Hoffman D. M.,, Girshick A. R.,, Akeley K.(2008). Vergence–accommodation conflicts hinder visual performance and cause visual fatigue. Journal of Vision, 83: 33,, 1–30, http://www.journalofvision.org/content/8/3/33, doi:10.1167/8.3.33. [PubMed] [Article] [DOI] [PMC free article] [PubMed] [Google Scholar]
- Kasthurirangan S.,, Vilupuru A. S.,, Glasser A.(2003). Amplitude dependent accommodative dynamics in humans. Vision Research, 4327, 2945–2956. [DOI] [PubMed] [Google Scholar]
- Kotulak J. C.,, Schor C. M.(1987). The effects of optical vergence, contrast, and luminance on the accommodative response to spatially bandpass filtered targets. Vision Research, 2710, 1797–1806. [DOI] [PubMed] [Google Scholar]
- Kruger P. B.,, Mathews S.,, Katz M.,, Aggarwala K. R.,, Nowbotsing S.(1997). Accommodation without feedback suggests directional signals specify ocular focus. Vision Research, 3718, 2511–2526. [DOI] [PubMed] [Google Scholar]
- Love G. D.,, Hoffman D. M.,, Hands P. J. W.,, Gao J.,, Kirby A. K.,, Banks M. S.(2009). High-speed switchable lens enables the development of a volumetric stereoscopic display. Optics Express, 1718, 15716–15725. [DOI] [PMC free article] [PubMed] [Google Scholar]
- MacKenzie K. J.,, Hoffman D. M.,, Watt S. J.(2010). Accommodation to multiple-focal-plane displays: Implications for improving stereoscopic displays and for accommodation control. Journal of Vision, 108: 22, 1–20, http://www.journalofvision.org/content/10/8/22, doi:10.1167/10.8.22. [PubMed] [Article]. [DOI] [PubMed] [Google Scholar]
- Mather G.,, Smith D. R. R.(2002). Blur discrimination and its relation to blur-mediated depth perception. Perception, 31, 1211–1219. [DOI] [PubMed] [Google Scholar]
- Nguyen V. A.,, Howard I. P.,, Allison R. S.(2005). Detection of the depth order of defocused images. Vision Research, 458, 1003–1011. [DOI] [PubMed] [Google Scholar]
- Ravikumar S.,, Akeley K.,, Banks M. S.(2011). Creating effective focus cues in multi-plane 3D displays. Optics Express, 1921, 20940–20952. [DOI] [PMC free article] [PubMed] [Google Scholar]
- Schaeffel F.,, Diether S.(1999). The growing eye: An autofocus system that works on very poor images. Vision Research, 399, 1585–1589. [DOI] [PubMed] [Google Scholar]
- Thibos L. N.,, Ye M.,, Zhang X.,, Bradley A.(1992). The chromatic eye: A new reduced-eye model of ocular chromatic aberration in humans. Applied Optics, 3119, 3594–3600. [DOI] [PubMed] [Google Scholar]
- Vishwanath D.,, Blaser E.(2010). Retinal blur and the perception of egocentric distance. Journal of Vision, 1010: 26,, 1–16, http://www.journalofvision.org/content/10/10/26, doi:10.1167/10.10.26. [PubMed] [Article] [DOI] [PubMed] [Google Scholar]
- Wallman J.,, Winawer J.(2004). Homeostasis of eye growth and the question of myopia. Neuron, 434, 447–468. [DOI] [PubMed] [Google Scholar]
- Walsh G.,, Charman W. N.(1988). Visual sensitivity to temporal change in focus and its relevance to the accommodation response. Vision Research, 2811, 1207–1221. [DOI] [PubMed] [Google Scholar]
- Wang B.,, Ciuffreda K. J.(2005). Foveal blur discrimination of the human eye. Ophthalmic and Physiological Optics, 251, 45–51. [DOI] [PubMed] [Google Scholar]
- Watson A. B.,, Ahumada A. J.(2011). Blur clarified: A review and synthesis of blur discrimination. Journal of Vision, 115: 10,, 1–23, http://www.journalofvision.org/content/11/5/10, doi:10.1167/11.5.10. [PubMed] [Article] [DOI] [PubMed] [Google Scholar]
- Watt S. J.,, Akeley K.,, Ernst M. O.,, Banks M. S.(2005). Focus cues affect perceived depth. Journal of Vision, 510: 7,, 1–29, http://www.journalofvision.org/content/5/10/7, doi:10.1167/5.10.7. [PubMed] [Article] [DOI] [PMC free article] [PubMed] [Google Scholar]
- Wildsoet C. F.,, Wong R.(1999). A far-sighted view of myopia. Nature Medicine, 58, 879. [DOI] [PubMed] [Google Scholar]
- Wyszecki G.,, Stiles W. S.(1982). Color science: Concepts and methods, quantitative data, and formulas. New York: Wiley. [Google Scholar]
Associated Data
This section collects any data citations, data availability statements, or supplementary materials included in this article.


