Abstract
Morphologic methods such as the Response Evaluation Criteria in Solid Tumors (RECIST) are considered as the gold standard for response assessment in the management of cancer. However, with the increasing clinical use of antineoplastic cytostatic agents and locoregional interventional therapies in hepatocellular carcinoma (HCC), conventional morphologic methods are confronting limitations in response assessment. Thus, there is an increasing interest in new imaging methods for response assessment, which can evaluate tumor biology such as vascular physiology, fibrosis, necrosis, and metabolism. In this review, we discuss various novel imaging methods for response assessment and compare them with the conventional ones in HCC.
Keywords: Computed tomography perfusion, diffusion weighted imaging, dynamic contrast-enhanced magnetic resonance imaging, hepatocellular carcinoma, positron emission tomography
Introduction
Hepatocellular carcinoma (HCC) is the sixth most common cancer and the third most common cause of cancer-related mortality worldwide.[1] Liver transplantation and resection are considered curative; however, most patients do not meet the selection criteria.[2] Molecular targeted agents such as sorafenib have shown a survival benefit for advanced HCC.[1,3,4,5] Locoregional therapies (LRTs) deliver toxic thermal/chemical/radioactive doses to tumors with minimal toxicity to the normal tissue. Among the various LRTs, transarterial chemoembolization (TACE) and yttrium-90 radioembolization are palliative, whereas thermal ablative methods provide results equivalent to surgical resection in early stage HCC.[6,7,8,9]
Imaging plays an important role in the management of HCC, and the efficacy of treatment is usually monitored and assessed radiologically. Therapeutic response has been assessed by morphologic methods using various criteria such as the World Health Organization (WHO) criteria or the Response Evaluation Criteria in Solid Tumors (RECIST) in cancer treatment.[10,11,12] These criteria are well established, and have been applied to response assessment of clinical trials in various kinds of tumors.[13] However, these morphologic evaluations have confronting limitations, including the presence of tumors that cannot be measured, poor measurement reproducibility, and mass lesions of unknown activity that persist following therapy.[12] Furthermore, with the increasing clinical use of molecular targeted agents in HCC, these criteria have confronting limitations in distinguishing viable tumor from necrotic or fibrotic tissue, and are not suitable to assess cellular death/apoptosis, because the new molecular targeted drugs act differently as compared to the traditional chemotherapeutic drugs and result in changes in blood flow (BF) of the tumor and cellular death without significant tumor shrinkage.
Faced with these limitations of morphologic tumor assessment criteria, new reliable markers including serum markers, metabolic and functional imaging markers based on computed tomography (CT), magnetic resonance imaging (MRI), or positron emission tomography (PET) to assess response to targeted agents or LRTs are desired urgently.[14,15,16,17] Imaging for tumor response assessment has evolved over the past few years as a result of advances in imaging modalities and the introduction of new functional imaging.[18,19] In this review, we discuss the conventional and new imaging methods to assess tumor response in the management of HCC.
Morphologic response assessment
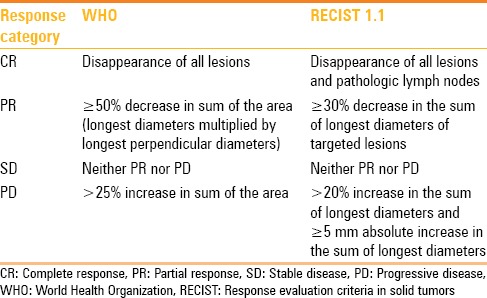
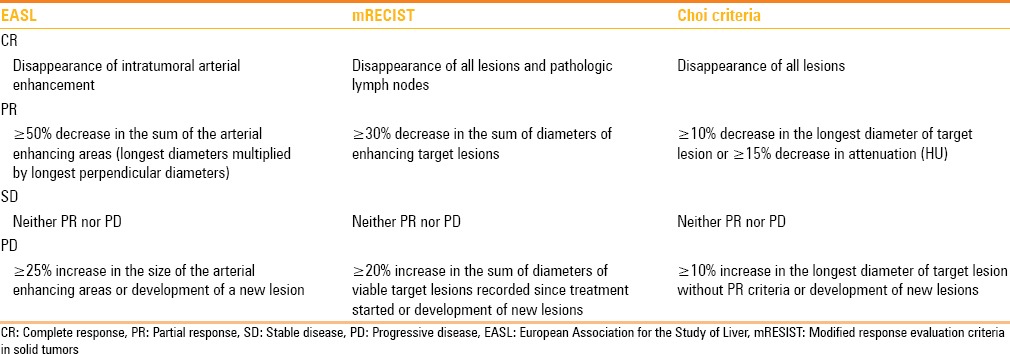
Clinical trials are mandatory in the evaluation of new tumor treatments. A common measure of the effect of an instituted therapy is the change of tumor size. In 1979, the WHO criteria established the concept of an overall assessment of tumor response by bidimensional lesion measurement, which is calculated by multiplying the maximum diameter by its longest perpendicular diameter, and determined the response to the therapy by evaluating the change from baseline while on treatment. Subsequently, RECIST criteria were introduced in 2000, updating the WHO criteria [Figure 1],[10] and brought many advances and facilitated comparison of the results among clinical trials. After extensive experience and validation in several chemotherapeutic trials in solid tumors, it was revised as RECIST 1.1 in 2009.[12] RECIST 1.1 is based on the measurement of a maximum of five target lesions, not exceeding two per organ; subsequently, the sum of the greatest diameters is recorded followed by a final classification.[12] Morphologic response criteria are summarized in Table 1. However, RECIST 1.1 has some limitations as follows: (1) it assumes that all lesions are spherical and that they decrease or increase in size uniformly; (2) necrosis is not taken into consideration in measuring the tumor size on the basis of RECIST, but recent LRTs or targeted therapies induce necrosis, which may indicate favorable tumor response;[20,21] and (3) RECIST 1.1 does not define the standard phase of contrast material enhancement for measuring specific tumors. This criterion may be important if the lesion is best seen during either arterial or venous phase of enhancement.
Figure 1 (A-D).
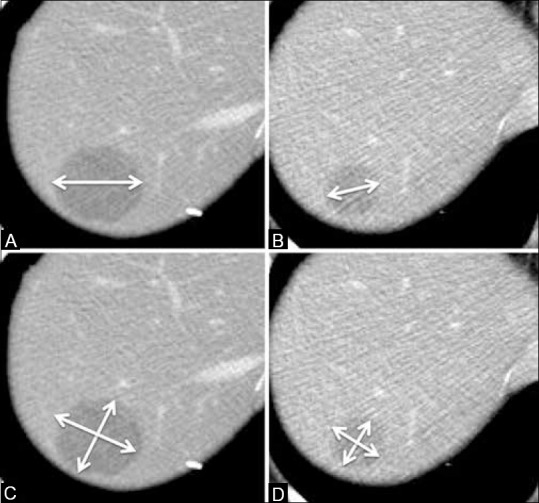
According to RECIST, this patient was categorized as partial response [from (A) to (B), 33% reduction in tumor diameter], while WHO criteria categorized this patient as stable disease [from (C) to (D), 43% reduction in tumor area]
Table 1.
Morphologic response criteria
Quantification of volumetric change can be a more accurate measure of the actual tumor size change than uni- or bidimensional measurements because volumetric analyses compensate for actual tumor shape rather than assuming it to be a sphere, an ellipsoid, or a cube. Welsh et al.[22] reported that volumetric analysis might be the preferred method to detect tumor progression, showing that RECIST might overestimate tumor burden compared to volumetric analysis. Sohaib et al.[23] demonstrated the accuracy and reproducibility of CT volumetric measurements in their phantom study. However, the optimal volumetric response evaluation criteria have not been defined. Volumetric analysis can be time consuming and laborious because volumetric analysis still relies on manual trace of tumor margins. In the future, a computerized tumor segmentation method with high reproducibility and reliability may allow for automatic lesion contouring and volumetric calculation.
Tumor viability and density assessment
Generally, targeted therapy agents induce reduction in tumor vascularization, provocation of necrotic area and sometimes cavitation in solid tumors, and these features have been reported in various targeted therapies of HCC.[3,24,25,26,27] Furthermore, all LRTs attempt to induce necrosis of the tumor, which may delay tumor shrinkage during the early post-treatment period. Given these limitations of morphologic response criteria, the European Association for the Study of Liver (EASL) proposed new response criteria in 2000 to take into account tumor necrosis induced by treatment.[28] Accordingly, necrosis is defined as non-enhanced areas on contrast-enhanced (CE) CT/MR within the treated tumor. In 2008, the American Association for the Study of Liver Disease (AASLD) proposed the modified RECIST (mRECIST) criteria, which conceptualized viable tumor measurements. The major change is the definition of the target lesion, which is no longer the whole lesion but only the contrast-enhanced portion of the hepatic lesion on the arterial phase image [Figure 2].[29,30] Previous reports demonstrated that EASL or mRECIST had better overall response rate than conventional morphologic criteria such as RECIST and WHO.[21,31,32] In addition, these criteria have shown a better correlation with survival. Gillmore et al.[20] reported that responses measured by EASL and mRECIST after 2-3 months of TACE were independently associated with survival, whereas RECIST 1.1 had no significant association with survival. In a recent retrospective study of HCC patients treated with sorafenib, patients categorized as responders according to mRECIST had a longer overall survival (OS) than the non-responders.[33] Similarly, Shim et al.[34] reported that responses measured by mRECIST and EASL were independent predictors for OS following TACE. Prajapati et al.[32] reported significant associations of mRECIST and EASL with survival, and also suggested that the response based on mRECIST showed a better correlation with survival than that based on EASL. Therefore, response evaluation based on the enhancement may enable more accurate response assessment in terms of survival.
Figure 2.
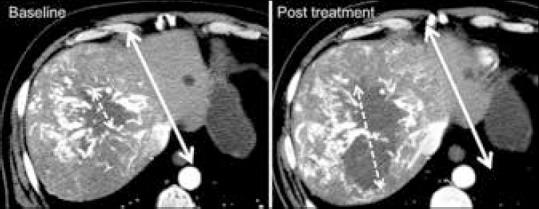
Arterial phase CECT of a 72-year-old man with HCC. The area of central necrosis increased after a tyrosine kinase inhibitor therapy (dashed line), while the change in tumor size was not obvious (solid line)
The tumor density analysis on CECT can be used as an additional method for response assessment.[35] On treating gastrointestinal stromal tumor (GIST) with imatinib mesylate, there was a decrease in density of the tumor, which was measured by drawing a region of interest (ROI) circumscribing the boundary of the tumor on the portal venous phase, while no change was observed in tumor size.[35,36] In GIST, a reduction in tumor Hounsfield Units (HU) greater than 15% was associated with better progression-free survival (PFS; Choi criteria).[37] In a recent study of HCC, Faivre et al.[38] demonstrated that the tumor response measured by Choi criteria was more sensitive than that measured by RECIST in detecting patients with longer time to progression after sunitinib therapy [Figure 3]. Criteria for tumor viability and density analysis are summarized in Table 2.
Figure 3.
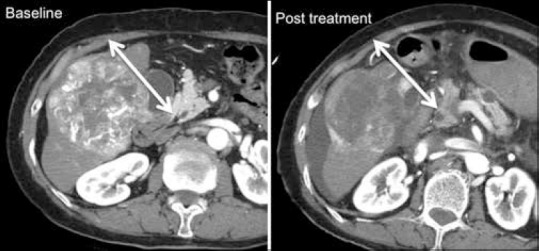
Portal-phase CECT of a 73-year-old woman with HCC. Tumor density changed obviously after antiangiogenic therapy
Table 2.
Summary of response criteria based on tumor viability and density
Diffusion-weighted imaging for response assessment
Motion of water molecules in tissue can be assessed by applying diffusion-weighting gradients to T2-weighted sequences. Various tissue types have unique diffusion characteristics, which are measured as the apparent diffusion coefficient (ADC) by the diffusion-weighted imaging (DWI) performed with a different gradient duration and amplitude (b-values). Because the movement of water molecules in the body tissues is restricted by various factors including cells, macromolecules, and fibers in tissue compartments, DWI can be exploited in clinical practice for indirect assessment of tissue properties such as cellularity, gland formation, perfusion, fibrosis, and cell death.[39,40] DWI has the potential to be an effective biomarker for monitoring the response to the treatment, and this potential in the management of cancer patients has been already discussed in a consensus meeting and a publication.[41]
Several studies have reported that the ADC value of HCC significantly increased after TACE.[42,43,44] A previous study reported that high baseline ADC value in HCC was associated with poor response to TACE, and that responding lesions showed a significant increase in ADC values than the non-responding ones after 48 h of TACE.[45] The results of antiangiogenic agents such as multitargeted tyrosine kinase inhibitors are controversial.[46,47,48] Schraml et al.[46] reported that on treating HCC with sorafenib, the tumor ADC initially decreased after 2-4 weeks of therapy and was followed by an increase after 10 weeks of the therapy. But, Lewin et al.[47] reported that the tumor ADC did not significantly change after sunitinib therapy. In HCC treated with sunitinib, significant increase in tumor ADC was observed after 2 weeks of the therapy with no change in tumor size, based on RECIST and mRECIST [Figure 4].[48]
Figure 4 (A-D).
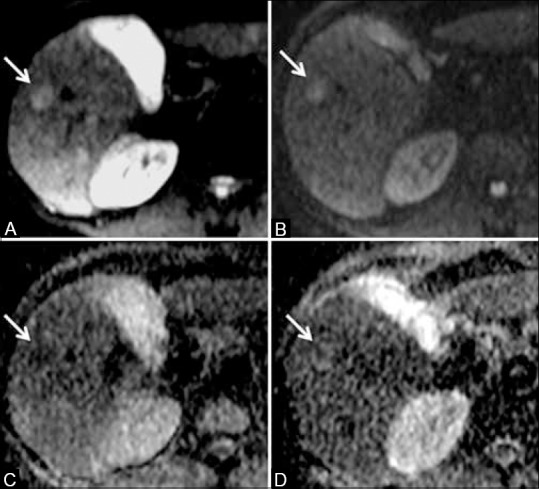
DWI at baseline (A) and post-treatment (B), and ADC maps at baseline (C) and post-treatment (D) of a 68-year-old man with HCC (arrows). ADC showed 55.1% increase after 2 weeks of tyrosine kinase inhibitor therapy
DWI can be a desirable imaging biomarker because it needs no radiation exposure and no contrast material. However, there are several limitations. Various factors including magnetic field strength, technical factors (e.g. b-value selection) and the ROI setting may affect accurate ADC assessment.[49,50] Furthermore, in the abdomen, the strong influence of motion due to breathing and vascular pulsation often results in image artifacts, which may lead to inaccurate ADC calculation.[51] Optimal time frame for precise response evaluation needs to be further studied.
Assessment of tumor vascular physiology
Because most of the targeted agents inhibit angiogenesis to control tumor progression, tissue perfusion analysis is a highly promising method to assess treatment response. In recent years, perfusion analysis has already been readily incorporated into the existing CT and MRI protocols, and most scanners are now equipped with sophisticated hardware platforms coupled with user-friendly software packages.[52]
In dynamic contrast-enhanced (DCE) CT, the temporal changes in attenuation following intravenous contrast material administration can be analyzed using the mathematical kinetic models such as compartmental or deconvolution analysis for contrast material exchange.[53,54] The common perfusion parameters of CT perfusion (CTP) are BF (flow rate through vasculature in a tissue), blood volume (BV, volume of flowing blood within a vasculature in a tissue), mean transit time (MTT, time taken to travel from artery to vein), and permeability surface area product (PS, total flux from plasma to interstitial space).[24,25,54] Chen et al.[55] demonstrated that in HCC treated with TACE, changes in CTP parameters of tumors were correlated with different responses of HCC to TACE. According to their findings, tumors of responders showed significant reduction in hepatic arterial perfusion and BV, while those of non-responders did not show significant changes. Yang et al.[56] reported that the values of hepatic arterial perfusion, total liver perfusion, and hepatic arterial perfusion index in tumors significantly decreased 4 weeks after TACE in comparison to those before TACE. Previous studies reported reduction in BF or BV after 10-12 days of antiangiogenic therapy without any significant change in tumor size based on RECIST [Figure 5].[24,25] Moreover, baseline CTP values have a potential to be a predictive biomarker for survival after antiangiogenic therapy.[25] Jiang et al.[25] demonstrated that HCC with higher baseline MTT correlated with favorable clinical outcome. A recent paper of CTP reported that the heterogeneity of tumor BF showed a good correlation with OS in HCC patients treated with an antiangiogenic agent.[57]
Figure 5 (A-D).
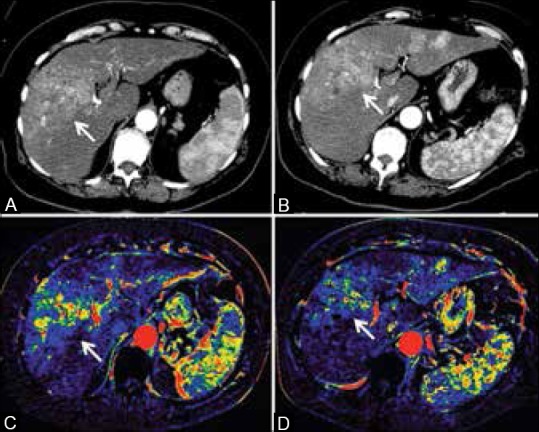
CECT images ((A) Baseline, (B) Post-treatment) and perfusion (blood volume) maps ((C) Baseline, (D) Post-treatment) of a 73-year-old woman with HCC. CTP demonstrated perfusion changes (–34% in blood volume) without significant changes in size and density after 2 weeks of antiangiogenic treatment
Similarly, DCE-MRI also enables quantification of tumor vascular physiology. The common DCE-MRI parameters are vascular permeability (Ktrans) and reverse reflux rate constant between extracellular space and plasma (Kep) and the fractional extravascular, extracellular space (Ve).[26,48,58,59,60] Several studies have demonstrated the value of DCE-MRI derived parameters for monitoring antiangiogenic therapies in various solid tumors.[26,48,58,59,60] In advanced HCC, DCE-MRI demonstrated reduction in Ktrans during antiangiogenic treatment and the change of Ktrans during treatment was related to better PFS and OS in clinical trials of tyrosine kinase inhibitors [Figure 6].[26,48,60,61] In a phase I study of pazopanib, patients who had either a partial response or stable disease showed significant reduction in Ktrans.[61] In a study of HCC patients treated with sorafenib and metronomic tegafur/uracil, reduction in Ktrans on day 14 was found to be an independent predictor for PFS and OS.[60] In a phase II study of sunitinib, higher baseline Ktrans and larger drop in Ve correlated with longer PFS.[48]
Figure 6 (A and B).
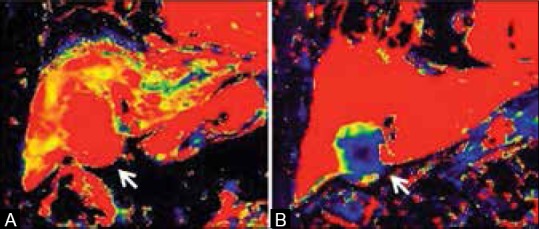
Ktrans maps of a 69-year-old man with HCC at baseline (A) and at 2 weeks after tyrosine kinase inhibitor therapy (B). Ktrans of the tumor showed 79.8% reduction after the therapy, while the change in tumor size was not obvious
CTP may be superior to DCE-MRI in accessibility and availability.[62,63] However, CTP essentially implies two major drawbacks: High radiation exposure and limited coverage of the anatomy. Thus, several efforts are being made with low-dose scanning techniques.[54] It is also still unclear which scanning protocol or mathematical model is optimal for abdominal organs. The definitions of the tumor ROI and the acquisition time also need further investigation in terms of reproducibility and reliability.[64,65] On the contrary, DCE-MRI has the advantage in spatial resolution and soft-tissue contrast without ionizing radiation. However, it is still expensive and technically challenging, and requires longer image acquisition times in comparison to CT.[62,63] DCE-MRI also lacks consensus on the standard protocol or the response evaluation criteria. However, given the importance of vascularization in cancer progression, perfusion technique can be a potentially powerful imaging biomarker to predict or detect early tumor response to the treatment.
Metabolic assessment
In PET, various kinds of tracers including 18F-fluorodeoxyglucose (18F-FDG),[66,67,68,69,70] 11C-acetate (11C-Act),[71,72,73,74] 11C- or 18F-F-choline (11C-Cho, 18F-F-Cho)[75] and 18F-fluorothymidine (18F-FLT)[76] enable quantitative measurement of various biological features such as metabolism, lipogenesis, cellular membrane turnover, and proliferation. It is, therefore, possible to noninvasively obtain information on a number of different biological properties of HCC. Integrated PET/CT and PET/MRI instruments have the potential for providing unique biological information in a single patient examination.
18F-FDG is the most widely available tracer, and 18F-FDG PET can assess the glucose metabolism in tumor. In HCC treated with TACE, an increase of 18F-FDG uptake in HCC was significantly associated with tumor burden and could provide effective information on the prognosis of the treatment response.[77] In addition, 18F-FDG uptake after TACE might be a favorable marker to assess tumor viability after TACE.[73,78] Similar findings have been reported in detecting local tumor progression following radiofrequency ablation of HCC.[79] Kim et al.[80] reported that in HCC patients treated with chemoradiation therapy, low 18F-FDG uptake was associated with longer PFS and OS and that the high 18F-FDG uptake group was more likely to have extrahepatic metastasis within 6 months. However, because the expression of glucose-6-phosphatase enabling 18F-FDG to accumulate in tumor cells varies widely in HCC, 18F-FDG PET shows poor sensitivity for detection of HCC, ranging from 50 to 55%.[81,82,83,84,85] Thus, the role of 18F-FDG PET in assessing treatment response is still limited in HCC, and further investigations are needed. HCC-specific tracers may be the key in the future.
Conclusion
Morphologic assessment, which has served as the gold standard for a long time, is confronting limitations. However, recent advances in imaging modalities and the introduction of new functional imaging pave the way to assess tumor response based on tumor biology in vivo. As antiangiogenic therapy and LRTs have become the standard of care for HCC patients, such functional imaging techniques for response assessment are of paramount importance. In this review, we suggest that the evaluation of tumor response should include not only the morphologic change but also functional changes such as enhancement, density, perfusion, diffusion, and metabolism. Functional imaging will serve as a biomarker for response assessment of HCC, and radiologists must become familiar with these new techniques.
Footnotes
Source of Support: Nil
Conflict of Interest: None declared.
References
- 1.Zhu AX, Duda DG, Sahani DV, Jain RK. HCC and angiogenesis: Possible targets and future directions. Nat Rev Clin Oncol. 2011;8:292–301. doi: 10.1038/nrclinonc.2011.30. [DOI] [PMC free article] [PubMed] [Google Scholar]
- 2.Mazzaferro V, Regalia E, Doci R, Andreola S, Pulvirenti A, Bozzetti F, et al. Liver transplantation for the treatment of small hepatocellular carcinomas in patients with cirrhosis. N Engl J Med. 1996;334:693–9. doi: 10.1056/NEJM199603143341104. [DOI] [PubMed] [Google Scholar]
- 3.Llovet JM, Ricci S, Mazzaferro V, Hilgard P, Gane E, Blanc JF, et al. Sorafenib in advanced hepatocellular carcinoma. N Engl J Med. 2008;359:378–90. doi: 10.1056/NEJMoa0708857. [DOI] [PubMed] [Google Scholar]
- 4.Cheng AL, Kang YK, Chen Z, Tsao CJ, Qin S, Kim JS, et al. Efficacy and safety of sorafenib in patients in the Asia-Pacific region with advanced hepatocellular carcinoma: A phase III randomised, double-blind, placebo-controlled trial. Lancet Oncol. 2009;10:25–34. doi: 10.1016/S1470-2045(08)70285-7. [DOI] [PubMed] [Google Scholar]
- 5.Cheng A, Kang Y, Lin D, Park J, Kudo M, Qin S, et al. Phase III trial of sunitinib (Su) versus sorafenib (So) in advanced hepatocellular carcinoma (HCC) J Clin Oncol. 2011;29(Suppl) abstr 4000. [Google Scholar]
- 6.Salem R, Lewandowski RJ, Mulcahy MF, Riaz A, Ryu RK, Ibrahim S, et al. Radioembolization for hepatocellular carcinoma using Yttrium-90 microspheres: A comprehensive report of long-term outcomes. Gastroenterology. 2010;138:52–64. doi: 10.1053/j.gastro.2009.09.006. [DOI] [PubMed] [Google Scholar]
- 7.Lewandowski RJ, Kulik LM, Riaz A, Senthilnathan S, Mulcahy MF, Ryu RK, et al. A comparative analysis of transarterial downstaging for hepatocellular carcinoma: Chemoembolization versus radioembolization. Am J Transplant. 2009;9:1920–8. doi: 10.1111/j.1600-6143.2009.02695.x. [DOI] [PubMed] [Google Scholar]
- 8.Llovet JM, Real MI, Montaña X, Planas R, Coll S, Aponte J, et al. Barcelona Liver Cancer Group. Arterial embolisation or chemoembolisation versus symptomatic treatment in patients with unresectable hepatocellular carcinoma: A randomised controlled trial. Lancet. 2002;359:1734–9. doi: 10.1016/S0140-6736(02)08649-X. [DOI] [PubMed] [Google Scholar]
- 9.Cho YK, Rhim H, Noh S. Radiofrequency ablation versus surgical resection as primary treatment of hepatocellular carcinoma meeting the Milan criteria: A systematic review. J Gastroenterol Hepatol. 2011;26:1354–60. doi: 10.1111/j.1440-1746.2011.06812.x. [DOI] [PubMed] [Google Scholar]
- 10.Therasse P, Arbuck SG, Eisenhauer EA, Wanders J, Kaplan RS, Rubinstein L, et al. New guidelines to evaluate the response to treatment in solid tumors. European Organization for Research and Treatment of Cancer, National Cancer Institute of the United States, National Cancer Institute of Canada. J Natl Cancer Inst. 2000;92:205–16. doi: 10.1093/jnci/92.3.205. [DOI] [PubMed] [Google Scholar]
- 11.Nishino M, Jackman DM, Hatabu H, Yeap BY, Cioffredi LA, Yap JT, et al. New response evaluation criteria in solid tumors (RECIST) guidelines for advanced non-small cell lung cancer: Comparison with original RECIST and impact on assessment of tumor response to targeted therapy. AJR Am J Roentgenol. 2010;195:W221–8. doi: 10.2214/AJR.09.3928. [DOI] [PMC free article] [PubMed] [Google Scholar]
- 12.Eisenhauer EA, Therasse P, Bogaerts J, Schwartz LH, Sargent D, Ford R, et al. New response evaluation criteria in solid tumours: Revised RECIST guideline (version 1.1) Eur J Cancer. 2009;45:228–47. doi: 10.1016/j.ejca.2008.10.026. [DOI] [PubMed] [Google Scholar]
- 13.Yaghmai V, Miller FH, Rezai P, Benson AB, 3rd, Salem R. Response to treatment series: Part 2, tumor response assessment--using new and conventional criteria. AJR Am J Roentgenol. 2011;197:18–27. doi: 10.2214/AJR.11.6581. [DOI] [PubMed] [Google Scholar]
- 14.Murakami T, Imai Y, Okada M, Hyodo T, Lee WJ, Kim MJ, et al. Ultrasonography, computed tomography and magnetic resonance imaging of hepatocellular carcinoma: Toward improved treatment decisions. Oncology. 2011;81(Suppl 1):86–99. doi: 10.1159/000333267. [DOI] [PubMed] [Google Scholar]
- 15.Taylor M, Rossler J, Geoerger B, Vassal G, Farace F. New anti-angiogenic strategies in pediatric solid malignancies: Agents and biomarkers of a near future. Expert Opin Investig Drugs. 2010;19:859–74. doi: 10.1517/13543784.2010.487654. [DOI] [PubMed] [Google Scholar]
- 16.Hennedige T, Venkatesh SK. Imaging of hepatocellular carcinoma: Diagnosis, staging and treatment monitoring. Cancer Imaging. 2013;12:530–47. doi: 10.1102/1470-7330.2012.0044. [DOI] [PMC free article] [PubMed] [Google Scholar]
- 17.Shields AF. Positron emission tomography measurement of tumor metabolism and growth: Its expanding role in oncology. Mol Imaging Biol. 2006;8:141–50. doi: 10.1007/s11307-006-0039-2. [DOI] [PubMed] [Google Scholar]
- 18.Hayano K, Fuentes-Orrego JM, Sahani DV. New approaches for precise response evaluation in hepatocellular carcinoma. World J Gastroenterol. 2014;20:3059–68. doi: 10.3748/wjg.v20.i12.3059. [DOI] [PMC free article] [PubMed] [Google Scholar]
- 19.Jiang T, Zhu AX, Sahani DV. Established and novel imaging biomarkers for assessing response to therapy in hepatocellular carcinoma. J Hepatol. 2013;58:169–77. doi: 10.1016/j.jhep.2012.08.022. [DOI] [PubMed] [Google Scholar]
- 20.Gillmore R, Stuart S, Kirkwood A, Hameeduddin A, Woodward N, Burroughs AK, et al. EASL and mRECIST responses are independent prognostic factors for survival in hepatocellular cancer patients treated with transarterial embolization. J Hepatol. 2011;55:1309–16. doi: 10.1016/j.jhep.2011.03.007. [DOI] [PubMed] [Google Scholar]
- 21.Forner A, Ayuso C, Varela M, Rimola J, Hessheimer AJ, de Lope CR, et al. Evaluation of tumor response after locoregional therapies in hepatocellular carcinoma: Are response evaluation criteria in solid tumors reliable? Cancer. 2009;115:616–23. doi: 10.1002/cncr.24050. [DOI] [PubMed] [Google Scholar]
- 22.Welsh JL, Bodeker K, Fallon E, Bhatia SK, Buatti JM, Cullen JJ. Comparison of response evaluation criteria in solid tumors with volumetric measurements for estimation of tumor burden in pancreatic adenocarcinoma and hepatocellular carcinoma. Am J Surg. 2012;204:580–5. doi: 10.1016/j.amjsurg.2012.07.007. [DOI] [PMC free article] [PubMed] [Google Scholar]
- 23.Sohaib SA, Turner B, Hanson JA, Farquharson M, Oliver RT, Reznek RH. CT assessment of tumour response to treatment: Comparison of linear, cross-sectional and volumetric measures of tumour size. Br J Radiol. 2000;73:1178–84. doi: 10.1259/bjr.73.875.11144795. [DOI] [PubMed] [Google Scholar]
- 24.Zhu AX, Holalkere NS, Muzikansky A, Horgan K, Sahani DV. Early antiangiogenic activity of bevacizumab evaluated by computed tomography perfusion scan in patients with advanced hepatocellular carcinoma. Oncologist. 2008;13:120–5. doi: 10.1634/theoncologist.2007-0174. [DOI] [PubMed] [Google Scholar]
- 25.Jiang T, Kambadakone A, Kulkarni NM, Zhu AX, Sahani DV. Monitoring response to antiangiogenic treatment and predicting outcomes in advanced hepatocellular carcinoma using image biomarkers, CT perfusion, tumor density, and tumor size (RECIST) Invest Radiol. 2012;47:11–7. doi: 10.1097/RLI.0b013e3182199bb5. [DOI] [PubMed] [Google Scholar]
- 26.Zhu AX, Sahani DV, Duda DG, di Tomaso E, Ancukiewicz M, Catalano OA, et al. Efficacy, safety, and potential biomarkers of sunitinib monotherapy in advanced hepatocellular carcinoma: A phase II study. J Clin Oncol. 2009;27:3027–35. doi: 10.1200/JCO.2008.20.9908. [DOI] [PMC free article] [PubMed] [Google Scholar]
- 27.Abou-Alfa GK, Schwartz L, Ricci S, Amadori D, Santoro A, Figer A, et al. Phase II study of sorafenib in patients with advanced hepatocellular carcinoma. J Clin Oncol. 2006;24:4293–300. doi: 10.1200/JCO.2005.01.3441. [DOI] [PubMed] [Google Scholar]
- 28.Bruix J, Sherman M, Llovet JM, Beaugrand M, Lencioni R, Burroughs AK, et al. EASL Panel of Experts on HCC. Clinical management of hepatocellular carcinoma. Conclusions of the Barcelona-2000 EASL conference. European Association for the Study of the Liver. J Hepatol. 2001;35:421–30. doi: 10.1016/s0168-8278(01)00130-1. [DOI] [PubMed] [Google Scholar]
- 29.Lencioni R, Llovet JM. Modified RECIST (mRECIST) assessment for hepatocellular carcinoma. Semin Liver Dis. 2010;30:52–60. doi: 10.1055/s-0030-1247132. [DOI] [PubMed] [Google Scholar]
- 30.Llovet JM, Di Bisceglie AM, Bruix J, Kramer BS, Lencioni R, Zhu AX, et al. Panel of Experts in HCC-Design Clinical Trials. Design and endpoints of clinical trials in hepatocellular carcinoma. J Natl Cancer Inst. 2008;100:698–711. doi: 10.1093/jnci/djn134. [DOI] [PubMed] [Google Scholar]
- 31.Riaz A, Miller FH, Kulik LM, Nikolaidis P, Yaghmai V, Lewandowski RJ, et al. Imaging response in the primary index lesion and clinical outcomes following transarterial locoregional therapy for hepatocellular carcinoma. JAMA. 2010;303:1062–9. doi: 10.1001/jama.2010.262. [DOI] [PMC free article] [PubMed] [Google Scholar]
- 32.Prajapati HJ, Spivey JR, Hanish SI, El-Rayes BF, Kauh JS, Chen Z, et al. mRECIST and EASL responses at early time point by contrast-enhanced dynamic MRI predict survival in patients with unresectable hepatocellular carcinoma (HCC) treated by doxorubicin drug-eluting beads transarterial chemoembolization (DEB TACE) Ann Oncol. 2013;24:965–73. doi: 10.1093/annonc/mds605. [DOI] [PubMed] [Google Scholar]
- 33.Edeline J, Boucher E, Rolland Y, Vauléon E, Pracht M, Perrin C, et al. Comparison of tumor response by response evaluation criteria in solid tumors (RECIST) and modified RECIST in patients treated with sorafenib for hepatocellular carcinoma. Cancer. 2012;118:147–56. doi: 10.1002/cncr.26255. [DOI] [PubMed] [Google Scholar]
- 34.Shim JH, Lee HC, Kim SO, Shin YM, Kim KM, Lim YS, et al. Which response criteria best help predict survival of patients with hepatocellular carcinoma following chemoembolization? A validation study of old and new models. Radiology. 2012;262:708–18. doi: 10.1148/radiol.11110282. [DOI] [PubMed] [Google Scholar]
- 35.Choi H, Charnsangavej C, Faria SC, Macapinlac HA, Burgess MA, Patel SR, et al. Correlation of computed tomography and positron emission tomography in patients with metastatic gastrointestinal stromal tumor treated at a single institution with imatinib mesylate: Proposal of new computed tomography response criteria. J Clin Oncol. 2007;25:1753–9. doi: 10.1200/JCO.2006.07.3049. [DOI] [PubMed] [Google Scholar]
- 36.Choi H, Charnsangavej C, de Castro Faria S, Tamm EP, Benjamin RS, Johnson MM, et al. CT evaluation of the response of gastrointestinal stromal tumors after imatinib mesylate treatment: A quantitative analysis correlated with FDG PET findings. AJR Am J Roentgenol. 2004;183:1619–28. doi: 10.2214/ajr.183.6.01831619. [DOI] [PubMed] [Google Scholar]
- 37.Benjamin RS, Choi H, Macapinlac HA, Burgess MA, Patel SR, Chen LL, et al. We should desist using RECIST, at least in GIST. J Clin Oncol. 2007;25:1760–4. doi: 10.1200/JCO.2006.07.3411. [DOI] [PubMed] [Google Scholar]
- 38.Faivre S, Zappa M, Vilgrain V, Boucher E, Douillard JY, Lim HY, et al. Changes in tumor density in patients with advanced hepatocellular carcinoma treated with sunitinib. Clin Cancer Res. 2011;17:4504–12. doi: 10.1158/1078-0432.CCR-10-1708. [DOI] [PubMed] [Google Scholar]
- 39.Aoyagi T, Shuto K, Okazumi S, Hayano K, Satoh A, Saitoh H, et al. Apparent diffusion coefficient correlation with oesophageal tumour stroma and angiogenesis. Eur Radiol. 2012;22:1172–7. doi: 10.1007/s00330-011-2359-0. [DOI] [PubMed] [Google Scholar]
- 40.Goh V, Sarker D, Osmany S, Cook GJ. Functional imaging techniques in hepatocellular carcinoma. Eur J Nucl Med Mol Imaging. 2012;39:1070–9. doi: 10.1007/s00259-012-2096-x. [DOI] [PubMed] [Google Scholar]
- 41.Padhani AR, Liu G, Koh DM, Chenevert TL, Thoeny HC, Takahara T, et al. Diffusion-weighted magnetic resonance imaging as a cancer biomarker: Consensus and recommendations. Neoplasia. 2009;11:102–25. doi: 10.1593/neo.81328. [DOI] [PMC free article] [PubMed] [Google Scholar]
- 42.Kamel IR, Bluemke DA, Ramsey D, Abusedera M, Torbenson M, Eng J, et al. Role of diffusion-weighted imaging in estimating tumor necrosis after chemoembolization of hepatocellular carcinoma. AJR Am J Roentgenol. 2003;181:708–10. doi: 10.2214/ajr.181.3.1810708. [DOI] [PubMed] [Google Scholar]
- 43.Goshima S, Kanematsu M, Kondo H, Yokoyama R, Tsuge Y, Shiratori Y, et al. Evaluating local hepatocellular carcinoma recurrence post-transcatheter arterial chemoembolization: Is diffusion-weighted MRI reliable as an indicator? J Magn Reson Imaging. 2008;27:834–9. doi: 10.1002/jmri.21316. [DOI] [PubMed] [Google Scholar]
- 44.Chen CY, Li CW, Kuo YT, Jaw TS, Wu DK, Jao JC, et al. Early response of hepatocellular carcinoma to transcatheter arterial chemoembolization: Choline levels and MR diffusion constants--initial experience. Radiology. 2006;239:448–56. doi: 10.1148/radiol.2392042202. [DOI] [PubMed] [Google Scholar]
- 45.Yuan Z, Ye XD, Dong S, Xu LC, Xu XY, Liu SY, et al. Role of magnetic resonance diffusion-weighted imaging in evaluating response after chemoembolization of hepatocellular carcinoma. Eur J Radiol. 2010;75:e9–14. doi: 10.1016/j.ejrad.2009.05.040. [DOI] [PubMed] [Google Scholar]
- 46.Schraml C, Schwenzer NF, Martirosian P, Bitzer M, Lauer U, Claussen CD, et al. Diffusion-weighted MRI of advanced hepatocellular carcinoma during sorafenib treatment: Initial results. AJR Am J Roentgenol. 2009;193:W301–7. doi: 10.2214/AJR.08.2289. [DOI] [PubMed] [Google Scholar]
- 47.Lewin M, Fartoux L, Vignaud A, Arrivé L, Menu Y, Rosmorduc O. The diffusion-weighted imaging perfusion fraction f is a potential marker of sorafenib treatment in advanced hepatocellular carcinoma: A pilot study. Eur Radiol. 2011;21:281–90. doi: 10.1007/s00330-010-1914-4. [DOI] [PubMed] [Google Scholar]
- 48.Sahani DV, Jiang T, Hayano K, Duda DG, Catalano OA, Ancukiewicz M, et al. Magnetic resonance imaging biomarkers in hepatocellular carcinoma: Association with response and circulating biomarkers after sunitinib therapy. J Hematol Oncol. 2013;6:51. doi: 10.1186/1756-8722-6-51. [DOI] [PMC free article] [PubMed] [Google Scholar]
- 49.Dale BM, Braithwaite AC, Boll DT, Merkle EM. Field strength and diffusion encoding technique affect the apparent diffusion coefficient measurements in diffusion-weighted imaging of the abdomen. Invest Radiol. 2010;45:104–8. doi: 10.1097/RLI.0b013e3181c8ceac. [DOI] [PubMed] [Google Scholar]
- 50.Ogura A, Hayakawa K, Miyati T, Maeda F. Imaging parameter effects in apparent diffusion coefficient determination of magnetic resonance imaging. Eur J Radiol. 2011;77:185–8. doi: 10.1016/j.ejrad.2009.06.031. [DOI] [PubMed] [Google Scholar]
- 51.Marcus CD, Ladam-Marcus V, Cucu C, Bouché O, Lucas L, Hoeffel C. Imaging techniques to evaluate the response to treatment in oncology: Current standards and perspectives. Crit Rev Oncol Hematol. 2009;72:217–38. doi: 10.1016/j.critrevonc.2008.07.012. [DOI] [PubMed] [Google Scholar]
- 52.Miles KA. Perfusion CT for the assessment of tumour vascularity: Which protocol? Br J Radiol. 2003;76:S36–42. doi: 10.1259/bjr/18486642. [DOI] [PubMed] [Google Scholar]
- 53.Miles KA, Hayball M, Dixon AK. Colour perfusion imaging: A new application of computed tomography. Lancet. 1991;337:643–5. doi: 10.1016/0140-6736(91)92455-b. [DOI] [PubMed] [Google Scholar]
- 54.Kambadakone AR, Sahani DV. Body perfusion CT: Technique, clinical applications, and advances. Radiol Clin North Am. 2009;47:161–78. doi: 10.1016/j.rcl.2008.11.003. [DOI] [PubMed] [Google Scholar]
- 55.Chen G, Ma DQ, He W, Zhang BF, Zhao LQ. Computed tomography perfusion in evaluating the therapeutic effect of transarterial chemoembolization for hepatocellular carcinoma. World J Gastroenterol. 2008;14:5738–43. doi: 10.3748/wjg.14.5738. [DOI] [PMC free article] [PubMed] [Google Scholar]
- 56.Yang L, Zhang XM, Tan BX, Liu M, Dong GL, Zhai ZH. Computed tomographic perfusion imaging for the therapeutic response of chemoembolization for hepatocellular carcinoma. J Comput Assist Tomogr. 2012;36:226–30. doi: 10.1097/RCT.0b013e318245c23c. [DOI] [PubMed] [Google Scholar]
- 57.Hayano K, Lee SH, Yoshida H, Zhu AX, Sahani DV. Fractal analysis of CT perfusion images for evaluation of antiangiogenic treatment and survival in hepatocellular carcinoma. Acad Radiol. 2014;21:654–60. doi: 10.1016/j.acra.2014.01.020. [DOI] [PubMed] [Google Scholar]
- 58.Hahn OM, Yang C, Medved M, Karczmar G, Kistner E, Karrison T, et al. Dynamic contrast-enhanced magnetic resonance imaging pharmacodynamic biomarker study of sorafenib in metastatic renal carcinoma. J Clin Oncol. 2008;26:4572–8. doi: 10.1200/JCO.2007.15.5655. [DOI] [PMC free article] [PubMed] [Google Scholar]
- 59.Flaherty KT, Rosen MA, Heitjan DF, Gallagher ML, Schwartz B, Schnall MD, et al. Pilot study of DCE-MRI to predict progression-free survival with sorafenib therapy in renal cell carcinoma. Cancer Biol Ther. 2008;7:496–501. doi: 10.4161/cbt.7.4.5624. [DOI] [PubMed] [Google Scholar]
- 60.Hsu CY, Shen YC, Yu CW, Hsu C, Hu FC, Hsu CH, et al. Dynamic contrast-enhanced magnetic resonance imaging biomarkers predict survival and response in hepatocellular carcinoma patients treated with sorafenib and metronomic tegafur/uracil. J Hepatol. 2011;55:858–65. doi: 10.1016/j.jhep.2011.01.032. [DOI] [PubMed] [Google Scholar]
- 61.Yau T, Chen PJ, Chan P, Curtis CM, Murphy PS, Suttle AB, et al. Phase I dose-finding study of pazopanib in hepatocellular carcinoma: Evaluation of early efficacy, pharmacokinetics, and pharmacodynamics. Clin Cancer Res. 2011;17:6914–23. doi: 10.1158/1078-0432.CCR-11-0793. [DOI] [PubMed] [Google Scholar]
- 62.Lavini C, Verhoeff JJ. Reproducibility of the gadolinium concentration measurements and of the fitting parameters of the vascular input function in the superior sagittal sinus in a patient population. Magn Reson Imaging. 2010;28:1420–30. doi: 10.1016/j.mri.2010.06.017. [DOI] [PubMed] [Google Scholar]
- 63.Vlieger EJ, Lavini C, Majoie CB, den Heeten GJ. Reproducibility of functional MR imaging results using two different MR systems. AJNR Am J Neuroradiol. 2003;24:652–7. [PMC free article] [PubMed] [Google Scholar]
- 64.Goh V, Halligan S, Hugill JA, Gartner L, Bartram CI. Quantitative colorectal cancer perfusion measurement using dynamic contrast-enhanced multidetector-row computed tomography: Effect of acquisition time and implications for protocols. J Comput Assist Tomogr. 2005;29:59–63. doi: 10.1097/01.rct.0000152847.00257.d7. [DOI] [PubMed] [Google Scholar]
- 65.Ng CS, Chandler AG, Wei W, Herron DH, Anderson EF, Kurzrock R, et al. Reproducibility of CT perfusion parameters in liver tumors and normal liver. Radiology. 2011;260:762–70. doi: 10.1148/radiol.11110331. [DOI] [PMC free article] [PubMed] [Google Scholar]
- 66.Talbot JN, Gutman F, Fartoux L, Grange JD, Ganne N, Kerrou K, et al. PET/CT in patients with hepatocellular carcinoma using [(18) F] fluorocholine: Preliminary comparison with [(18) F] FDG PET/CT. Eur J Nucl Med Mol Imaging. 2006;33:1285–9. doi: 10.1007/s00259-006-0164-9. [DOI] [PubMed] [Google Scholar]
- 67.Talbot JN, Fartoux L, Balogova S, Nataf V, Kerrou K, Gutman F, et al. Detection of hepatocellular carcinoma with PET/CT: A prospective comparison of 18F-fluorocholine and 18F-FDG in patients with cirrhosis or chronic liver disease. J Nucl Med. 2010;51:1699–706. doi: 10.2967/jnumed.110.075507. [DOI] [PubMed] [Google Scholar]
- 68.Yamamoto Y, Nishiyama Y, Kameyama R, Okano K, Kashiwagi H, Deguchi A, et al. Detection of hepatocellular carcinoma using 11C-choline PET: Comparison with 18F-FDG PET. J Nucl Med. 2008;49:1245–8. doi: 10.2967/jnumed.108.052639. [DOI] [PubMed] [Google Scholar]
- 69.Park JW, Kim JH, Kim SK, Kang KW, Park KW, Choi JI, et al. A prospective evaluation of 18F-FDG and 11C-acetate PET/CT for detection of primary and metastatic hepatocellular carcinoma. J Nucl Med. 2008;49:1912–21. doi: 10.2967/jnumed.108.055087. [DOI] [PubMed] [Google Scholar]
- 70.Ho CL, Chen S, Yeung DW, Cheng TK. Dual-tracer PET/CT imaging in evaluation of metastatic hepatocellular carcinoma. J Nucl Med. 2007;48:902–9. doi: 10.2967/jnumed.106.036673. [DOI] [PubMed] [Google Scholar]
- 71.Ho CL, Yu SC, Yeung DW. 11C-acetate PET imaging in hepatocellular carcinoma and other liver masses. J Nucl Med. 2003;44:213–21. [PubMed] [Google Scholar]
- 72.Hwang KH, Choi DJ, Lee SY, Lee MK, Choe W. Evaluation of patients with hepatocellular carcinomas using [(11) C] acetate and [(18) F] FDG PET/CT: A preliminary study. Appl Radiat Isot. 2009;67:1195–8. doi: 10.1016/j.apradiso.2009.02.011. [DOI] [PubMed] [Google Scholar]
- 73.Salem N, Kuang Y, Corn D, Erokwu B, Kolthammer JA, Tian H, et al. (Methyl) 1-(11) c]-acetate metabolism in hepatocellular carcinoma. Mol Imaging Biol. 2011;13:140–51. doi: 10.1007/s11307-010-0308-y. [DOI] [PMC free article] [PubMed] [Google Scholar]
- 74.Yun M, Bang SH, Kim JW, Park JY, Kim KS, Lee JD. The importance of acetyl coenzyme A synthetase for 11C-acetate uptake and cell survival in hepatocellular carcinoma. J Nucl Med. 2009;50:1222–8. doi: 10.2967/jnumed.109.062703. [DOI] [PubMed] [Google Scholar]
- 75.Salem N, Kuang Y, Wang F, Maclennan GT, Lee Z. PET imaging of hepatocellular carcinoma with 2-deoxy-2[18F] fluoro-D-glucose, 6-deoxy-6[18F] fluoro-D-glucose, [1-11C]-acetate and [N-methyl-11C]-choline. Q J Nucl Med Mol Imaging. 2009;53:144–56. [PubMed] [Google Scholar]
- 76.Eckel F, Herrmann K, Schmidt S, Hillerer C, Wieder HA, Krause BJ, et al. Imaging of proliferation in hepatocellular carcinoma with the in vivo marker 18F-fluorothymidine. J Nucl Med. 2009;50:1441–7. doi: 10.2967/jnumed.109.065896. [DOI] [PubMed] [Google Scholar]
- 77.Song MJ, Bae SH, Yoo IeR, Park CH, Jang JW, Chun HJ, et al. Predictive value of 18F-fluorodeoxyglucose PET/CT for transarterial chemolipiodolization of hepatocellular carcinoma. World J Gastroenterol. 2012;18:3215–22. doi: 10.3748/wjg.v18.i25.3215. [DOI] [PMC free article] [PubMed] [Google Scholar]
- 78.Torizuka T, Tamaki N, Inokuma T, Magata Y, Yonekura Y, Tanaka A, et al. Value of fluorine-18-FDG-PET to monitor hepatocellular carcinoma after interventional therapy. J Nucl Med. 1994;35:1965–9. [PubMed] [Google Scholar]
- 79.Kuehl H, Stattaus J, Hertel S, Hunold P, Kaiser G, Bockisch A, et al. Mid-term outcome of positron emission tomography/computed tomography-assisted radiofrequency ablation in primary and secondary liver tumours--a single-centre experience. Clin Oncol (R Coll Radiol) 2008;20:234–40. doi: 10.1016/j.clon.2007.11.011. [DOI] [PubMed] [Google Scholar]
- 80.Kim BK, Kang WJ, Kim JK, Seong J, Park JY, Kim do Y, et al. 18F-fluorodeoxyglucose uptake on positron emission tomography as a prognostic predictor in locally advanced hepatocellular carcinoma. Cancer. 2011;117:4779–87. doi: 10.1002/cncr.26099. [DOI] [PubMed] [Google Scholar]
- 81.Takayasu K, Arii S, Matsuo N, Yoshikawa M, Ryu M, Takasaki K, et al. Comparison of CT findings with resected specimens after chemoembolization with iodized oil for hepatocellular carcinoma. AJR Am J Roentgenol. 2000;175:699–704. doi: 10.2214/ajr.175.3.1750699. [DOI] [PubMed] [Google Scholar]
- 82.Guan YS, Sun L, Zhou XP, Li X, Zheng XH. Hepatocellular carcinoma treated with interventional procedures: CT and MRI follow-up. World J Gastroenterol. 2004;10:3543–8. doi: 10.3748/wjg.v10.i24.3543. [DOI] [PMC free article] [PubMed] [Google Scholar]
- 83.Strauss LG, Conti PS. The applications of PET in clinical oncology. J Nucl Med. 1991;32:623–50. [PubMed] [Google Scholar]
- 84.Okazumi S, Isono K, Enomoto K, Kikuchi T, Ozaki M, Yamamoto H, et al. Evaluation of liver tumors using fluorine-18-fluorodeoxyglucose PET: Characterization of tumor and assessment of effect of treatment. J Nucl Med. 1992;33:333–9. [PubMed] [Google Scholar]
- 85.Khan MA, Combs CS, Brunt EM, Lowe VJ, Wolverson MK, Solomon H, et al. Positron emission tomography scanning in the evaluation of hepatocellular carcinoma. J Hepatol. 2000;32:792–7. doi: 10.1016/s0168-8278(00)80248-2. [DOI] [PubMed] [Google Scholar]


