Abstract
In this study and its companion, the cortical and subcortical connections of the medial belt region of marmoset monkey auditory cortex were compared with the core region. The main objective was to document anatomical features that account for functional differences observed between areas. Injections of retrograde and bi-directional anatomical tracers targeted two core areas (A1 and R), and two medial belt areas (RM, rostromedial; CM, caudomedial). Topographically distinct patterns of connections were revealed among subdivisions of the medial geniculate complex (MGC) and multisensory thalamic nuclei, including the suprageniculate (Sg), limitans (Lim), medial pulvinar (PM), and posterior nucleus (Po). The dominant thalamic projection to CM was the anterior dorsal division (MGad) of the MGC, whereas the posterior dorsal division (MGpd) targeted RM. CM also had substantial input from multisensory nuclei, especially the magnocellular division (MGm) of the MGC. RM had weak multisensory connections. Corticotectal projections of both RM and CM targeted the dorsomedial quadrant of the inferior colliculus, while the CM projection also included a pericentral extension around the ventromedial and lateral portion of the central nucleus. Areas A1 and R were characterized by focal topographic connections within the ventral division (MGv) of the MGC, reflecting the tonotopic organization of both core areas. The results indicate that parallel subcortical pathways target the core and medial belt regions, and that RM and CM represent functionally-distinct areas within the medial belt auditory cortex.
Keywords: multisensory, somatosensory, thalamus, tonotopic
Introduction
Our working model of primate auditory cortex organization (Kaas & Hackett, 1998; Kaas et al., 1999; 2000; Hackett, 2002) defines auditory cortex as those cortical areas that are the principal targets of neurons in either the ventral (MGv) or dorsal (MGd) divisions of the medial geniculate complex (MGC). By this definition, three regions of the superior temporal cortex are known to comprise auditory cortex in primates: core, belt, and parabelt (Fig. 1). Each of these regions is further subdivided into two or more distinct areas. In addition, there are a number of auditory-related fields in temporal, prefrontal, and posterior parietal cortex that do not receive inputs from the principal divisions of the MGC, but depend on corticocortical inputs from one or more areas of auditory cortex. The dorsal superior temporal sulcus (STS) and rostral temporal lobe have connections with nuclei in the posterior thalamus, but sparse inputs from MGC. With respect to thalamocortical inputs to auditory cortex, the primary (lemniscal) auditory pathway projects mainly upon the core region via the MGv. Projections to the belt and parabelt regions arise largely from the MGd, while all areas in all three regions receive a substantial diffuse input from the magnocellular (MGm) division of the MGC (Jones, 1997; Jones, 2003).
Fig. 1.
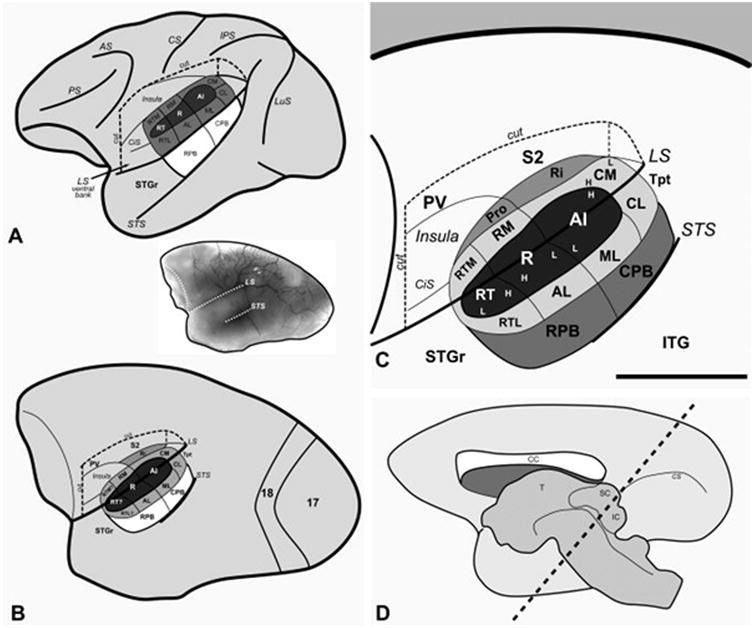
Schematic models of macaque (A) and marmoset (B - D) monkey auditory cortex. In panels A - C the lateral sulcus (LS) of the left hemisphere was graphically opened (cut) to reveal the locations of auditory cortical areas on its lower bank.The circular sulcus (CiS) has been flattened to show the position of the rostromedial (RM) and rostrotemporal medial (RTM) areas that occupy its lateral wall. The upper bank of the LS is partly opened (cut) to show the locations of the retroinsular area (Ri) in the fundus, second (S2) and parietoventral (PV) somatosensory areas on the upper bank, and insula (Ins). The three areas that comprise the core region of auditory cortex (dark shading) are located on the lower bank (A1, auditory area 1; R, rostral; RT, rostrotemporal). The core is surrounded by seven or eight areas that belong to the belt region (light shading) (CM, caudomedial; CL, caudolateral; ML, middle lateral; RM, rostromedial; AL, anterolateral; RTM, rostrotemporal medial; RTL, rostrotemporal lateral). The proisocortex area (Pro) is a putative addition to the medial belt. The core and lateral belt regions are mostly contained within the lateral sulcus in macaques, but extend onto the superior temporal gyrus (STG) in the marmoset. On the surface of the STG are two areas that make up the parabelt region (medium shading) (RPB and CPB, rostral and caudal parabelt). The rostral part of the STG (STGr) extends to the temporal pole. The temporal parietotemporal area (Tpt) occupies the caudal end of the STG and extends onto the supratemporal plane within the LS. Tonotopic gradients within areas are indicated by H (high frequency) and L (low frequency). Other sulci shown include the arcuate sulcus (AS), central sulcus (CS), intraparietal sulcus (IPS), and superior temporal sulcus (STS). (B, inset) Photographic image of the marmoset right hemisphere. (D) Schematic of the marmoset right hemisphere, medial view, showing the plane of section (diagonal lines) used in the present study for histological processing of the thalamus.
As described in the companion to this article (de la Mothe et al., 0000), the belt areas bordering the core region occupy an intermediate position in the auditory cortical processing hierarchy (Fig. 1). Outputs from the core mainly target the belt areas, which project to the parabelt region and auditory-related fields (Hackett et al., 1998a; Kaas and Hackett, 2000). Because many of the belt areas remain poorly-defined, we have tended to view the region as homogeneous. However, anatomical and physiological evidence is beginning to reveal that each of the belt areas is likely to represent a discrete functional module, characterized by a unique anatomical and neurophysiological profile.
One part of that profile concerns the cortical and thalamic connections of each field. To date the lateral belt areas (i.e., CL, ML, AL, RTL) have been the most well-studied, whereas the medial belt areas (CM, RM, RTM) have received little attention. One of the clearest differences among the lateral belt areas is that the caudal and rostral fields target functionally-distinct regions of auditory and auditory-related cortex (Galaburda and Pandya, 1983; Jones et al., 1995; Lewis and Van Essen, 2000; Morel et al., 1993; Morel and Kaas, 1992; Romanski et al., 1999a; Romanski et al., 1999b), suggesting that segregated pathways arise from different parts of auditory cortex (Kaas and Hackett, 2000; Rauschecker, 1998; Romanski et al., 1999b). This topography is consistent with evidence of functional segregation within the lateral belt (Rauschecker and Tian, 2000; Rauschecker and Tian, 2004; Rauschecker et al., 1995; Tian et al., 2001). Compared to the lateral belt, much less is known about the medial belt areas. After injections of different regions of prefrontal cortex in macaques, labeled cells were relatively sparse in the medial belt compared to the lateral belt, limiting conclusions about frontally-directed projections (Romanski et al., 1999a). Injections of the rostral (RPB) and caudal (CPB) divisions of the parabelt region of macaques revealed a topographic gradient in their connections with the medial belt areas (Hackett et al., 1998a). Area RM was broadly connected with RPB and CPB, while CM and RTM had stronger connections with CPB and RPB, respectively. The results of the companion study also revealed clear topographic differences in the cortical connections of RM and CM of marmoset monkeys (de la Mothe et al., 0000). In addition to stronger connections with caudal areas of auditory cortex, CM also has substantial connections with the retroinsular (Ri) area of somatosensory cortex, posterior parietal cortex, and entorhinal cortex. Injections of RM did not label these areas, but did reveal projections to the lateral nucleus of the amygdala and tail of the caudate nucleus. Thus, on the basis of architecture and cortical connections, RM and CM appear to be functionally-distinct areas of the belt region in marmosets.
With respect to thalamocortical connections of the belt region, the principal inputs to the belt areas arise from the MGd, along with additional inputs from MGm, posterior nucleus (Po), suprageniculate (Sg), limitans (Lim), and medial pulvinar (PM) (Burton and Jones, 1976; Jones, 2003; Jones and Burton, 1976; Molinari et al., 1995; Morel et al., 1993; Morel and Kaas, 1992; Pandya et al., 1994; Rauschecker et al., 1997). Architectonic studies of the macaque monkey indicate that the MGd has at least two subdivisions, but it is not known how the belt areas may differ with respect to these inputs (posterior, MGpd; anterior, MGad), (Burton and Jones, 1976; Hackett et al., 1998b; Jones, 2003; Molinari et al., 1995). Generally, the rostral and caudal areas of auditory cortex tend to receive inputs from caudal and rostral portions of the MGC, respectively. Moreover, given the observation that cutaneous somatosensory stimulation drives neuronal responses in CM of macaques, it is possible that the belt areas may also differ with respect to non-auditory or multisensory inputs (Fu et al., 2003; Schroeder et al., 2001). Thus, while little is known about the response properties of neurons in any division of the primate MGC, including the MGd, regional variations in function may be reflected in disparate projections to auditory cortex.
The general goal of the present study and its companion (de la Mothe et al., 0000) was to expand our understanding of auditory cortex organization by comparing the cortical and thalamic connections of the medial belt areas, RM and CM, with adjacent core areas, R and A1. The results were also used to test the following specific predictions of the model with respect to thalamocortical connections: (1) RM and CM receive thalamic inputs from different subdivisions of the MGC; (2) The thalamocortical connections of the medial belt areas are distinct from those of the core (Aitkin et al., 1988; Luethke et al., 1989); and (3) The organization of the marmoset auditory thalamus approximates that of the macaque monkey and other primates.
Materials and Methods
Animal Subjects
The experiments described in this report were conducted in the auditory research laboratories at Vanderbilt University in Nashville, TN. Six adult marmosets (Callithrix jacchus jacchus) served as animal subjects in the present study. The experimental history of each animal is included in Table 1. All procedures involving animals followed NIH Guidelines for the Use of Laboratory Animals, and were approved by the Vanderbilt University Institutional Animal Care and Use Committee.
Table 1.
Experimental history of animal subjects.
| Case | Sex | Areas Injected | Tracer | % | Volume (ul) |
|---|---|---|---|---|---|
|
| |||||
| 1 (01-37) | M | RM | BDA | 10 | 0.4 |
| R | FR | 10 | 0.3 | ||
| R | FE | 10 | .4 | ||
| *AL/ML | FB | 10 | 0.25 | ||
|
| |||||
| 2 (01-118) | M | RM | BDA | 10 | 0.4 |
| R | FR | 10 | 0.3 | ||
| *CL | FB | 10 | 0.2 | ||
|
| |||||
| 3 (02-17) | M | CM | CTB | 1 | 0.4 |
|
| |||||
| 4 (02-51) | M | A1 | CTB | 1 | 0.4 |
| R | FR | 10 | 0.3 | ||
|
| |||||
| 5 (02-60) | M | A1 | FR | 10 | 0.3 |
| *CPB | FB | 10 | 0.2 | ||
|
| |||||
| 6 (04-51) | M | CM | CTB | 1 | 0.4 |
| *AL | FR | 10 | 0.3 | ||
Areas of tracer injections (A1, auditory core area 1; R, rostral core; RM, rostromedial belt; CM, caudomedial belt; CPB, caudal parabelt; CL, caudolateral belt; AL, anterolateral belt). Neuroanatomical tracers (CTB, cholera toxin subunit B; BDA, biotinylated dextran amine; FB, fast blue; FE, fluoroemerald; FR, fluororuby).
Asterisk indicates tracer injections in the lateral belt or parabelt that were not analyzed for inclusion in the present study, but are illustrated in some reconstructions.
General Surgical Procedures
Aseptic techniques were employed during all surgical procedures. Animals were premedicated with cefazolin (25 mg/kg), dexamethasone (2 mg/kg), cimetidine HCl (5 mg/kg), and robinul (0.015 mg/kg). Anesthesia was induced by intramuscular injection of ketamine hydrochloride (10 mg/kg) then maintained by intravenous administration of ketamine hydrochloride (10 mg/kg) supplemented by intramuscular injections of xylazine (0.4 mg/kg) or by isoflurane inhalation (2 – 3%). Body temperature was kept at 37°C with a water circulating heating pad. Heart rate, expiratory CO2, and O2 saturation were continuously monitored throughout the surgery and used to adjust anesthetic depth. Oxygen was delivered passively through an endotracheal tube at a rate of 1 liter/minute.
The head was held by hollow ear bars affixed to a stereotaxic frame (David Kopf Instruments, Tujunga, CA). A midline incision was made exposing the skull, followed by retraction of the temporal muscle. A craniotomy was performed exposing the left dorsal superior temporal gyrus, lateral fissure, and overlying parietal cortex. After retraction of the dura, warm silicone was applied to the brain to prevent desiccation of the cortex. Photographs of the exposed cortical surface were taken for recording the locations of electrode penetrations in relation to blood vessels and the lateral sulcus.
Retraction of the parietal operculum and neuroantomical tracer injections
Tracer injections were made into target areas through a pulled glass pipette affixed to a 1 μl Hamilton syringe. The pipette was advanced into cortex under stereo microscopic observation to a depth of 1000 μm using a stereotaxic micromanipulator. After manual pressure injection of the tracer volume (Table 1), the syringe was held in place for 10 minutes under continuous observation to maximize uptake and minimize leakage. Injections of the core areas (A1, R) were made directly into the lateral surface of the superior temporal gyrus (STG) after removal of the dura (see Fig. 1b-c). Injections of medial belt targets within the lateral fissure were achieved in one of two ways. In cases 1 and 3, BDA or CTB were injected into RM or CM by passing the syringe through the overlying parietal cortex. Depth was controlled by stereotaxic measurements and verified by recordings made using a tungsten microelectrode affixed to the syringe. In all other cases, access to injection targets within the lateral fissure was achieved by retraction of the banks of the lateral fissure, as recently described (Hackett et al., 2005). Briefly, after microdissection of the arachnoid membrane around blood vessels at the edge of the lateral sulcus, the upper bank was gently retracted using a stereotaxic arm and blunt dissection of arachnoid within the sulcus. Once the desired opening was achieved, tracer injections were made directly into target areas relative to gross anatomical landmarks and blood vessel patterns.
Auditory stimulation and recordings
For most of the cases included in this report, detailed recordings were obtained seven days after tracer injections during a terminal experiment that averaged 24 hours in duration. The recording sites were concentrated in A1 and CM using a battery of stimuli, including tones, broad band noise, frequency modulated tones, and marmoset vocalizations. The tonotopic maps derived from these recordings were marked by electrolytic lesions and aided the reconstructions of architecture and connections, primarily at the borders of A1 and CM. The physiological results of these experiments and methodological details are reported elsewhere (Kajikawa et al., 2005; Kajikawa and Hackett, 2005). In one case (case 1) the left hemisphere was mapped prior to tracer injections. Injections into RM and R were made just rostral to the border of A1 and R based on a reversal in the tonotopic gradient. Because neuronal responses could be abolished or otherwise altered within or near tracer injections, post-injection recordings were confined to the opposite hemisphere in all other cases.
Perfusion and Histology
At the end of the terminal recording experiment a lethal dose of pentobarbital was administered intravenously. Just after cardiac arrest the animal was perfused through the heart with cold (4 degrees C) saline, followed by cold (4 degrees C) 4% paraformaldehyde dissolved in 0.1 M phosphate buffer (pH 7.4). Immediately following the perfusion the brains were removed and photographed. The cerebral hemispheres were separated from the thalamus and brainstem, blocked, and placed in 30% sucrose for 1 to 3 days. The thalamus was cut perpendicular to long axis of the brainstem in the caudal to rostral direction at 40 μm, as shown in Fig. 1d. In each series of sections every sixth section was processed for the following set of histochemical markers: (i) fluorescent microscopy; (ii) biotinylated dextran amine (BDA) or cholera toxin subunit B (CTB); (iii) myelinated fibers (MF) (Gallyas, 1979); (iv) acetylcholinesterase (AChE) (Geneser-Jensen and Blackstad, 1971); (v) stained for Nissl substance with thionin; (vi) cytochrome oxidase (CO) (Wong-Riley, 1979); or (vii) parvalbumin immunohistochemistry.
Analysis and reconstruction of connections
The X-Y locations of cell somata labeled by retrograde axonal transport of each tracer were plotted using a Neurolucida system (MicroBright Field, Inc., Williston VT). Auditory cortical areas were identified in sections stained for the histochemical markers listed above, as described in the companion paper (de la Mothe et al., 0000). Subdivisions of the MGC and surrounding nuclei of the posterior thalamus were guided by previously established architectonic criteria in New World marmoset and owl monkeys (Aitkin et al., 1988; FitzPatrick and Imig, 1978; Morel and Kaas, 1992), as well as Old World macaque monkeys (Burton and Jones, 1976; Hackett et al., 1998b; Jones, 2003; Molinari et al., 1995). The architectonic details are illustrated in figures 2 – 4 and described in the Results. For each histochemical marker, the borders of individual areas and patches of anterograde terminal labeling were drawn onto plots of labeled cells by alignment of blood vessels and common architectonic features using a drawing tube affixed to a Zeiss Axioscope. These drawings were used to create the schematic reconstructions. In most figures, every other section was chosen for illustration. For each tracer injection, the percent of total labeled cells was derived by dividing total cell counts for each thalamic nucleus by the total number of cells in the thalamus labeled by that injection. Digital images were acquired using a Nikon DXM1200F digital camera and Nikon E800S microscope. These images were cropped, adjusted for brightness and contrast using Adobe Photoshop 7.0 software, but were otherwise unaltered. Final figures containing images and line drawings were made using Canvas 8.0 software (Deneba Systems, Inc., Miami, FL) and Adobe Illustrator 10.0 (Adobe Systems, Inc.).
Fig. 2.
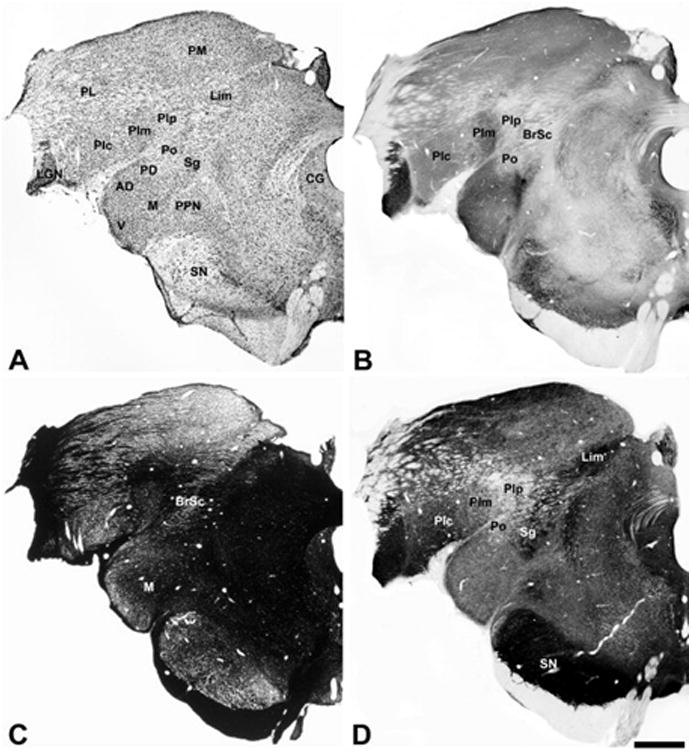
Architecture of the marmoset posterior thalamus. (A) Thionin stain; (B) cytochrome oxidase stain; (C) Myelin stain; (D) acetylcholinesterase stain. Abbreviations for nuclei and fiber tracts in panels A and C given in the Table of abbreviation. Scale bar, 1 mm.
Fig. 4.
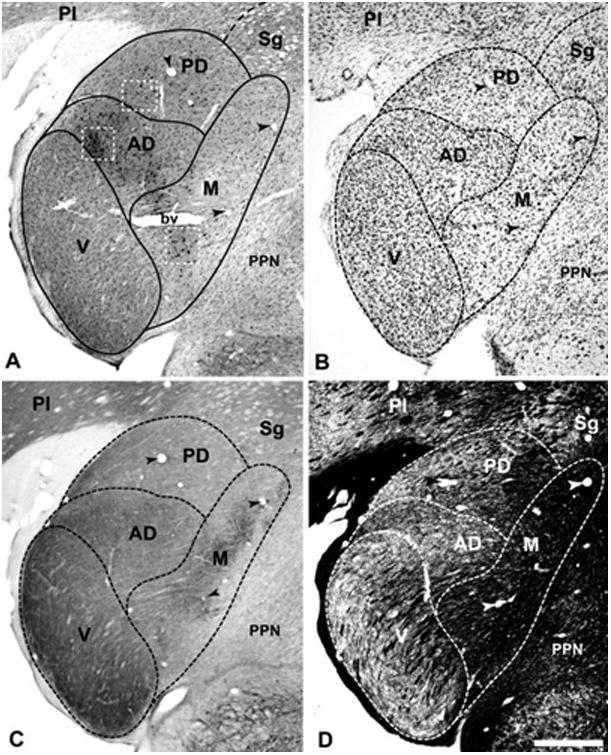
Architectonic features and labeled cells of marmoset monkey thalamus, case 4. (A) CTB-labeled cells and terminals in MGad, MGpd, and MGm after CM cortex injection. Insets (white dashed boxes) correspond to panels in Fig. 5. (B) Nissl stain; (C) Cytochrome oxidase stain; (D) Myelin stain. Arrowheads in all panels mark common blood vessels. bv, blood vessel profile. Scale bar, 500 μm.
Results
Thalamic architecture and subdivisions
Delineation of thalamic nuclei and their subdivisions was accomplished in adjacent series of sections stained for Nissl, cytochrome oxidase (CO), acetylcholinesterase (AChE), myelinated fibers (F), and in some cases, parvalbumin (Figs. 2 - 4). Cytoarchitecture, as revealed in sections stained for Nissl, was the principal means of nuclear identification. Density shifts in the other preparations, especially CO, reinforced border identification as transitions in expression density often matched the cytoarchitectonic border. Patterns of labeled cells were related to these architectonic divisions to derive final reconstructions. For all cases described in this report, the plane of section was perpendicular to the long axis of the brainstem and spinal cord, and therefore slightly horizontal to a standard coronal plane (Fig. 1d).
The dorsal division of the MGC consisted of two main divisions, MGpd and MGad. The MGpd occupied most of the caudal pole of the MGC where it was populated mostly by medium-sized cells of uniform spacing that was notably less dense than the MGv and MGad (Fig. 3a – c). As the MGC expanded in size rostrally, the MGpd was gradually displaced on its ventral and ventromedial borders by the emergence of the MGv and expansion of the MGm (Fig. 3d – i). In CO preparations, MGpd staining was moderate in intensity, and less intense than MGv (Fig. 3b, e, h). Cells labeled by tracer injections of the medial belt were frequently multipolar, and often larger than unlabeled cells in this division (Figs. 4a, 5b, 6a-b). Further rostral, the MGpd decreased in size as the MGad emerged and became larger toward the rostral pole (Fig. 3j – r). Like the MGv, the MGad stained more darkly for CO than MGpd. In contrast, the MGpd stained more darkly for AChE.
Fig. 3.

Architectonic features of the marmoset medial geniculate complex. Series of adjacent sections are arranged from caudal (A – C) to rostral (V – X). In each row, adjacent tissue sections were stained for Nissl substance (left column), cytochrome oxidase (center column), and acetylcholinesterase (right column). Nuclear subdivisions are outlined in the Nissl-stained sections (dashed lines). Asterisks indicate zone of dense acetylcholinesterase staining. Arrows denote blood vessel profiles common to sections in a given row. See list of abbreviations for additional details. Scale bar, 500 μm.
Fig. 5.
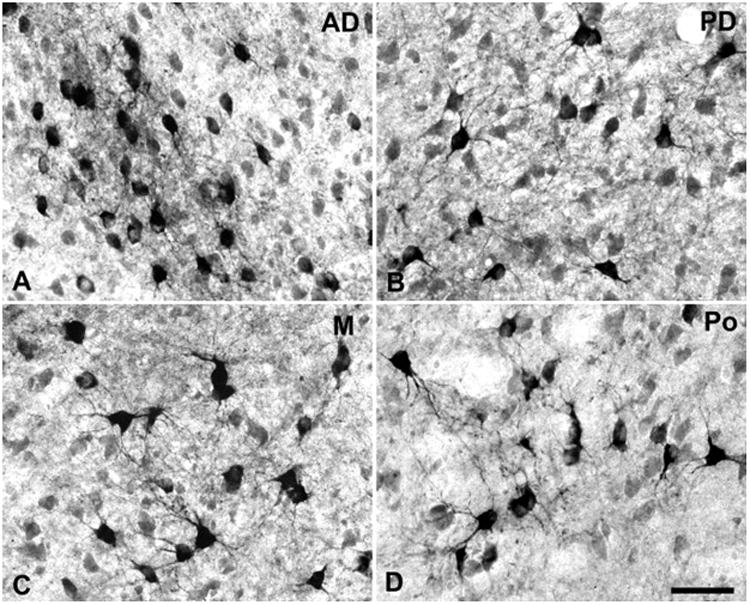
CTB-labeled cells and terminals in different divisions of the MGC from Fig. 4, case 4. (A) MGad; (B) MGpd; (C) ventral MGm; (D) Posterior nucleus (Po), not shown in Fig. 4. In all panels lateral is to the left, dorsal is up. Scale bar, 50 μm.
Fig. 6.
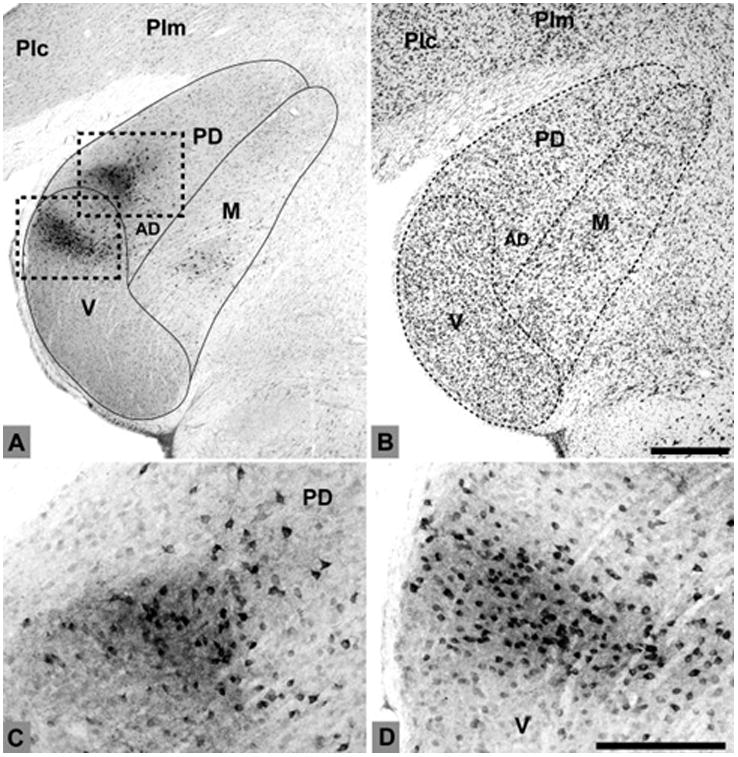
BDA-labeled cells and terminals, case 2. (A) Dual foci of label MGpd and MGv after an injection that encroached upon RM and R, respectively. Dashed lines correspond to panels C and D; (B) Thionin stain for Nissl; (C) Labeled cells and terminals in MGpd; (D) Elongated string of label in dorsal MGv. Scale bars, (A-B) 500 μm; (C-D) 100 μm.
In the plane of section used in these experiments, the MGad emerged from a location between the MGpd, MGv, and MGm where it gradually enlarged to occupy most of the rostral pole of the MGC (Fig. 3j – r). This pattern was consistent across cases. In some sections, where the architecture were ambiguous, this region was marked as the transitional zone (Z), as adopted in macaque monkey (Hackett et al., 1998b; Molinari et al., 1995). MGad was distinguished from the MGpd by greater cell density, darker staining for CO, and weaker AChE expression. Compared to the MGv, cell spacing in MGad was similar, but cells were slightly larger, sometimes multipolar, and their arrangement less orderly (Fig. 3, left column). Examples of labeled MGad cells are illustrated in Fig. 5a. In myelin-stained sections, the MGad had a matrix-like arrangement of fibers that contrasted with the lamellar patterns in the MGv (Fig. 4d).
The MGv emerged near the caudal pole of the MGC (Fig. 3a – c), expanding in more rostral sections to occupy most of the ventrolateral quadrant of the MGC, then diminishing near the rostral pole (Fig. 3v – x). The principal neurons of the MGv were small, compared to those of other subdivisions. In this plane of section, cells in the middle third of the MGv were arranged in parallel laminae that tended to radiate laterally in arcs from the medial boundary of the MGv (Fig. 3j, m, p). These rows appeared to coincide with fibrodendritic laminae visible in CO and fiber sections. Near its border with the MGpd or MGad, the laminae flattened and became more laterally oriented (Figs. 3j, m, p; 4b - d; see also 6 a, c). CO density reached a maximum in the MGv, and was fairly uniform throughout, although CO density in the MGad was comparable to MGv in many sections. Examples of labeled MGv cells after a BDA injection involving R are shown in Fig. 6a, d.
The MGm was the most heterogeneous in the MGC. The largest cells were CO-dense and located in a magnocellular region that occupied the ventral two-thirds of the division (Figs. 3g – p; 4a - b; 5c). In its dorsal third, cells were smaller and the border with the MGpd or Sg was ambiguous in some sections. A unique feature of the dorsal MGm was that these cells were coextensive with a region of very dense AChE expression (Fig. 3d – l, asterisks). The outlined region in the Nissl sections correspond to the location of the AChE-dense patch. At lower magnification (Fig. 2d), it can be seen that this patch in dorsal MGm appears to be related to an elongated band of dense AChE staining that involves the limitans (Lim) and suprageniculate (Sg) nuclei and extends into the dorsomedial MGC. Rostrally, the dense AChE region receded from the MGC to involve only the Lim and Sg (Fig. 3p – u). CO staining was patchy and very dark for the largest cells, but not especially useful in the delineation of MGm borders other than with the MGv. Fiber density was the highest in the MGm as the fibers of the brachium of the inferior colliculus emerged here enroute to the lateral divisions of the MGC (Fig. 4d).
The posterior nucleus, Po, was defined as the region dorsal to MGpd/MGad, ventral to PM, medial to PI, and lateral to Sg/Lim (Fig. 2). Clear borders were usually not present. The architectonic features of Po are blurred by banded fibers of the brachium of the superior colliculus (Fig. 2b, c: BrSC), around which islands of moderately-large cells were stranded (Fig. 4d). The Sg and Lim nuclei tended to blend with Po medially, but could usually be segregated, as Sg and Lim were located within the AChE-dense region that extended from the ventromedial boundary of PM to the dorsal border of MGm (Fig. 2d; 3m - o). Laterally, Po bordered the medial divisions of the inferior pulvinar (PIm, PIp). Since this region was traversed by the BrSC, borders were sometimes difficult to distinguish in Nissl sections, but the subdivisions of PI could be delineated in CO and AChE (Figs. 2, 3) according to criteria established in recent studies (Gray et al., 1999; Stepniewska and Kaas, 1997; Stepniewska et al., 2000). PM was easily identified in the dorsomedial cap of the thalamus as a large region with evenly-spaced cells of moderate size (Fig. 2a).
Description of Thalamocortical Connections
Tracer injections targeted CM in 2 cases, RM in 2 cases, A1 in 2 cases, and R in 3 cases (Table 1). The thalamocortical connection patterns of each injection site are described for each of these areas below, beginning with CM. The number of labeled cells associated with injection of the dextran, FR, was consistently lower than cases in which BDA or CTB were injected, reflecting their greater sensitivity. Although fewer cells were labeled in the thalamus with FR, the proportion of labeled cells across nuclei appeared to be maintained.
Thalamic connections of CM
In case 6, the CTB injection was made across all cortical layers into rostral CM medial to A1 (Fig. 7). In the most caudal sections (#332 – 338), retrogradely-labeled cell soma were distributed throughout most of MGm, with a few cells in MGpd, and none in MGv. Anterograde labeling of axon terminals was sparse. As MGad began to emerge (#344 – 356), dense foci of overlapping cells and terminals were concentrated there. This projection tended to involve cells along the ventral edge of MGad, near its border with MGv (Figs. 4a, 5a). A few labeled cells were located in the ventral half of MGpd in these sections (see Fig. 5b). The ventral MGm contained the most labeled cells (Fig. 5c), although some were found dorsally, in the smaller-celled portion of MGm. Labeled cells were also located in the Sg and Lim in these sections, along with a few cells between the MGm and pretectal area (e.g., #350). Note that the pattern of anterograde labeling in section 356 formed a continuous line that extended along the MGv border within MGad and MGm. As the MGC began to diminish in size rostrally (#362 – 368), labeled cells persisted in discrete groups of cells in MGad and MGm. Additional cells were found in groups in Po (Fig. 5d), and scattered in Sg, Lim, and PM. Labeled cells were also found medial to MGM in PPN and the inferior division of the ventroposterior nucleus (VPI) in these sections, and those further rostral.
Fig. 7.
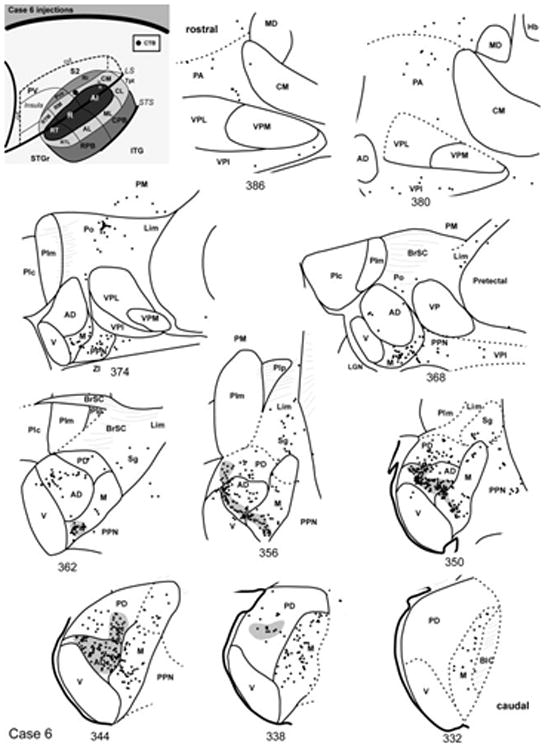
Thalamic connections of CM, case 6. Series of reconstructed serial sections are arranged from rostral (upper left) to caudal (lower right). CTB-labeled cells (filled circles) and terminals (shading) are drawn onto each section, showing borders between areas identified by architectonic criteria. Inset, schematic of marmoset auditory cortex showing location of CTB injection in rostral CM.
In case 3 (Fig. 8), the pattern of labeled cells involved the same nuclei as case 6, but the concentration of labeled cells in the MGC favored the rostral part of the MGad and there were many more cells among the posterior group of nuclei (Po, Sg, Lim) and PM. This pattern was attributed to a more caudal placement of the CM injection compared with case 6. In the more caudal sections (#147 – 159) a group of labeled cells occupied the dorsal cap of the MGm in an AChE-dense region that was displaced by the Sg rostrally (#165). The mixture of small and larger cells made precise delineation of the dorsal MGm and Sg rather difficult in the caudal sections, owing to much more horizontal plane of section. Otherwise, labeled cells in the MGm were mostly located ventrally, as in case 6, above (#153 – 171). Labeled cells in the dorsal divisions of the MGC were concentrated in the rostral MGad, extending to its rostral pole where it borders the lateral division (VPL) of VP (#177 – 189). There were no labeled cells in MGv, and few in MGpd. Over this same range, numerous cells were found outside of the MGC in Sg, Lim, and especially Po. Further rostral (#195 – 201) numerous cells were concentrated in the ventromedial portion of PM, extending from a line of cells in rostral Po.
Fig. 8.
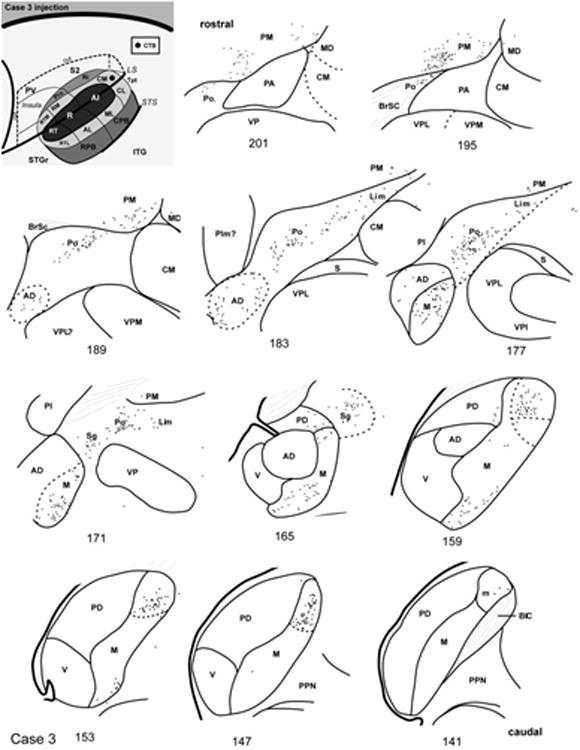
Thalamic connections of CM, case 3. Series of reconstructed serial sections are arranged from rostral (upper left) to caudal (lower right). CTB-labeled cells (filled circles) and terminals (shading) are drawn onto each section, showing borders between areas identified by architectonic criteria. Inset, schematic of marmoset auditory cortex showing location of CTB injection in caudal CM.
Summary of CM connections
The principal auditory thalamic connections of CM arose from the MGad and MGm (Fig. 9). Connections with MGpd were much weaker, and there was no significant input from MGv. Topographic differences were noted between injections of rostral (case 6) and caudal (case 3) parts of CM. The connections of caudal CM with the MGC were largely restricted to MGad and MGm, whereas the rostral CM injection in case 6 produced additional labeling in MGpd. In addition, caudal CM had greater connections with multisensory nuclei outside of the MGC including Sg, Lim, Po, and PM. These findings are consistent with the topographic differences evident in the cortical connections of these cases (de la Mothe et al., 0000). Rostral CM had more widespread connections with rostral and caudal auditory cortex, whereas the connections of case 6 were more limited to the caudal fields. In addition to the thalamic connections, corticotectal projections after CM injections were clustered in the dorsomedial (dm) region of the inferior colliculus (IC) rostrally. Caudally, the projection extended to the pericentral shell forming the ventromedial boundary of the IC (Fig. 10). In some sections, weaker projections were observed in the lateral nucleus (ln) such that a nearly continuous ring of pericentral terminal labeling encircled the central nucleus except for the lateral dorsal cortex (dc).
Fig. 9.
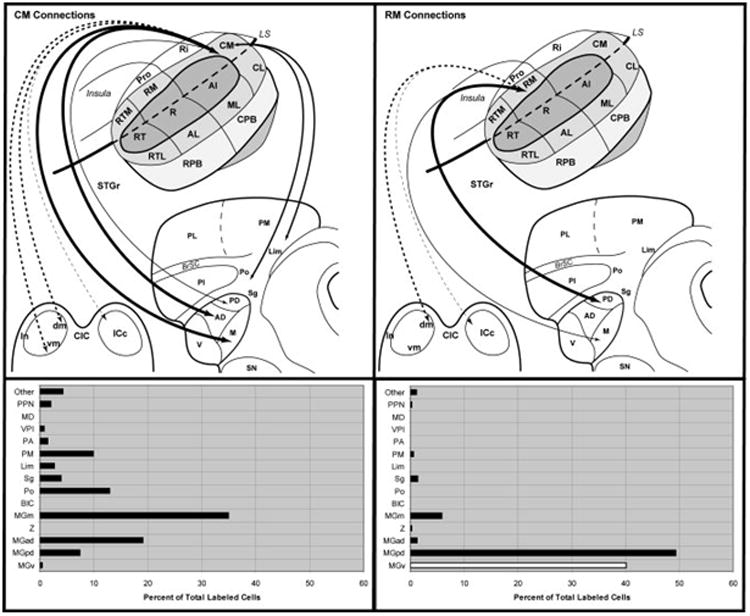
Summary of thalamic and midbrain connections of CM and RM. Top panels illustrate subcortical connections (arrows) of CM and RM on schematic diagrams of marmoset auditory cortex, thalamus, and inferior colliculus. Arrow and line size is proportional to connection strength, as indicated in the histograms below each panel. Lines were not drawn for connections representing less than 5% of total. Double arrows indicate reciprocal connection. Dashed arrows indicate corticotectal projections. Bottom right, white bar indicates that cell counts for MGv are likely to be inflated due to involvement of the medial edge of the core area R by the RM injections.
Fig. 10.
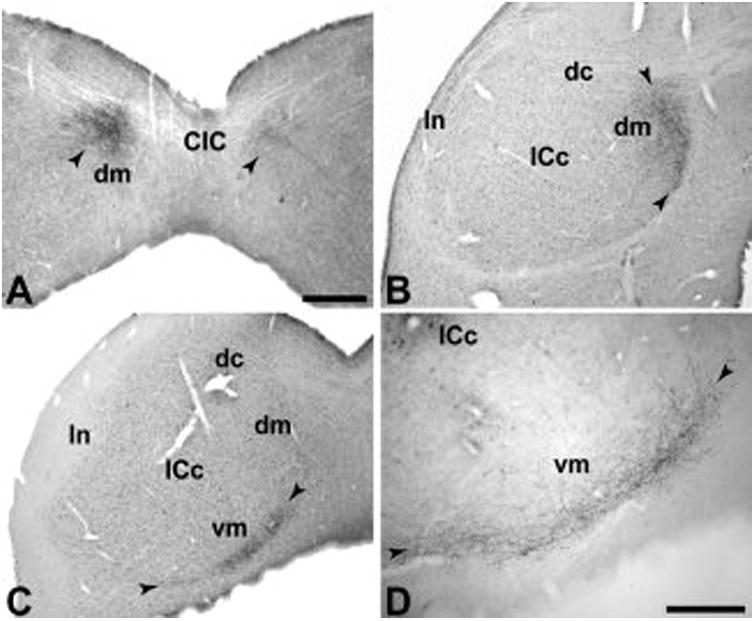
Anterograde terminal labeling in the inferior colliculus. (A) Cluster of labeled terminals bilaterally in the dorsomedial (dm) portion of the inferior colliculus (IC) after BDA injection of RM. Terminal labeling is denser ipsilateral to the injection. (B) Terminal labeling in dm after CTB injection of CM. (C) Terminal labeling in the ventromedial (vm) portion of the IC after same CTB injection as panel B, but further caudal. (D) BDA labeling in the vm region after CM injection. Arrowheads mark zones of terminal labeling. CIC, commissure of the IC; dc; dorsal cortex of the IC; ln, lateral nucleus of the IC; ICc, central nucleus of the IC Scale bars, 500 μm (A-C); 250 μm (D).
Thalamic connections of RM
In case 1 (Fig. 11), the BDA injection was placed in RM. Labeled cells and terminals were concentrated heavily throughout nearly the entire extent of MGpd (# 144 - 116). There was some involvement of the adjacent core area, R, by the injection, as there were labeled cells extending across the border between MGpd and MGv (#132, 128). Labeled cells in MGad were relatively few, and confined mainly to its caudal extension where it emerged between MGv and MGpd. In MGm, two foci of label were noted. The ventral grouping occupied a similar location to that associated with CM injections (#128 – 124). The dorsal projection involved the AChE-dense region that merged into Sg, as noted for the CM cases above (#132 – 120). There were only a few labeled cells in Sg and PM (#100), and no cells in Po or Lim in this case.
Fig. 11.
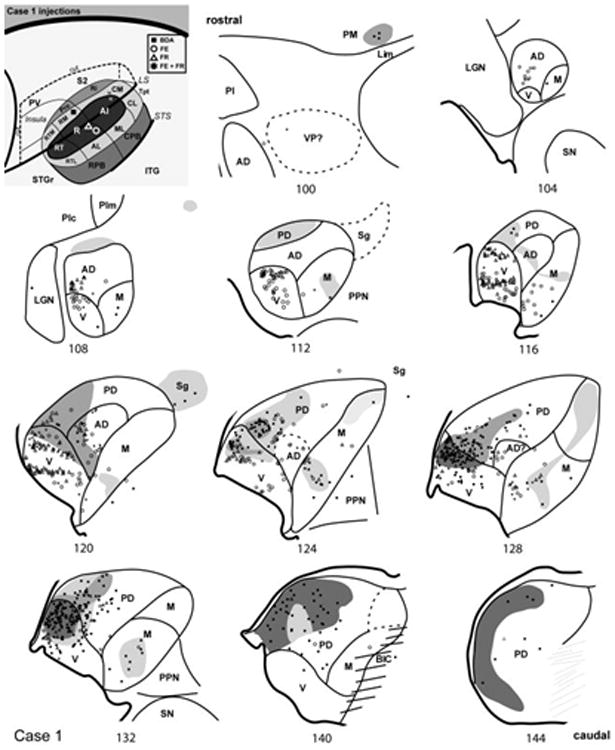
Thalamic connections of RM and R, case 1. Series of reconstructed serial sections are arranged from rostral (upper left) to caudal (lower right). BDA-labeled cells (filled squares) and terminals (shading) are drawn onto each section, showing borders between areas identified by architectonic criteria. Cells labeled by fluororuby (FR) are indicated by open triangles, and cells labeled by fluoroemerald (FE) indicated by open circles. Asterisks indicate double-labeled cells (FR + FE). Inset, schematic of marmoset auditory cortex showing locations of BDA injection in caudal RM, and FR/FE injections in caudal R.
In case 2 (Fig. 12), the BDA injection was placed in RM. As in case 1 (Fig. 11), the additional involvement of the medial edge of R was suggested by the appearance of labeled cells in dorsal MGv at its border with MGpd and MGad (Fig. 6). The distribution of labeled cells in MGv contrasts with the injection of R in this same case (open triangles). Consistent with case 1, the labeled cells were concentrated in MGpd rather than MGad (#125 – 95). Dense overlapping anterograde and retrograde labeling was present in MGpd from sections near the caudal pole (#125) to its rostral termination (#101). In MGm, the label was similar to the cases above, being concentrated ventrally in one group, and then rostrally in an AChE-dense zone that merged into Sg. Overall, there were few labeled cells in Po, Sg, Lim, or PM, consistent with the other RM injection. There were, however, patches of anterograde label near the rostral pole near MGad (#89 – 77), and also dorsomedial PM.
Fig. 12.
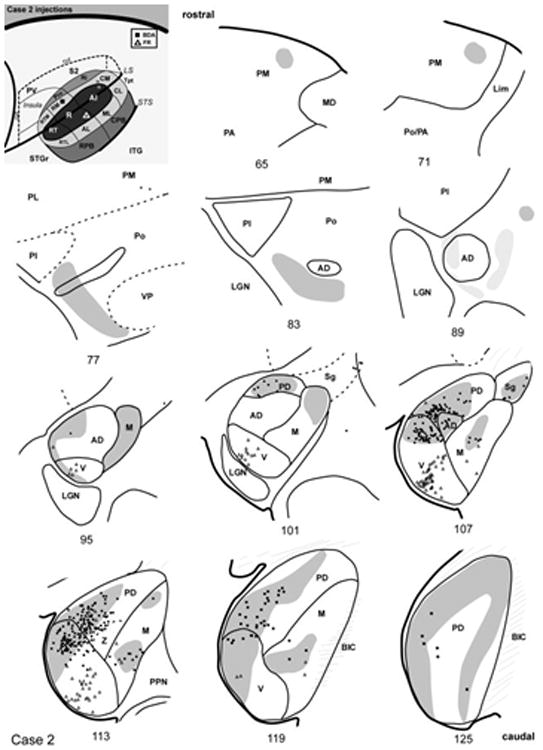
Thalamic connections of RM and R, case 2. Series of reconstructed serial sections are arranged from rostral (upper left) to caudal (lower right). BDA-labeled cells (filled squares) and terminals (shading) are drawn onto each section, showing borders between areas identified by architectonic criteria. Cells labeled by fluororuby (FR) are indicated by open triangles. Inset, schematic of marmoset auditory cortex showing location of BDA injection in RM and FR in caudal R.
Summary of RM connections
Compared to CM, the thalamic connections of RM were almost completely restricted to the MGC (Fig. 9). The principal connections arose from the MGpd, with secondary projections from MGm. There were only sparse connections with MGad, and connections with MGv appeared to be related to involvement of R by the injection. Connections with multisensory nuclei outside of the MGC were also sparse. These patterns reflected clear topographic differences between the connections of RM and CM. Corticotectal projections were clustered in the dorsomedial region of the IC, with minimal spread to the central nucleus. There was no clear projection to the ventromedial shell or external nucleus, as observed after CM injections (Fig. 10).
Thalamic connections of A1
The core area, A1, was targeted in cases 4 and 5. In case 4 (Fig. 13), labeled cells were located in MGm in the most caudal sections (#190 – 202) where MGm and MGpd comprised the caudal pole of the MGC. As MGv emerged in more rostral sections (#208 – 226), a dense strip of labeled cells and terminals appeared in MGv that was oriented ventrolaterally, consistent with the orientation of its principal cells and fibers (Fig. 4). Labeled cells with more variable dendritic orientation were scattered elsewhere in MGv, especially dorsolaterally near the border with MGad, which also contained a moderate number of labeled cells. The MGv cells labeled by this injection were located ventromedial to the strip of cells labeled by the injection of R in this same case (#202 – 214), as described below. Few labeled cells were found in MGpd in this case. In MGm, two foci of label were evident over several sections (#202 – 226). The ventral grouping was at times continuous with the strip of labeled cells in MGv, and was overlapped by dense anterograde label (#208 – 214). The dorsal group of cells in MGm was overlapped by weaker anterograde projections, which extended into Sg and Lim as these nuclei became prominent rostrally (#214 – 226). As the MGC began to diminish in size (#226 – 238), labeled cells in Po were grouped between the inferior pulvinar (PI) and the dorsal MGC (#226). Rostrally, the grouping in Po shifted to occupy a position near the ventral border with PM. A few cells were labeled in ventrolateral PM, near those in Po (#238 – 244).
Fig. 13.
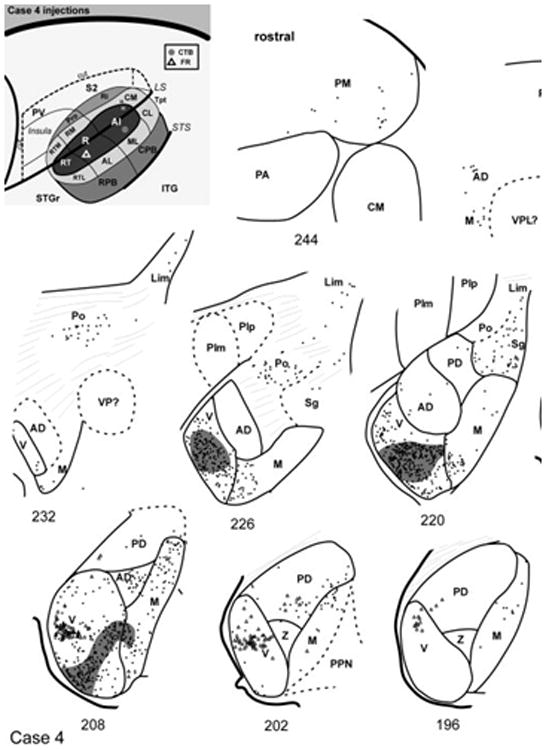
Thalamic connections of A1 and R, case 4. Series of reconstructed serial sections are arranged from rostral (upper left) to caudal (lower right). CTB-labeled cells (filled circles) and terminals (shading) are drawn onto each section, showing borders between areas identified by architectonic criteria. Cells labeled by fluororuby (FR) injection in rostral R are indicated by open triangles. Inset, schematic of marmoset auditory cortex showing location of CTB injection in A1 and FR in rostral R.
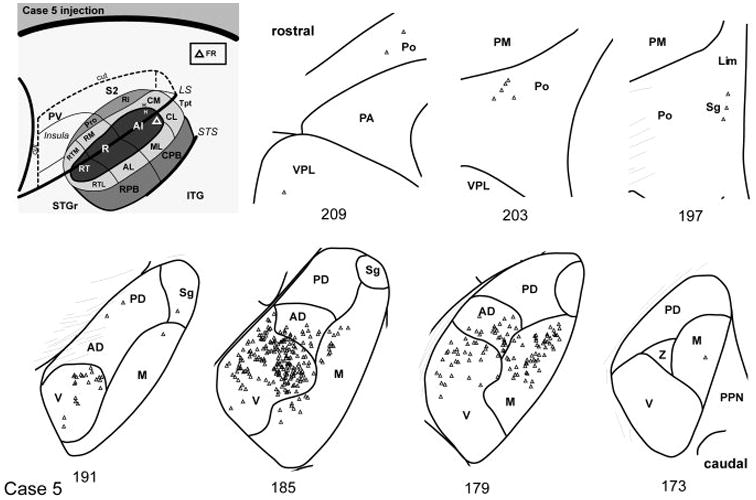
In case 5 the FR injection of A1 was located near the caudal border with CM (Fig. 14). The most caudal sections (#173 – 179) had a strong projection from MGm, with a slight dorsal emphasis. As in case 4, the main projection from this injection arose from the MGv, but the focus of labeled cells was in its dorsomedial quadrant, with scattered cells dorsolaterally (#179 – 191). Cells were also labeled in MGad over this same range. Labeled cells were not found in MGpd. Rostrally, a few labeled cells were located in Sg, Lim, and Po (#197 – 209). The location of labeled cells in Po, was consistent with the A1 injection in case 02-51.
Fig. 14.
Thalamic connections of A1, case 5. Series of reconstructed serial sections are arranged from rostral (upper left) to caudal (lower right). FR-labeled cells (open triangles) are drawn onto each section, showing borders between areas identified by architectonic criteria. Inset, schematic of marmoset auditory cortex showing location of FR injection in caudomedial A1.
Summary of A1 connections
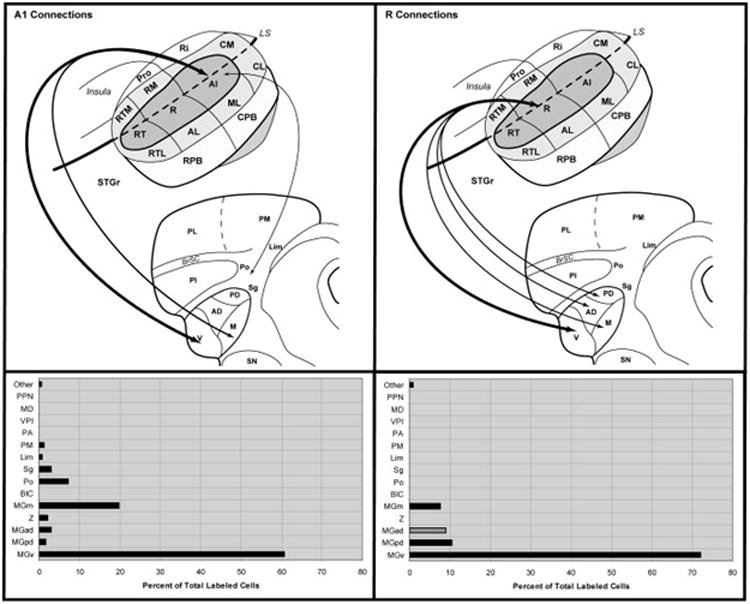
In both cases, the greatest concentration of labeled cells after injection of A1 was located in the MGv (Fig. 15). In case 4 the locus was ventrolateral, whereas in case 5 cells were concentrated dorsomedially. The topographic difference reflects the tonotopic organization of A1 and the MGv, as higher frequencies are represented in caudal A1. Labeled cells were also found in MGad in both cases, but not MGpd, consistent with the rostrocaudal topography between auditory cortex and the MGC. The connections with MGm are consistent with architectonic and topographic differences between its dorsal and ventral domains, as observed after injections of CM and RM. Finally, labeled cells were located in Po and Sg. Although fewer cells were labeled from the FR injection, this likely reflects differences in the sensitivity of CTB and FR, as the proportion of labeled cells distributed between nuclei was comparable.
Fig. 15.
Summary of thalamic connections of A1 and R. Top panels illustrate connections (arrows) of A1 and R on schematic diagrams of marmoset auditory cortex and thalamus. Arrow size is proportional to connection strength, as indicated in the histograms below each panel. Lines were not drawn for connections representing less than 5% of total. Double arrows indicate reciprocal connection. Bottom right, grey bar indicates that cell counts for MGad due to connections in case 1, not observed in cases 2 and 4.
Thalamic connections of R
The core area, R, was injected in with retrograde fluorescent tracers in cases 1, 2, and 4. In case 2 (Fig. 12), the FR injection was placed in caudal R, near the border with A1, and lateral to a BDA injection in RM. The main projection to R arose from an elongated cluster of cells in ventrolateral MGv that spanned several sections (#119 – 95). Note the segregation of this cluster from the dorsolateral grouping of labeled cells from the BDA injection of RM that appeared to involve the medial edge of R. This pattern was repeated in case 1 (see below). Labeled cells in MGm were located ventrally in near proximity to BDA-labeled cells (#119 – 107). A few cells were found in ventrolateral MGpd (#113 – 107).
In case 4 (Fig. 13), the FR injection was placed in rostral R, near its border with RT. A CTB injection was placed in A1. The FR injection labeled a band of cells in the middle of MGv oriented lateral to medial (#202 – 208). Otherwise, FR cells were scattered dorsally in MGv (#196 – 202). The main strip of cells was dorsal to labeling from the A1 injection, described above. A few cells were labeled in ventral MGpd and MGm (#196 – 208).
In case 1 closely-spaced injections of FR and FE were placed in the caudal portion of R in line with the BDA injection of RM (Fig. 11). The FR injection was placed into the crown of the STG, and FE was injected about 1 mm lateral to FR. Overlapping bands of labeled cells from both injections were located in the middle and dorsal half of the MGv, oriented from lateral to medial, as in case 4 (#128 – 116). Double-labeled cells were also located in these bands. In more rostral sections (#112 – 108), labeled cells persisted in the MGv, but those labeled by the more lateral FE injection tended to be located further ventral. Damage to the MGv in sections 140 – 116 prevented evaluation of the ventrolateral corner of the nucleus. In MGm, single and double-labeled cells from both injections overlapped in the ventral half of the nucleus in most sections (#132 – 112). Labeled cells were found in MGpd and MGad near the border with MGv, and cells from the FE injection appeared in MGad to the rostral pole. Thus, compared to more rostrally-placed injections of R, labeled cells in caudal R extended further caudally in the MGC, and appeared to have more cells in MGad. There were no labeled cells in Sg, Po, or PM from either R injection.
Summary of R connections
Injections of R in all cases revealed a preferential connection with MGv, and secondary projections from MGm (Fig. 15). Connections with MGpd or MGad were sparse, by comparison, and there were almost no connections with the multisensory nuclei. In all cases, the main projection to R derived from a radially-oriented cluster of cells in MGv aligned with the trajectory of axons within MGv (Fig. 4d, 6a). The clusters of labeled cells varied in relative location, reflecting topographic differences in the connections with R. In case 2, the injection of caudal R labeled a strip of cells ventral to those labeled by the injection of rostral R in case 4. The ventral location and orientation in MGv was almost identical to that produced by injection of rostrolateral A1 in case 4. These topographic patterns are consistent with the tonotopic organization of both fields, and suggest that topographically-discrete sectors in MGv may project to matching tonotopic domains in different areas of the core. It was not possible to determine from our data, however, whether single cells in the MGv project to both A1 and R. In addition, the injections of RM that appeared to encroach on the medial edge of R labeled cells in a group in the extreme dorsolateral corner of MGv that extended into the ventral MGad. In case 1, the injections of FR into the medial and caudal part of R also labeled cells in this zone, in addition to a more ventral band. These patterns suggest possible topographic differences in the connections of lateral and medial domains of R.
Discussion
In the present study, neuroanatomical tracers were injected into four different areas of auditory cortex to reveal the sources of their thalamic inputs. In the medial belt region, areas RM and CM were targeted. In the core region, injections were made into R and A1, which are adjacent to RM and CM, respectively. The results indicated that these areas are distinct with respect to their thalamocortical connections, consistent with hypotheses derived from our working model of the primate auditory cortex. The significance of these results are discussed in more detail below with respect to the functional roles of these areas and the corticocortical connections described in the companion paper (de la Mothe et al., 0000).
Connections of RM and CM with the MGC
One of the main findings of the present study was that the thalamocortical inputs to RM and CM derived from different subdivisions of the auditory thalamus. The primary input to RM was MGpd, while the main input to CM was MGad (Figs. 9, 16). The rostrocaudal topography exhibited by these projections was generally consistent with that noted for other areas of auditory cortex, in that the rostral MGC tends to project more densely to caudal areas of auditory cortex, and vice versa (Burton and Jones, 1976; Hackett et al., 1998b; Jones and Burton, 1976; Molinari et al., 1995; Morel et al., 1993; Morel and Kaas, 1992; Pandya et al., 1994; Rauschecker et al., 1997). Rauschecker et al (1997) found that injections of CM labeled MGd and Po, especially at more rostral levels of the MGC. But this topography can vary by thalamic subdivision and cortical area. In previous studies, for example, MGpd was more broadly connected with both rostral and caudal areas of the lateral belt and parabelt, compared to MGad (Hackett et al., 1998b; Molinari et al., 1995). This contrasts with the rather distinct projections of MGpd and MGad to RM and CM described in this report.
Fig. 16.
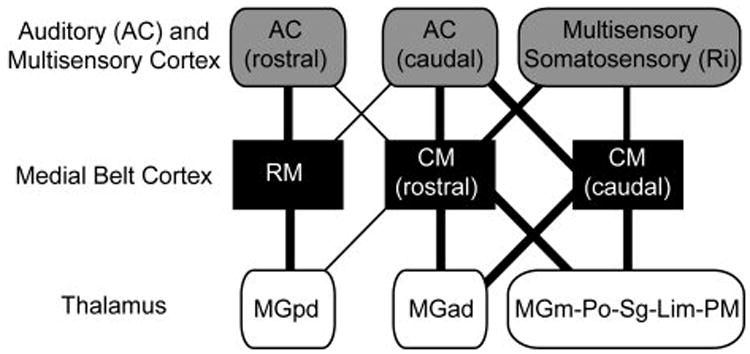
Summary of main cortical and thalamic connections of the medial belt areas, RM and CM (black shading). Relative connection strength is represented by line width. RM has dense cortical connections with other rostral areas of auditory cortex (AC, light shading), weaker connections with caudal AC fields, and minimal connections with somatosensory or multisensory areas of cortex. The arbitrary division between rostral and caudal AC is centered at the border of A1 and R, extending laterally and medially through the belt and parabelt areas (see Fig. 1). Thalamic connections (no shading) strongly favor MGpd. Rostral and caudal portions of CM have dense connections with caudal AC and multisensory areas, especially the somatosensory area, Ri. Rostral CM has moderate connections with rostral AC, whereas caudal CM has few. The thalamic connections of CM favor MGad and the multisensory nuclei.
The segregation of these two pathways is intriguing given certain the subset of primary-like response properties observed in CM and a hypothesis about the primate MGad. In cats, the lateral division of the posterior nuclear group (Pol) appears to correspond, at least in part, to the rostral pole (RP) of the MGC. This division receives its principal inputs from the central nucleus of the inferior colliculus (ICc), and has dense connections with both A1 and AAF (Andersen et al., 1980; Lee et al., 2004). Pol is also tonotopically organized, and populated by neurons with narrow tuning and short latencies comparable to MGv (Imig and Morel, 1984; Imig and Morel, 1985a; Imig and Morel, 1985b) Thus, these data imply that both MGv and Pol may belong to the primary (lemniscal) pathway. On anatomical grounds, Jones (Jones, 1997) has suggested that Pol (RP) may correspond to the MGad in monkeys, which expands to occupy the rostral pole of the MGC. Both nuclei contain small densely-packed cells and contain the highest density of parvalbumin-immunoreactive (PV-IR) cells in the MGC (Molinari et al., 1995). In monkeys, as in cats, MGv and MGad (Pol, RP) appear to receive inputs from the central nucleus of the inferior colliculus through a PV-IR pathway ascending in the brachium of the inferior colliculus (Molinari et al., 1995), linking both to the lemniscal pathway. Further, limited data from primates suggests that at least part of MGd is tonotopically organized (Gross et al., 1974), with latencies ranging from long to short, matching those of MGv (Allon et al., 1981). Thus, if MGad does, in fact, belong to the lemniscal auditory pathway, then the preferential connection between MGad and CM may account for certain functional similarities observed between neurons in A1 and CM, such as tonotopic organization and short-latency responses to pure tones and noise bursts (Bieser and Muller-Preuss, 1996; Cheung et al., 2001; Kajikawa et al., 2005; Lakatos et al., 2005). In addition, the subcortical inputs to CM would be in line with the inputs to AAF of the cat and other mammals, since no other auditory cortical areas receive such a dense projection from MGad or Pol (RP)(Lee and Winer, 2005; Lee et al., 2004).
Inputs from the other divisions of the MGC to RM and CM were similar. First, neither area received substantial inputs from the MGv, in keeping with their designation as belt areas. In that respect, CM differs from AAF in the cat, since AAF receives significant inputs from MGv and RP (Pol) in that species (Lee et al., 2004). Second, both areas received significant dense inputs from segregated clusters of cells located in the ventral and dorsal parts of MGm. While it could not be determined whether any of these cells project to both RM and CM, it seems likely that overlapping MGm projections reflect some degree of functional congruence between the two areas. On the other hand, it is important to recognize that MGm is structurally diverse (Winer and Morest, 1983), and projects broadly to auditory cortex through at least two types of projections. One group, comprised mainly of calbindin-IR neurons, projects to layers I and II of cortex, while projections to the middle layers represent a mix of calbindin- and parvalbumin- IR neurons which tend to be organized in segregated clusters (Hashikawa et al., 1995; Jones, 2003; Molinari et al., 1995). While there has been some evidence of topography in the projections from MGm, it is not clear how this may reflect regional variations in function (Hackett et al., 1998b; Jones, 2003; Kosmal et al., 1997). For example, most MGm neurons respond reliably to auditory stimulation and there is some evidence of tonotopic organization rostrally (Rouiller et al., 1989), but response properties vary widely. This profile is complicated by a wide range of nonauditory inputs which are known to drive responses to somatic, vestibular, visual, and nociceptive stimuli in mammals other than primates (Blum et al., 1979; Blum and Gilman, 1979; Bordi and LeDoux, 1994; Curry, 1972; Lippe and Weinberger, 1973; Love and Scott, 1969; Phillips and Irvine, 1979; Poggio and Mountcastle, 1960; Wepsic, 1966). If these properties have been retained in primates, they may contribute in some way to nonauditory responses observed in CM, and perhaps other auditory cortical areas. This subject is explored in more detail below.
Connections of RM and CM with other posterior thalamic nuclei
A secondary difference between RM and CM noted in the present study concerned their connections with nuclei outside of the MGC. CM had more inputs from Po, Sg, Lim, and PM (Figs. 9, 16). Although not intensively studied in primates, the potential significance of such projections to CM may relate to convergent auditory, somatosensory, and visual projections among these nuclei, which are generally regarded as multisensory (Linke and Schwegler, 2000). So far, multisensory (auditory, somatosensory) activity in auditory cortex has been explored in CM and A1, but only in CM have nonauditory responses been found (Fu et al., 2003; Robinson and Burton, 1980; Schroeder and Foxe, 2002; Schroeder et al., 2001). With respect to thalamic connections, CM and A1 both receive inputs from Po, Sg, and Lim, as well as MGm, yet only neurons in CM respond to both auditory and somatic stimulation. This dichotomy can be interpreted in several ways. First, it may be that inputs from these nuclei do not drive activity in cortex. In that case, the projections to CM from the retroinsular somatosensory area, Ri, may be mostly responsible for somatosensory activity in CM, as suggested in the companion to this paper (de la Mothe et al., 0000), since A1 lacks strong input from multisensory areas in cortex. Second, projections to A1 and CM may arise from functionally disparate subpopulations of neurons within each of the multisensory nuclei. The projections to CM from these nuclei are certainly much stronger than to A1, and may affect cortical activity differently in A1 and CM. Third, somatosensory activity in CM may depend on coincident inputs from thalamus and cortex. In that case, neuronal activity in A1 may be weakly modulated by inputs from multisensory nuclei in thalamus, but not driven, since A1 lacks strong inputs from a somatosensory area (e.g., Ri,). Currently, it is known from multichannel laminar recordings that convergent auditory and somatosensory activity in CM begins in layer IV at about 11 ms, then spreads rapidly to the supragranular and infragranular layers, characteristic of a feedforward pattern of projections (Schroeder and Foxe, 2002; Schroeder et al., 2001). This response profile is consistent with projections to layer IV and the deep part of layer III from parvalbumin-IR cells in MGad and MGm (Hashikawa et al., 1995; Hashikawa et al., 1991). In addition, multisensory nuclei other than MGm also appear to project to the middle cortical layers of cortex in this region. Burton and Jones (Burton and Jones, 1976; Jones and Burton, 1976) found that the projections of Po to CM (Pa) and Ri were concentrated in the lower half of layer III, with minor inputs to the upper half of layer IV. They also found that terminations of Sg and Lim in the granular insula (Ig) were concentrated in lower III and upper lamina IV, coextensive with the pyramidal cells in IIIb, suggesting a similar profile may hold for CM and perhaps Ri. These patterns seem consistent with the laminar profile of connections of A1 and CM observed in the companion study (de la Mothe et al., 0000). Injections in CM revealed dense inputs from infragranular and supragranular layers in A1 and Ri. In addition, a CTB injection of A1 revealed overlapping anterograde and retrograde connections centered on the middle cortical layers of CM, as well as layer V. Thus, multisensory inputs from both the cortex and thalamus appear to converge in layer III of CM. The functional significance of this connection pattern could be addressed by coupling simultaneous laminar recordings from A1 and CM with recordings and systematic deactivation of thalamic nuclei and Ri.
Corticotectal Projections of RM and CM
Injections of both RM and CM revealed projections to the dorsomedial region of the inferior colliculus bilaterally, but stronger ipsilaterally. In addition, CM projections extended ventromedially, within a narrow pericentral shell that wrapped around the ventral boundary of the central nucleus and continued dorsolaterally into the lateral nucleus. The projection to the dorsomedial region has been observed after auditory cortical injections involving the core and belt regions of primates and other species (FitzPatrick and Imig, 1978; Luethke et al., 1989; Morel and Kaas, 1992; Winer et al., 2002). The pattern of projections appears to differ between tonotopic and non-tonotopic areas of auditory cortex (Winer et al., 2002). In the present study, the more extensive labeling of ventral and lateral pericentral shell observed after CM injections may reflect functional distinctions between RM and CM. Of particular interest are the observations of auditory and somatosensory interactions in the lateral (external) nucleus of cats (Aitkin et al., 1978; Aitkin et al., 1981). If this organization has been conserved in primates, it would be consistent with the multisensory features of CM. We did not find corticofugal projections to the superior colliculus (SC) or any other subcortical structure. In cats, injections of the anterior ectosylvian sulcus resulted in projections to the SC, but no projections were found after injections involving any of the other auditory fields (e.g., A1, AAF, AII)(Meredith and Clemo, 1989). The absence of a projection to SC suggests that CM probably does not correspond to AES in cats. The absence of projections to other subcortical nuclei is intriguing, given evidence of widespread corticofugal inputs from auditory cortex throughout the brainstem of other species (Winer, 2005). Additional studies may be needed to examine these connections in primates.
Thalamocortical connections of A1 and R
The main projection to the core areas A1 and R derived from cells grouped in discrete topographic domains within the MGv (Fig. 15). The locations of these clusters varied with location within A1 and R in patterns that reflected the tonotopic organization of both areas. High frequency parts of A1 and R were connected with relatively dorsal and dorsomedial portions of MGv, while low frequency domains in A1 and R were linked to the ventral part of MGv. Similar results were previously obtained after A1 injections in marmosets and other primates (Aitkin et al., 1988; FitzPatrick and Imig, 1978; Luethke et al., 1989; Morel et al., 1993; Morel and Kaas, 1992; Rauschecker et al., 1997), although the extent of label in MGv was often larger, depending on the tracer used and the injection size.
Additional connections of A1 and R in the present study in some ways echoed those of RM and CM. Like CM, A1 had more connections outside of MGC than did R, especially with Po and Sg. A similar pattern can be found in owl monkey auditory cortex, where injections of A1 labeled more cells in Sg, Lim and Po than injections of either R or RT (Morel and Kaas, 1992). As discussed above, this pattern appears to reflect greater involvement of the caudal auditory fields (i.e., A1, CM) with multisensory activity in the cortex and thalamus, and may represent a functional distinction between A1 and the rostral core areas, R and RT. Otherwise, the connections of A1 and R were consistent with our working model of primate auditory cortex, in which the core areas receive primary (lemniscal) inputs from the MGv, whereas the main input to the belt areas arise from the MGad and MGpd.
Conclusions
The results of the current study indicate that the medial belt areas RM and CM of the marmoset monkey have distinctive and identifiable patterns of thalamocortical connections (Fig. 16). When these results are considered alongside those of the companion paper (de la Mothe et al., 0000), it is quite clear that RM and CM represent anatomically-distinct areas of auditory belt cortex. RM receives inputs from the MGpd, and is broadly connected with both rostral and caudal areas of auditory cortex. Thalamic inputs to CM arise mainly from the MGad, and CM has stronger connections with caudal areas of auditory cortex. In addition, CM has a greater proportion of inputs from multisensory nuclei in the posterior thalamus. Parallel inputs to the core areas A1 and R arise from the MGv. These connections are topographically organized in the MGv in a manner that reflects the tonotopic organization of A1 and R. The architectonic features of the marmoset MGC indicated that the subdivisions identified in the macaque monkey can also be identified in marmosets using the same criteria, suggesting that the organization of the MGC is highly conserved among primates.
Acknowledgments
The authors wish to thank Laura Trice and Mary Varghese for outstanding technical assistance with histology. The authors also thank the reviewers for many insightful suggestions.
Grant Support: This research was supported by NIH/NIDCD R01 04318 to T.A.H.
Table of Abbreviations
- A1
Auditory area 1 (core)
- AChE
Acetylcholinesterase
- AD
Medial geniculate complex anterodorsal division
- AL
Anterolateral area (belt)
- AS
Arcuate sulcus
- BDA
Biotinylated dextran amine (tracer)
- BIC
Brachium of the inferior colliculus
- BrSC
Brachium of the superior colliculus
- CG
Central Grey
- CIC
Commissure of the inferior colliculus
- Cis
Circular sulcus
- CL
Caudolateral area (belt)
- CM
Caudomedial area (belt)
- CMd
Centromedian
- CO
Cytochrome oxidase
- CPB
Caudal parabelt area (parabelt)
- CS
Central sulcus
- CTB
Cholera toxin subunit B (tracer)
- dc
Dorsal cortex of the inferior colliculus
- dm
Dorsomedial portion of the inferior colliculus
- FB
Fast Blue (tracer)
- FE
Fluoroemerald (tracer)
- FR
Fluororuby (tracer)
- Hb
Habenular nucleus
- IC
Inferior Colliculus
- ICc
Central nucleus of the inferior colliculus
- Ins
Insula
- IPS
Intraparietal sulcus
- LGN
Lateral geniculate nucleus
- Lim
Limitans nucleus
- ln
Lateral nucleus of the inferior colliculus
- LS
Lateral sulcus
- LuS
Lunate sulcus
- M
Medial geniculate complex magnocellular division
- MD
Medial dorsal nucleus
- MF
Myelinated fibers
- MGad
Medial geniculate complex anterodorsal division
- MGC
Medial geniculate complex
- MGm
Medial geniculate complex magnocellular division
- MGpd
Medial geniculate complex posterodorsal division
- MGv
Medial geniculate complex ventral division
- ML
Middle lateral area (belt)
- PA
Anterior (oral) pulvinar
- PD
Medial geniculate complex posterodorsal division
- PI
Inferior pulvinar
- PIc
Inferior pulvinar central division
- PIm
Inferior pulvinar medial division
- PIp
Inferior pulvinar posterior division
- PL
Lateral pulvinar
- PM
Medial pulvinar
- Po
Posterior nucleus
- PPN
Peripeduncular nucleus
- Pro
Proisocortical area
- PV
Parietoventral area
- R
Rostral area (core)
- Ri
Retroinsular area
- RM
Rostromedial area (belt)
- RPB
Rostral parabelt area (parabelt)
- RT
Rostrotemporal area (core)
- RTL
Rostrotemporal lateral area (belt)
- RTM
Rostrotemporal medial area (belt)
- S2
Somatosensory area 2
- SC
Superior Colliculus
- Sg
Suprageniculate nucleus
- SN
Sustantia Nigra
- STG
Supeior temporal gyrus
- STS
Superior temporal sulcus
- T
Thalamus
- Tpt
Temporal parietotemporal area
- V
Medial geniculate complex, ventral division
- vm
Ventromedial portion of the inferior colliculus
- VPI
Ventroposterior nucleus, inferior division
- VPL
Ventroposterior nucleus, lateral division
- VPM
Ventroposterior nucleus, medial division
- VPS
Ventroposterior nucleus, superior division
- ZI
Zonus intermedius
References
- Aitkin LM, Dickhaus H, Schult W, Zimmermann M. External nucleus of inferior colliculus: auditory and spinal somatosensory afferents and their interactions. J Neurophysiol. 1978;41(4):837–847. doi: 10.1152/jn.1978.41.4.837. [DOI] [PubMed] [Google Scholar]
- Aitkin LM, Kenyon CE, Philpott P. The representation of the auditory and somatosensory systems in the external nucleus of the cat inferior colliculus. J Comp Neurol. 1981;196(1):25–40. doi: 10.1002/cne.901960104. [DOI] [PubMed] [Google Scholar]
- Aitkin LM, Kudo M, Irvine DR. Connections of the primary auditory cortex in the common marmoset, Callithrix jacchus jacchus. J Comp Neurol. 1988;269(2):235–248. doi: 10.1002/cne.902690208. [DOI] [PubMed] [Google Scholar]
- Allon N, Yeshurun Y, Wollberg Z. Responses of single cells in the medial geniculate body of awake squirrel monkeys. Exp Brain Res. 1981;41(3-4):222–232. doi: 10.1007/BF00238879. [DOI] [PubMed] [Google Scholar]
- Andersen RA, Knight PL, Merzenich MM. The thalamocortical and corticothalamic connections of AI, AII, and the anterior auditory field (AAF) in the cat: evidence for two largely segregated systems of connections. J Comp Neurol. 1980;194(3):663–701. doi: 10.1002/cne.901940312. [DOI] [PubMed] [Google Scholar]
- Bieser A, Muller-Preuss P. Auditory responsive cortex in the squirrel monkey: neural responses to amplitude-modulated sounds. Exp Brain Res. 1996;108(2):273–284. doi: 10.1007/BF00228100. [DOI] [PubMed] [Google Scholar]
- Blum PS, Abraham LD, Gilman S. Vestibular, auditory, and somatic input to the posterior thalamus of the cat. Exp Brain Res. 1979;34(1):1–9. doi: 10.1007/BF00238337. [DOI] [PubMed] [Google Scholar]
- Blum PS, Gilman S. Vestibular, somatosensory, and auditory input to the thalamus of the cat. Exp Neurol. 1979;65(2):343–354. doi: 10.1016/0014-4886(79)90103-1. [DOI] [PubMed] [Google Scholar]
- Bordi F, LeDoux JE. Response properties of single units in areas of rat auditory thalamus that project to the amygdala. II. Cells receiving convergent auditory and somatosensory inputs and cells antidromically activated by amygdala stimulation. Exp Brain Res. 1994;98(2):275–286. doi: 10.1007/BF00228415. [DOI] [PubMed] [Google Scholar]
- Burton H, Jones EG. The posterior thalamic region and its cortical projection in New World and Old World monkeys. J Comp Neurol. 1976;168(2):249–301. doi: 10.1002/cne.901680204. [DOI] [PubMed] [Google Scholar]
- Cheung SW, Bedenbaugh PH, Nagarajan SS, Schreiner CE. Functional organization of squirrel monkey primary auditory cortex: responses to pure tones. J Neurophysiol. 2001;85(4):1732–1749. doi: 10.1152/jn.2001.85.4.1732. [DOI] [PubMed] [Google Scholar]
- Curry MJ. The exteroceptive properties of neurones in the somatic part of the posterior group (PO) Brain Res. 1972;44(2):439–462. doi: 10.1016/0006-8993(72)90313-7. [DOI] [PubMed] [Google Scholar]
- de la Mothe LA, Blumell S, Kajikawa Y, Hackett TA. Cortical connections of auditory cortex in marmoset monkeys: core and medial belt regions. J Comp Neurol. 0000;00:0000–0000. doi: 10.1002/cne.20923. [DOI] [PubMed] [Google Scholar]
- FitzPatrick KA, Imig TJ. Projections of auditory cortex upon the thalamus and midbrain in the owl monkey. J Comp Neurol. 1978;177(4):573–555. doi: 10.1002/cne.901770402. [DOI] [PubMed] [Google Scholar]
- Fu KM, Johnston TA, Shah AS, Arnold L, Smiley J, Hackett TA, Garraghty PE, Schroeder CE. Auditory cortical neurons respond to somatosensory stimulation. J Neurosci. 2003;23(20):7510–7515. doi: 10.1523/JNEUROSCI.23-20-07510.2003. [DOI] [PMC free article] [PubMed] [Google Scholar]
- Galaburda AM, Pandya DN. The intrinsic architectonic and connectional organization of the superior temporal region of the rhesus monkey. J Comp Neurol. 1983;221(2):169–184. doi: 10.1002/cne.902210206. [DOI] [PubMed] [Google Scholar]
- Gallyas F. Silver staining of myelin by means of physical development. Neurol Res. 1979;1(2):203–209. doi: 10.1080/01616412.1979.11739553. [DOI] [PubMed] [Google Scholar]
- Geneser-Jensen FA, Blackstad TW. Distribution of acetyl cholinesterase in the hippocampal region of the guinea pig. I. Entorhinal area, parasubiculum, and presubiculum. Z Zellforsch Mikrosk Anat. 1971;114(4):460–481. doi: 10.1007/BF00325634. [DOI] [PubMed] [Google Scholar]
- Gray D, Gutierrez C, Cusick CG. Neurochemical organization of inferior pulvinar complex in squirrel monkeys and macaques revealed by acetylcholinesterase histochemistry, calbindin and Cat-301 immunostaining, and Wisteria floribunda agglutinin binding. J Comp Neurol. 1999;409(3):452–468. doi: 10.1002/(sici)1096-9861(19990705)409:3<452::aid-cne9>3.0.co;2-i. [DOI] [PubMed] [Google Scholar]
- Gross NB, Lifschitz WS, Anderson DJ. The tonotopic organization of the auditory thalamus of the squirrel monkey (Saimiri sciureus) Brain Res. 1974;65(2):323–332. doi: 10.1016/0006-8993(74)90044-4. [DOI] [PubMed] [Google Scholar]
- Hackett TA, Karmos G, Schroeder CE, Ulbert I, Sterbing-D'Angelo SJ, D'Angelo WR, Kajikawa Y, Blumell S, de la Mothe L. Neurosurgical access to cortical areas in the lateral fissure of primates. J Neurosci Methods. 2005;141(1):103–113. doi: 10.1016/j.jneumeth.2004.06.001. [DOI] [PubMed] [Google Scholar]
- Hackett TA, Stepniewska I, Kaas JH. Subdivisions of auditory cortex and ipsilateral cortical connections of the parabelt auditory cortex in macaque monkeys. J Comp Neurol. 1998a;394(4):475–495. doi: 10.1002/(sici)1096-9861(19980518)394:4<475::aid-cne6>3.0.co;2-z. [DOI] [PubMed] [Google Scholar]
- Hackett TA, Stepniewska I, Kaas JH. Thalamocortical connections of the parabelt auditory cortex in macaque monkeys. J Comp Neurol. 1998b;400(2):271–286. doi: 10.1002/(sici)1096-9861(19981019)400:2<271::aid-cne8>3.0.co;2-6. [DOI] [PubMed] [Google Scholar]
- Hashikawa T, Molinari M, Rausell E, Jones EG. Patchy and laminar terminations of medial geniculate axons in monkey auditory cortex. J Comp Neurol. 1995;362(2):195–208. doi: 10.1002/cne.903620204. [DOI] [PubMed] [Google Scholar]
- Hashikawa T, Rausell E, Molinari M, Jones EG. Parvalbumin- and calbindin-containing neurons in the monkey medial geniculate complex: differential distribution and cortical layer specific projections. Brain Res. 1991;544(2):335–341. doi: 10.1016/0006-8993(91)90076-8. [DOI] [PubMed] [Google Scholar]
- Imig TJ, Morel A. Topographic and cytoarchitectonic organization of thalamic neurons related to their targets in low-, middle-, and high-frequency representations in cat auditory cortex. J Comp Neurol. 1984;227(4):511–539. doi: 10.1002/cne.902270405. [DOI] [PubMed] [Google Scholar]
- Imig TJ, Morel A. Tonotopic organization in lateral part of posterior group of thalamic nuclei in the cat. J Neurophysiol. 1985a;53(3):836–851. doi: 10.1152/jn.1985.53.3.836. [DOI] [PubMed] [Google Scholar]
- Imig TJ, Morel A. Tonotopic organization in ventral nucleus of medial geniculate body in the cat. J Neurophysiol. 1985b;53(1):309–340. doi: 10.1152/jn.1985.53.1.309. [DOI] [PubMed] [Google Scholar]
- Jones EG. The relay function of the thalamus during brain activation. In: Steriade M, Jones E, McCormick D, editors. Thalamus. New York: Elsevier; 1997. pp. 393–531. [Google Scholar]
- Jones EG. Chemically defined parallel pathways in the monkey auditory system. Ann N Y Acad Sci. 2003;999:218–233. doi: 10.1196/annals.1284.033. [DOI] [PubMed] [Google Scholar]
- Jones EG, Burton H. Areal differences in the laminar distribution of thalamic afferents in cortical fields of the insular, parietal and temporal regions of primates. J Comp Neurol. 1976;168(2):197–247. doi: 10.1002/cne.901680203. [DOI] [PubMed] [Google Scholar]
- Jones EG, Dell'Anna ME, Molinari M, Rausell E, Hashikawa T. Subdivisions of macaque monkey auditory cortex revealed by calcium-binding protein immunoreactivity. J Comp Neurol. 1995;362(2):153–170. doi: 10.1002/cne.903620202. [DOI] [PubMed] [Google Scholar]
- Kaas JH, Hackett TA. Subdivisions of auditory cortex and processing streams in primates. Proc Natl Acad Sci U S A. 2000;97(22):11793–11799. doi: 10.1073/pnas.97.22.11793. [DOI] [PMC free article] [PubMed] [Google Scholar]
- Kajikawa Y, de la Mothe LA, Blumell S, Hackett TA. A comparison of neuron response properties in areas A1 and CM of the marmoset monkey auditory cortex: tones and broad band noise. J Neurophysiol. 2005;93:22–34. doi: 10.1152/jn.00248.2004. [DOI] [PubMed] [Google Scholar]
- Kajikawa Y, Hackett TA. Entropy analysis of neuronal spike train synchrony. J Neurosci Methods. 2005;000:0000–0000. doi: 10.1016/j.jneumeth.2005.05.011. [DOI] [PubMed] [Google Scholar]
- Kosmal A, Malinowska M, Kowalska DM. Thalamic and amygdaloid connections of the auditory association cortex of the superior temporal gyrus in rhesus monkey (Macaca mulatta) Acta Neurobiol Exp (Wars) 1997;57(3):165–188. doi: 10.55782/ane-1997-1224. [DOI] [PubMed] [Google Scholar]
- Lakatos P, Pincze Z, Fu KG, Javitt DC, Karmos G, Schroeder CE. Timing of pure tone and noise-evoked responses in macaque auditory cortex. Neuroreport. 2005;16(9):933–937. doi: 10.1097/00001756-200506210-00011. [DOI] [PubMed] [Google Scholar]
- Lee C, Winer J. Principles Governing Auditory Cortex Connections 2005:-. doi: 10.1093/cercor/bhi057. [DOI] [PubMed] [Google Scholar]
- Lee CC, Imaizumi K, Schreiner CE, Winer JA. Concurrent tonotopic processing streams in auditory cortex. Cereb Cortex. 2004;14(4):441–451. doi: 10.1093/cercor/bhh006. [DOI] [PubMed] [Google Scholar]
- Lewis JW, Van Essen DC. Corticocortical connections of visual, sensorimotor, and multimodal processing areas in the parietal lobe of the macaque monkey. J Comp Neurol. 2000;428(1):112–137. doi: 10.1002/1096-9861(20001204)428:1<112::aid-cne8>3.0.co;2-9. [DOI] [PubMed] [Google Scholar]
- Linke R, Schwegler H. Convergent and complementary projections of the caudal paralaminar thalamic nuclei to rat temporal and insular cortex. Cereb Cortex. 2000;10(8):753–771. doi: 10.1093/cercor/10.8.753. [DOI] [PubMed] [Google Scholar]
- Lippe WR, Weinberger NM. The distribution of sensory evoked activity within the medial geniculate body of the unanesthetized cat. Exp Neurol. 1973;40(2):431–444. doi: 10.1016/0014-4886(73)90085-x. [DOI] [PubMed] [Google Scholar]
- Love JA, Scott JW. Some response characteristics of cells of the magnocellular division of the medial geniculate body of the cat. Can J Physiol Pharmacol. 1969;47(10):881–888. doi: 10.1139/y69-145. [DOI] [PubMed] [Google Scholar]
- Luethke LE, Krubitzer LA, Kaas JH. Connections of primary auditory cortex in the New World monkey, Saguinus. J Comp Neurol. 1989;285(4):487–513. doi: 10.1002/cne.902850406. [DOI] [PubMed] [Google Scholar]
- Meredith MA, Clemo HR. Auditory cortical projection from the anterior ectosylvian sulcus (Field AES) to the superior colliculus in the cat: an anatomical and electrophysiological study. J Comp Neurol. 1989;289(4):687–707. doi: 10.1002/cne.902890412. [DOI] [PubMed] [Google Scholar]
- Molinari M, Dell'Anna ME, Rausell E, Leggio MG, Hashikawa T, Jones EG. Auditory thalamocortical pathways defined in monkeys by calcium-binding protein immunoreactivity. J Comp Neurol. 1995;362(2):171–194. doi: 10.1002/cne.903620203. [DOI] [PubMed] [Google Scholar]
- Morel A, Garraghty PE, Kaas JH. Tonotopic organization, architectonic fields, and connections of auditory cortex in macaque monkeys. J Comp Neurol. 1993;335(3):437–459. doi: 10.1002/cne.903350312. [DOI] [PubMed] [Google Scholar]
- Morel A, Kaas JH. Subdivisions and connections of auditory cortex in owl monkeys. J Comp Neurol. 1992;318(1):27–63. doi: 10.1002/cne.903180104. [DOI] [PubMed] [Google Scholar]
- Pandya DN, Rosene DL, Doolittle AM. Corticothalamic connections of auditory-related areas of the temporal lobe in the rhesus monkey. J Comp Neurol. 1994;345(3):447–471. doi: 10.1002/cne.903450311. [DOI] [PubMed] [Google Scholar]
- Phillips DP, Irvine DR. Acoustic input to single neurons in pulvinar-posterior complex of cat thalamus. J Neurophysiol. 1979;42(1 Pt 1):123–136. doi: 10.1152/jn.1979.42.1.123. [DOI] [PubMed] [Google Scholar]
- Poggio GF, Mountcastle VB. A study of the functional contributions of the lemniscal and spinothalamic systems to somatic sensibility. Central nervous mechanisms in pain. Bull Johns Hopkins Hosp. 1960;106:266–316. [PubMed] [Google Scholar]
- Rauschecker JP. Parallel processing in the auditory cortex of primates. Audiol Neurootol. 1998;3(2-3):86–103. doi: 10.1159/000013784. [DOI] [PubMed] [Google Scholar]
- Rauschecker JP, Tian B. Mechanisms and streams for processing of “what” and “where” in auditory cortex. Proc Natl Acad Sci U S A. 2000;97(22):11800–11806. doi: 10.1073/pnas.97.22.11800. [DOI] [PMC free article] [PubMed] [Google Scholar]
- Rauschecker JP, Tian B. Processing of band-passed noise in the lateral auditory belt cortex of the rhesus monkey. J Neurophysiol. 2004;91(6):2578–2589. doi: 10.1152/jn.00834.2003. [DOI] [PubMed] [Google Scholar]
- Rauschecker JP, Tian B, Hauser M. Processing of complex sounds in the macaque nonprimary auditory cortex. Science. 1995;268(5207):111–114. doi: 10.1126/science.7701330. [DOI] [PubMed] [Google Scholar]
- Rauschecker JP, Tian B, Pons T, Mishkin M. Serial and parallel processing in rhesus monkey auditory cortex. J Comp Neurol. 1997;382(1):89–103. [PubMed] [Google Scholar]
- Robinson CJ, Burton H. Organization of somatosensory receptive fields in cortical areas 7b, retroinsula, postauditory and granular insula of M. fascicularis. J Comp Neurol. 1980;192(1):69–92. doi: 10.1002/cne.901920105. [DOI] [PubMed] [Google Scholar]
- Romanski LM, Bates JF, Goldman-Rakic PS. Auditory belt and parabelt projections to the prefrontal cortex in the rhesus monkey. J Comp Neurol. 1999a;403(2):141–157. doi: 10.1002/(sici)1096-9861(19990111)403:2<141::aid-cne1>3.0.co;2-v. [DOI] [PubMed] [Google Scholar]
- Romanski LM, Tian B, Fritz J, Mishkin M, Goldman-Rakic PS, Rauschecker JP. Dual streams of auditory afferents target multiple domains in the primate prefrontal cortex. Nat Neurosci. 1999b;2(12):1131–1136. doi: 10.1038/16056. [DOI] [PMC free article] [PubMed] [Google Scholar]
- Schroeder CE, Foxe JJ. The timing and laminar profile of converging inputs to multisensory areas of the macaque neocortex. Brain Res Cogn Brain Res. 2002;14(1):187–198. doi: 10.1016/s0926-6410(02)00073-3. [DOI] [PubMed] [Google Scholar]
- Schroeder CE, Lindsley RW, Specht C, Marcovici A, Smiley JF, Javitt DC. Somatosensory input to auditory association cortex in the macaque monkey. J Neurophysiol. 2001;85(3):1322–1327. doi: 10.1152/jn.2001.85.3.1322. [DOI] [PubMed] [Google Scholar]
- Stepniewska I, Kaas JH. Architectonic subdivisions of the inferior pulvinar in New World and Old World monkeys. Vis Neurosci. 1997;14(6):1043–1060. doi: 10.1017/s0952523800011767. [DOI] [PubMed] [Google Scholar]
- Stepniewska I, Ql HX, Kaas JH. Projections of the superior colliculus to subdivisions of the inferior pulvinar in New World and Old World monkeys. Vis Neurosci. 2000;17(4):529–549. doi: 10.1017/s0952523800174048. [DOI] [PubMed] [Google Scholar]
- Tian B, Reser D, Durham A, Kustov A, Rauschecker JP. Functional specialization in rhesus monkey auditory cortex. Science. 2001;292(5515):290–293. doi: 10.1126/science.1058911. [DOI] [PubMed] [Google Scholar]
- Wepsic JG. Multimodal sensory activation of cells in the magnocellular medial geniculate nucleus. Exp Neurol. 1966;15(3):299–318. doi: 10.1016/0014-4886(66)90053-7. [DOI] [PubMed] [Google Scholar]
- Winer JA. Decoding the auditory corticofugal systems. Hearing Research. 2005;207(1-2):1–9. doi: 10.1016/j.heares.2005.06.007. [DOI] [PubMed] [Google Scholar]
- Winer JA, Chernock ML, Larue DT, Cheung SW. Descending projections to the inferior colliculus from the posterior thalamus and the auditory cortex in rat, cat, and monkey. Hear Res. 2002;168(1-2):181–195. doi: 10.1016/s0378-5955(02)00489-6. [DOI] [PubMed] [Google Scholar]
- Winer JA, Morest DK. The medial division of the medial geniculate body of the cat: implications for thalamic organization. J Neurosci. 1983;3(12):2629–2651. doi: 10.1523/JNEUROSCI.03-12-02629.1983. [DOI] [PMC free article] [PubMed] [Google Scholar]
- Wong-Riley M. Changes in the visual system of monocularly sutured or enucleated cats demonstrable with cytochrome oxidase histochemistry. Brain Res. 1979;171(1):11–28. doi: 10.1016/0006-8993(79)90728-5. [DOI] [PubMed] [Google Scholar]


