Abstract
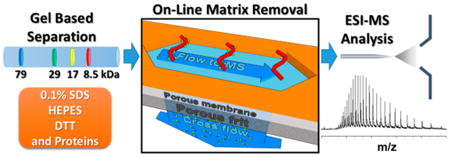
A fractionation method called gel-eluted liquid fraction entrapment electrophoresis (GELFrEE) has been used to dramatically increase the number of proteins identified in top-down proteomic workflows; however, the technique involves the use of sodium dodecyl sulfate (SDS), a surfactant that interferes with electrospray ionization. Therefore, an efficient removal of SDS is absolutely required prior to mass analysis. Traditionally, methanol/chloroform precipitation and spin columns have been used, but they lack reproducibility and are difficult to automate. Therefore, we developed an in-line matrix removal platform to enable the direct analysis of samples containing SDS and salts. Only small molecules like SDS permeate a porous membrane and are removed in a manner similar to cross-flow filtration. With this device, near-complete removal of SDS is accomplished within 5 min and proteins are subsequently mobilized into a mass spectrometer. The new platform was optimized for the analysis of GELFrEE fractions enriched for histones extracted from human HeLa cells. All four core histones and their proteoforms were detected in a single spectrum by high-resolution mass spectrometry. The new method versus protein precipitation/resuspension showed 2- to 10-fold improved signal intensities, offering a clear path forward to improve proteome coverage and the efficiency of top-down proteomics.
Keywords: top-down proteomics, online matrix removal device, gel-based separation, SDS cleanup, cross-flow filtration
Introduction
The identification and quantitation of intact proteins by mass spectrometry is an emergent technology for proteomic studies that provides complementary information to more traditional methods.1,2 The so-called “bottom-up” proteomic workflows that are now mature and widely implemented generally involve an optional fractionation followed by enzymatic digestion, generating complex mixtures of peptides. After sample preparation, the peptides are mass-analyzed following online chromatographic separation. Top-down proteomics offers a different approach that provides a proteoform-resolved view of proteins by analyzing intact proteins directly (i.e., no proteolysis).3 Consequently, intact molecular weights are measured directly, and molecular characterization is achieved via tandem mass spectrometry (MSn). The many advantages of this approach include the direct observation of the interplay between multiple post-translational modifications as well as the straightforward identification of changes in primary sequence (e.g., SNPs, isoforms or signal peptides).
While top-down workflows efficiently characterize intact proteins, sample complexity remains a challenge for high-throughput analyses. In most cases, proteomes are a complex mixture of diverse proteins whose concentrations span an immense dynamic range (>1010),4 making prefractionation a nearly indispensable component of top-down workflows. While reverse-phase chromatography (RPLC), isoelectric focusing (IEF), size-exclusion chromatography (SEC), and ion -exchange chromatography have all been utilized for prefractionation,5–8 the complexity of biological samples routinely requires multidimensional separations to achieve adequate peak capacity.
Gel-eluted liquid fraction entrapment electrophoresis (GEL-FrEE) is a size-based separation system for intact protein mixtures.9 It provides high resolution and reproducibility, operates over a broad mass range, and utilizes buffers that are compatible with a wide range of biological samples. As a result of these favorable characteristics, it has been used prior to LC–MS in top-down workflows;10,11 however, the fractions collected from GELFrEE include SDS and salts that interfere with electrospray ionization (ESI). Therefore, a cleanup process is required to remove the matrix prior to downstream analysis. Commonly, a methanol/chloroform precipitation/resuspension is performed for this reason.12 While precipitation can effectively remove matrices such as SDS and salts, it is accompanied by an unpredictable loss of protein13 or modification14 during precipitation or resuspension. Alternative methods involving the use of affinity spin columns,15,16 ion pairing agents,17,18 or centrifugal filter devices19 suffer from nonspecific binding and incomplete removal. An SDS depletion column using ion-exchange resin was also developed, and it enabled an online removal process but was applied only to peptides (bottom-up proteomics).20 Moreover, the precipitation step is difficult to automate with computer-based control for online coupling to mass spectrometry. Its reproducibility is also highly dependent on the experimenter.
Asymmetrical flow field-flow fractionation (AF4) is a variant of the field-flow fractionation methods that has primarily been applied to the separation of nanoparticles and biomacromolecules such as proteins and cells based on their hydrodynamic radius.21 In this technique, the average elevation of molecules above a semipermeable membrane is determined by the balance between an applied force field and the diffusion coefficients of the individual species being separated. The separation is achieved by the application of a laminar flow parallel to the semipermeable membrane. During laminar flow, the velocity at the wall of the vessel approaches zero, while flow maximizes at the center. Therefore, the analytes are swept down the device at different speeds, and they exit the device with different retention times. The resolution or separation efficiency of AF4 is similar to basic size exclusion chromatography, but the AF4 channel does not have a stationary phase, so shear stress or detrimental protein adsorption can be reduced.22,23 Because of these characteristics, AF4 has been used for prefractionation and separation in proteomics research;24,25 however, the additional advantage of the AF4 technique for this work is the removal of salts and surfactants by the cross-flow. This effect has been utilized previously to remove carrier ampholytes left over from an isoelectric focusing separation26 and to extract metals from soil particles via continuous-flow sequential extraction.27,28 The cross-flow (tangential flow) filtration methodology has been developed and widely used for various purification processes. For protein purification, it is also commercially available to fractionate proteins by size exclusion. However, those applications are focused on purification of specific proteins from cell lysate or other matrices for mass production.29 Small-scale sample handling (<1 mL or <1 μg) for efficient detergent removal on a microscale has not been intensively developed. The phenomenon of detergent removal during cross-flow filtration is already known, but its detailed mechanism is not clear; this effect has been applied only for the removal of nonionic detergent on a large scale.30
To improve the recovery and overall efficiency of whole protein MS, we constructed a new device, based on AF4 principles, that was modified to maximize the efficiency of small molecule removal. Furthermore, changes in construction materials enabled the use of organic and acidic solvents as a carrier solution, thereby enabling the eluent to be directly electrosprayed. The device was evaluated using similar flow rates (∼500 nL/min) and sample amounts (∼1 pmol) compatible with conventional nanoflow LC–MS. These figures of merit represent a 10-fold reduction from the aforementioned studies.
The platform reported here removes SDS and salts from GELFrEE fractions while keeping even denatured proteins in solution to a great extent. To that end, we demonstrate the efficient removal of these interferants using protein standards and standard GELFrEE fractions containing complex protein mixtures. Furthermore, the recovery following this new method was compared quantitatively to that achieved following methanol/chloroform precipitation. Finally, application to biological samples was demonstrated using GELFrEE to fractionate nuclear extracts containing histones from human HeLa S3 cells.
Experimental Section
Construction of the Matrix Removal Device
The removal device was designed and constructed in house, and the assembly and its schematic diagram are depicted in Figure 1. The main body consists of two stainless-steel plates.
Figure 1.
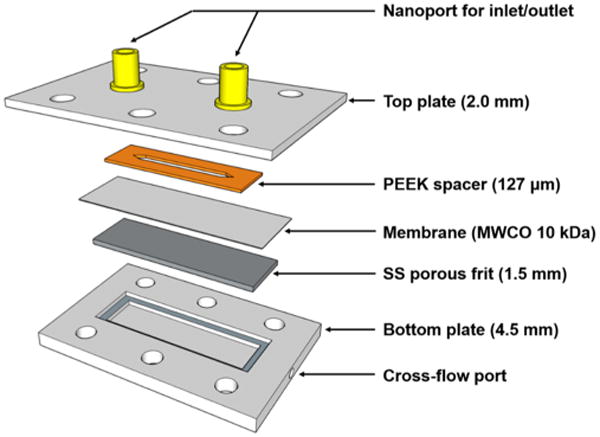
Schematic diagram of the matrix removal device. The nanoports were installed to connect to the injector, pump, or mass spectrometer source with fused silica capillary, and the cross-flow port was designed to accept 1/16″ HPLC fittings to vent carrier solution. All components are assembled by tightening bolts and nuts through the holes in the top and bottom plates.
The upper plate has two holes for connections to a high-performance liquid chromatography (HPLC) pump and a downstream ionization source. Two nanoport assemblies from IDEX were attached to accept 360 μm I.D. fused silica capillary tubing. On the bottom side of the upper plate, a spacer was attached to create a channel in which the carrier solution flows. The spacer was made of adhesive-backed PEEK tape (CS Hide, Lake Villa, IL). Its dimensions were 32 mm × 3.0 mm × 127 μm (length × breadth × thickness), and the inner volume of the device was 11.2 μL. The porous membrane sheet, a standard membrane used for ultrafiltration (Millipore, Danvers, MA), is made of regenerated cellulose with a polypropylene backing. Its pore size is ∼10 kDa molecular weight cutoff (MWCO), enabling detergents to exit while retaining intact proteins. The bottom plate is a 4.5 mm thick piece of stainless steel. Into this plate is machined a reservoir to collect the cross-flow, a port to drain the cross-flow reservoir, a frame for a stainless-steel frit, and a gland for an O-ring. The reservoir is connected to the port using fittings for 1/16″ tubing, and a general nitrile rubber O-ring was inserted into the O-ring gland (not shown in Figure 1). A sintered stainless-steel frit with 10 μm pore size was located between a membrane sheet and bottom plate. The device was assembled by tightening nuts to an equal torque (3.1 N m) to maintain the volume and thickness of the inner space.
Sample Preparation and Instrument
The carrier solution was composed of water purified by a Barnstead Nanopure system (Thermo Scientific, Newington, NH), HPLC-grade acetonitrile (Fisher Scientific, Pittsburgh, PA), formic acid (Fisher), and ammonium bicarbonate (Sigma, St. Louis, MO). The concentration of acetonitrile was adjusted to maximize detergent removal efficiency while maintaining stable electrospray. In practice, concentrations higher than 40% show relatively poor removal of SDS, so its concentration was set to 30%. Formic acid was added to adjust the pH and ammonium bicarbonate was added to adjust ionic strength. The final carrier solution was 7 mM NH4HCO3, 30% of ACN, and 0.1% formic acid. The conventional HPLC pump from an Agilent 1100 system (Agilent, Santa Clara, CA) was used to deliver the carrier flow and a manual injector (IDEX, Oak Harbor, WA) was used for sample injection.
Protein standards (myoglobin, ubiquitin, carbonic anhydrase, transferrin, and bovine serum albumin) and the reagents and solutions for cell lysis and histone fractionation were purchased from Sigma. The histone-enriched fractions from HeLa S3 cells were prepared from isolated nuclei using acid extraction as previously described. In brief, the nuclei were isolated by lysis in NIB-250 buffer (15 mM Tris-HCl, pH 7.5, 60 mM KCl, 15 mM NaCl, 5 mM MgCl2, 1 mM CaCl2, 250 mM sucrose, 1 mM dithiothreitol, 5 nM microcystin-LR, 500 μM 4-(2-aminoethyl) benzenesulfonyl fluoride, 10 mM sodium butyrate) and 0.3% NP-40. Histones were extracted with 0.4 N sulfuric acid and recovered by precipitation with TCA The pellet was washed with acetone and chloric acid and then stored −80 °C until resuspension in water for later experiments. The mass spectra were obtained either from an LTQ ion trap mass spectrometer (Thermo Fisher Scientific, San Jose, CA) or a Q Exactive HF orbitrap (Thermo Fisher Scientific, Bremen, Germany), both operating in positive ion mode. For higher mass species, 15 V of source fragmentation energy was applied and electrospray ionization was performed with 2.0 kV of voltage. The pulled-tip emitter for electrospray ionization (50 μm I.D., 12 μm orifice) from New Objective (Waltham, MA) was used to ensure both a reproducible flow rate and stable electrospray ionization. Identification of proteins from HeLa cell lysate was performed by ProSightPC 3.0 (Thermo Scientific, San Jose, CA). The database utilized for searching was constructed using ProSight's Database Manager Utility and a Swiss-Prot flat file downloaded from UniProtKB (UniProt release 2014_01).
Results and Discussion
In-Line Sample Injection, Coupling Setup, and Device Operation
The overall setup of the in-line removal device and flow direction of carrier solution is described in Figure 2. The flow from the pump was split 50:50 at the tee valve with both flows traveling to the device to remove matrix Therefore, both flows exit through the pores in the membrane sheet and the frit. This “cross-flow” is responsible for the removal of small molecules such as detergents or salts as it accomplishes a vigorous mobile phase exchange in the solvation sphere of the protein molecules.31 Additionally, when sample solution is injected via a manual injection valve during this “focusing” step, the analytes are retained by the membrane and form a narrow sample zone at the middle of the inner space, as described in Figure 2b. The focusing/matrix removal step takes ∼5 min at 0.3 mL/min., after which the flow direction is switched by a valve action so that all of the carrier solution and sample bands flow toward the mass spectrometer (the solid line in Figure 2a). During this “elution” step, the flow rate from the pump is set to 30 and 0.5 μL/min of carrier solution when analyte is introduced to the electrospray source. Migration of proteins to the end of the emitter tip takes <10 min and is dependent on both the geometry of the device and the inner volume of the capillary tubing.
Figure 2.
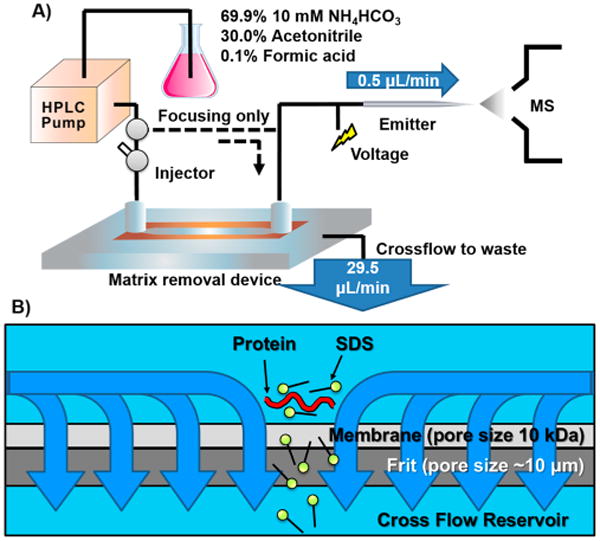
(A) Schematic diagram of an online coupled matrix removal device and ESI-MS. (B) Cross-section view at the side view during focusing step. A flow of carrier solution from the pump is delivered to both ports of the removal device. Therefore, analytes that are larger than the pore size of membrane form a narrow band at the center of removal device. If small molecules such as salts or detergents are included in the sample, they will be removed by a cross-flow that exits through the pores in membrane. Subsequently, the valve position is changed to elute proteins to the electrospray ionization source where purified proteins are analyzed.
SDS and Nonvolatile Salt Removal
Carbonic anhydrase was diluted into 50 mM DTT in 1% SDS GELFrEE sample buffer (ten times the SDS concentration of typical GELFrEE elution buffer) from the vendor. The sample was then injected into the removal device and subsequently eluted and directly analyzed via mass spectrometry. As shown in Figure 3, the intensity of SDS adduct peaks decreases as focusing time is increased from 1 to 5 min. Therefore, the removal of matrices, such as SDS and salts, is mainly achieved during a focusing step as described in Figure 2b. In this state, protein molecules are trapped in a narrow band within the channel, and any free molecules smaller than the pores in the membrane are washed through. Therefore, the principle mechanism of the removal process is based on filtration effected by the membrane, yielding results similar to a centrifugal filter such as an ultrafiltration membrane but performed in situ; however, because the driving force for this action is generated by a pump instead of centrifugal force, the system may be directly coupled to mass spectrometry. The mass spectra from carbonic anhydrase and various concentrations of SDS without the matrix removal device are shown in Supplementary Figure 1 in the SI for comparison with the data of Figure 3.
Figure 3.
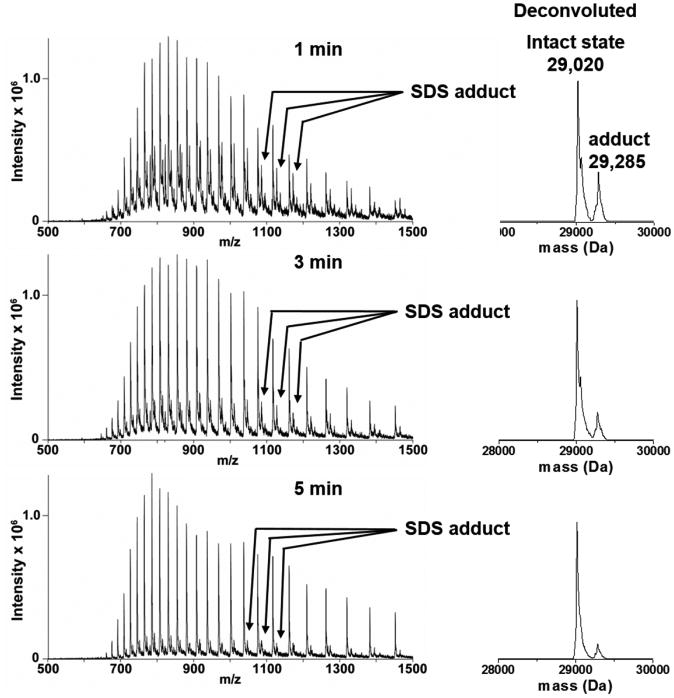
Efficiency of SDS removal as a function of focusing time. Each panel shows the spectrum resulting from 100 ng of carbonic anhydrase suspended in commercial GELFrEE loading buffer, following increasing focusing times. The spectrum with a 1 min focusing step shows significant SDS adduct peaks. After 5 min of focusing, the majority of the SDS adducts are removed. The spectra at right are deconvolution results from each spectrum, and the small satellite peaks show a difference of 265 Da (dodecyl sulfate ion) from SDS adduction.
The mass spectrum from 1 min of focusing time (top spectrum) shows a very strong SDS adduct species with an intensity almost half that of the intact protein. Moreover, minor peaks that represent the adduction of two or more SDS molecules to a single protein molecule are present. The peaks resulting from multiple-SDS adductions were mostly eliminated (middle spectrum in Figure 3), and adducts with a single SDS molecule were decreased to <10% of intact protein peaks after 3 min of focusing. Finally, the third panel of Figure 3 shows the SDS adduct peaks reduced to <10% of the intact protein signal, a level that enables further analysis such as fragmentation for MS2. When protein was purified using focusing times in excess of 5 min, neither the intensity of adduct peaks nor the ratio between adduct/intact protein was changed significantly, but the absolute intensity of the peak decreased with increasing focusing time. Consequently, focusing time was fixed to 5 min to minimize loss of protein.
While the injection amount utilized for Figure 3 was 100 ng (∼1.5 pmol) in 10 μL, there was no significant difference in the mass spectra as the concentration of analyte in the solution was altered (same injection volume, data not shown). This indicates that the length of the sample band is independent of the initial volume of sample concentration, similar to a stacking gel in SDS-PAGE, so proteins may be concentrated during the focusing step if their concentration is relatively low.
In practice, the maximum flow rate during focusing is limited by the backpressure of the device. For the design reported here, the maximum flow rate was ∼0.3 mL/min for proper operation and the backpressure measured at the pump was ∼8 bar (120 psi). Therefore, to achieve maximum solvent exchange, we set the flow rate to the maximum value during the focusing step, while a flow rate of 30 μL/min was used during elution to the mass spectrometer. As the maximum flow rate was fixed by pressure limitations, the focusing time was adjusted to change the net amount of solvent to which the sample was exposed. As expected, higher removal efficiency was observed with increasing focusing times by delayed switching of the flow direction; however, even though longer focusing times can remove more matrix, excessive focusing times can cause adsorptive loss of protein onto the membrane surface or protein aggregation caused by concentrations exceeding those necessary for solubility in a sample band.
In-Line Cleanup of GELFrEE Fractions Containing Standard Proteins
After optimization of the removal process, experiments were performed to demonstrate SDS removal from real GELFrEE fractions. Three protein standards (10 μg each of ubiquitin, myoglobin, and carbonic anhydrase) were mixed, reduced with DTT for GELFrEE, and fractionated in a 10% GELFrEE cartridge. The resulting fractions were visualized by loading 2 μL of each fraction onto an SDS-PAGE slab gel (Figure 4). After visualizing with silver stain, three intense bands were observed, corresponding to each of the three proteins.
Figure 4.
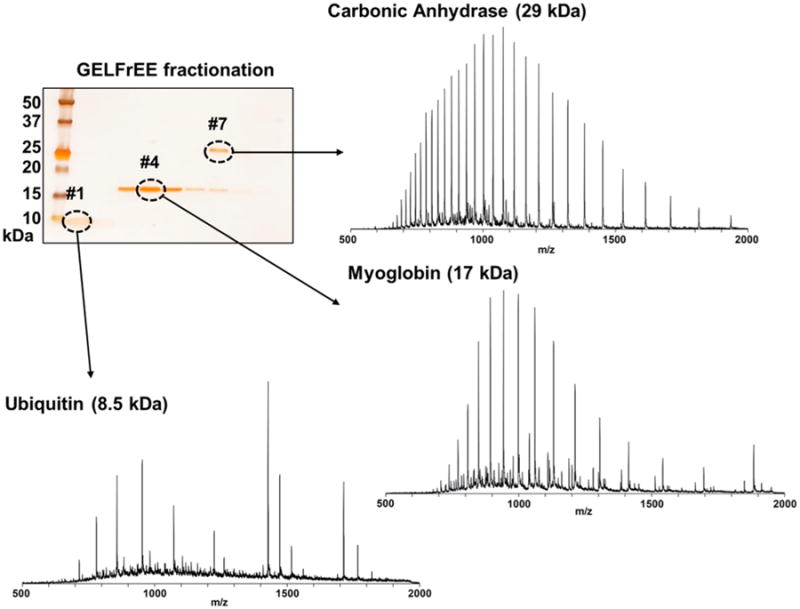
SDS-PAGE slab gel visualization of the GELFrEE fractionation of three standard proteins and the associated mass spectra following in-line cleanup. While small SDS adduct peaks are visible for ubiquitin and myoglobin, the spectrum of carbonic anhydrase shows no remaining adducts.
Subsequently, 5 μL of each protein-containing fraction was injected into the in-line matrix removal device and was directly eluted to the ESI source of the mass spectrometer. Each analysis required 10 min, including 5 min for the focusing step and another 5 min for protein elution and detection via the mass spectrometer. The resultant spectra from each GELFrEE fraction are depicted in Figure 4. Ubiquitin (8.5 kDa) is smaller than the molecular weight cutoff value (MWCO) of the membrane sheet (10 kDa) but was still partially retained and detected by mass spectrometry. Some adduct peaks were still observed with relatively high intensity above m/z 1400 (+5 or +6 charged ions) but only for ubiquitin. The fourth fraction produced a clean spectrum of myoglobin (17 kDa) without any detectable signal of adducts; however, there were some minor peaks present. These peaks are from superoxide dismutase, a 16 kDa protein that is a known contaminant of the carbonic anhydrase standard. Therefore, it is expected to coelute with myoglobin during a GELFrEE separation but was not detected in the SDS-PAGE slab gel because of its trace amount. Carbonic anhydrase (29 kDa) was observed in fraction #7 and also produced a clean spectrum with high S/N ratio. Furthermore, when compared with the previous result depicted in Figure 4 (with samples in 1% SDS), there are no detectable SDS adducts. The cleaner spectra are likely attributed to lower SDS concentration separation because only 0.1% SDS was used in the running buffer. These results demonstrate that the cleanup and direct mass spectrometric analysis of GELFrEE fractions with an in-line removal device is in fact feasible.
Comparison of Signal Intensity between Online Method and Precipitation Method after GELFrEE Fractionation
To evaluate the recovery of the removal device, we performed a comparison of peak area between the classical precipitation method and the in-line removal. Four protein standards were used, and their mixture was prepared in a loading buffer including 50 mM DTT and 1% SDS. Ten μg of each protein was loaded onto one lane of a 10% tris-acetate GELFrEE cartridge, yielding a separation result similar to that depicted in Figure 4. For the online removal method, 5 μL each protein-containing fraction was injected into the removal device and analyzed via mass spectrometry without any treatment. For purification by the classical method, 50 μL of each fraction was precipitated using MeOH/CHCl3.12 Each pellet was diluted again in 50 μL of sample buffer for LC–MS (5% acetonitrile and 0.1% formic acid in water). Five μL of each resuspended pellet was also injected into the removal device and analyzed via mass spectrometry. Therefore, both of samples were analyzed under the same conditions, with the exception of the cleanup method. All analyses were performed in triplicate (n = 3), and the top 5 peaks by abundance for each protein were used to generate extracted ion chromatograms whose peak areas were used to quantitate signal intensity. The sensitivity of mass spectrometry and its linearity in quantitative analysis are shown in Supplementary Figure 2 in the SI.
The quantitative analysis for signal intensity was carried out by comparing the peak area from extracted ion chromatograms, which were generated from the top 5 peaks by intensity for each species. Figure 5 and Supplementary Table 1 in the SI show the result from the comparison of signal intensity from each fraction. The peak area of GELFrEE fractions purified by the in-line method was set to 100% because the in-line removal method always gave higher signal intensity than the precipitation method and measured peak areas were very different for each protein. Carbonic anhydrase showed the largest difference, suffering an almost 10-fold reduction in signal when using the precipitation method. In the case of ubiquitin, myoglobin, and transferrin, the in-line method showed 2 to 6 times higher signal intensities. The difference in apparent recovery is highly dependent on the protein, and there are no obvious trends in molecular weight or pI value from this limited sample set.
Figure 5.
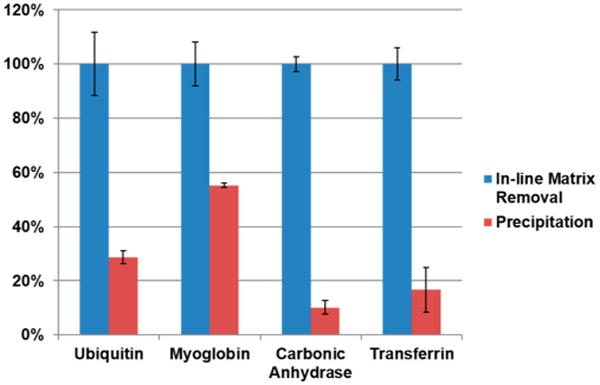
Graph of relative peak areas of protein standards following precipitation/resuspension versus the in-line removal platform. Carbonic anhydrase showed the lowest signal intensity following the precipitation method, yielding only 10% of the signal achieved with the in-line removal platform. The other proteins also showed low signal intensity (15–55%) after the precipitation/resuspension step that appears to be protein-dependent.
Identification of Histones from GELFrEE Fractions Using in-Line Removal Device
To evaluate the suitability of this platform for the analysis of protein mixtures derived from biological samples, like GELFrEE fractions produced from a separation of cell lysate, we fractionated an acid extract of nuclei from HeLa S3 cells with GELFrEE, generating a sample set with relatively low complexity (i.e., less than a few hundred proteins).32 The simplicity of these samples along with prior works33–36 enabled the identification and characterization of the modified proteins within them without further separation. Again, the GELFrEE was visualized with an SDS-PAGE slab gel followed by silver staining (Figure 6).
Figure 6.
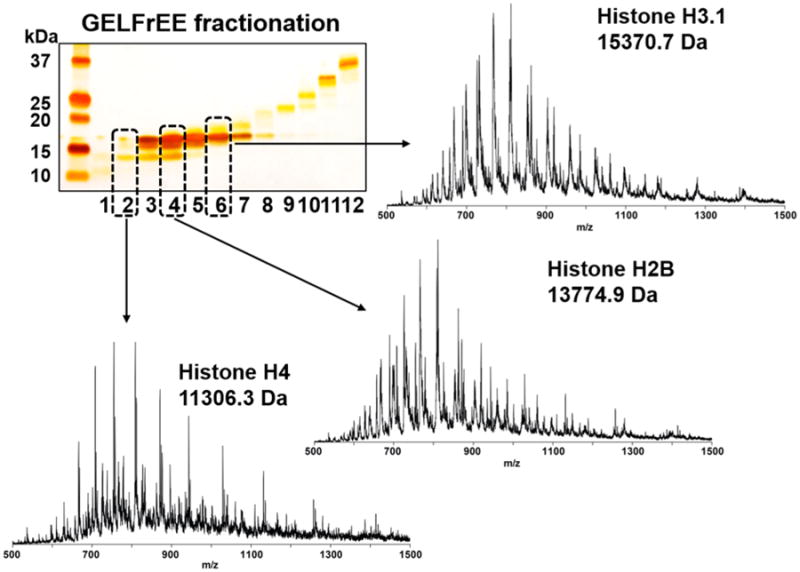
SDS-PAGE slab gel visualization of the GELFrEE fractionation of an acid extract derived from HeLa S3 cells. Three strong bands were observed, corresponding to the members of the histone family (H4, H3, and H2B). Each fraction was treated with in-line detergent removal, generating the three ion trap mass spectra shown (R = 1000). The dominant species in each mass spectrum was the core histone expected by molecular weight. The minor peaks at each spectrum were from other core histones and proteins in the mixture and not SDS adduction.
For analysis with mass spectrometry, only 5 μL of 150 μL in each fraction was injected into the removal device, washed in situ, and introduced to ESI mass spectrometry as previously described. Representative MS1 spectra from fractions #2, 4, and 6 are depicted in Figure 6. All proteins were identified from MS2 spectra using ProSightPC 3.0 (data not shown). In the MS1 spectrum from each fraction, there is some overlap of two or more histone proteins, but the most abundant peaks from each spectrum show strong agreement with the slab gel image.
To demonstrate feasibility of the removal device in common workflows, fraction #7 was analyzed by a Q Exactive HF Orbitrap mass spectrometer, and the resultant spectrum is described in Figure 7. All four core histones were identified by accurate intact mass (<10 ppm), as described in Supplementary Table 2 in the SI. Despite the presence of many histone proteoforms, each was isotopically resolved, which enabled direct determination of molecular weight without deconvolution. Each subunit showed multiple adjacent peaks corresponding to proteoforms consisting of methylation and acetylation of various histones, whereas no SDS or salt adducts were observable. This experiment is the first attempt to analyze histone subunits without any chromatographic separation in top-down proteomics research, and it indicates that the in-line removal device is well-suited to the purification of proteins from a matrix including SDS for direct analysis by electrospray mass spectrometry.
Figure 7.
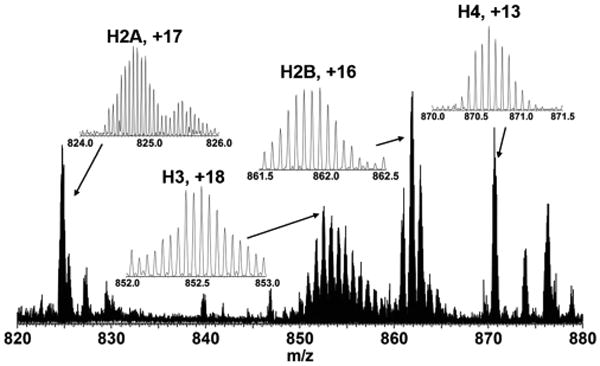
Portion of the mass spectrum obtained from a histone fraction from GELFrEE following in-line detergent removal acquired with Q Exactive HF instrument (R = 64 000; 50 scans coadded). The insets show the resolved isotopic distributions for each of the four core histones. The adjacent isotopic clusters in a same group (e.g., 850–860 m/z for histone H3) are proteoforms corresponding to differential acetylation and methylation. In the case of H2A and H2B, the adjacent proteoforms are due to different members of these gene families.31 No evidence of SDS adduction could be observed in these data.
Conclusions
This study demonstrates the potential and performance of matrix removal and direct analysis with ESI mass spectrometry by a new in-line removal device. The device is capable of removing surfactants and salts with minimal protein loss by filtration effected by a cross-flow of carrier solution delivered by a pump through a membrane sheet and porous frit. It was demonstrated that an effective removal of high concentrations of SDS, even above the critical micelle concentration, was achieved by a continuous replenishment of carrier solution during a sample focusing step. Moreover, the focusing step, which traps proteins in the middle of inner volume of the device, enabled the concentration of proteins diluted in buffer solution. The performance of the removal device was evaluated with protein fractions from a GELFrEE system. Fractions of standard proteins in running buffer including SDS and HEPES were purified and analyzed by ESI mass spectrometry without any additional cleanup or treatment. The further application to a practical biological sample was performed with histones extracted from HeLa cells, and the result showed both the molecular mass sorting by GELFrEE and clean spectra of each histone subunits without significant interference from SDS or nonvolatile salt adducts. Finally, the comparison of signal intensity between the new removal device and a precipitation method showed a 2 to 10 times higher signal intensities when the removal device was utilized. Ultimately, this work suggests that a high-resolution separation that is reliant on salts or detergents may be directly coupled to mass spectrometry, yielding a dramatically simplified front-end solution for top-down proteomics.
Supplementary Material
Supplementary Table 1: The relative ratio of peak area for comparison between precipitation and the removal platform. Supplementary Table 2: The mass accuracy of each histone subunit identified from high-resolution tandem mass spectrometry. Supplementary Figure 1: The mass spectra of carbonic anhydrase in the solution containing various concentrations of SDS. Supplementary Figure 2: The calibration curve of transferrin standard from the removal device and a total ion chromatogram and selected mass spectrum at the center of peak. This material is available free of charge via the Internet at http://pubs.acs.org.
Acknowledgments
This work was supported by the National Institute of General Medical Sciences of the National Institutes of Health under award number R01 GM067193 (Neil L. Kelleher). Additional support was provided by the UIUC Center for Neuroproteomics on Cell to Cell Signaling (P30 DA018310) and the Robert H. Lurie Comprehensive Cancer Center. N.L.K. and P.D.C. acknowledge the W.M. Keck Foundation for their support.
Footnotes
Notes: The authors declare no competing financial interest.
References
- 1.Kelleher NL. Top-down proteomics. Anal Chem. 2004;76(11):196A–203A. [PubMed] [Google Scholar]
- 2.Chait BT. Mass spectrometry: Bottom-up or top-down? Science. 2006;314(5796):65–66. doi: 10.1126/science.1133987. [DOI] [PubMed] [Google Scholar]
- 3.Tran JC, Zamdborg L, Ahlf DR, Lee JE, Catherman AD, Durbin KR, Tipton JD, Vellaichamy A, Kellie JF, Li M, Wu C, Sweet SMM, Early BP, Siuti N, Leduc RD, Compton PD, Thomas PM, Kelleher NL. Mapping intact protein isoforms in discovery mode using top-down proteomics. Nature. 2011;480(7376):254–258. doi: 10.1038/nature10575. [DOI] [PMC free article] [PubMed] [Google Scholar]
- 4.Anderson NL, Anderson NG. The human plasma proteome: history, character, and diagnostic prospects. Mol Cell Proteomics. 2002;1(11):845–867. doi: 10.1074/mcp.r200007-mcp200. [DOI] [PubMed] [Google Scholar]
- 5.Doucette AA, Tran JC, Wall MJ, Fitzsimmons S. Intact proteome fractionation strategies compatible with mass spectrometry. Expert Rev Proteomics. 2011;8(6):787–800. doi: 10.1586/epr.11.67. [DOI] [PubMed] [Google Scholar]
- 6.Tian Z, Zhao R, Tolić N, Moore RJ, Stenoien DL, Robinson EW, Smith RD, Pasǎ-Tolić L. Two-dimensional liquid chromatography system for online top-down mass spectrometry. Proteomics. 2010;10(20):3610–3620. doi: 10.1002/pmic.201000367. [DOI] [PMC free article] [PubMed] [Google Scholar]
- 7.Nemeth-Cawley JF, Tangarone BS, Rouse JC. “Top Down” Characterization Is a Complementary Technique to Peptide Sequencing for Identifying Protein Species in Complex Mixtures. J Proteome Res. 2003;2(5):495–505. doi: 10.1021/pr034008u. [DOI] [PubMed] [Google Scholar]
- 8.Zhang J, Roth MJ, Chang AN, Plymire DA, Corbett JR, Greenberg BM, Patrie SM. Top-down mass spectrometry on tissue extracts and biofluids with isoelectric focusing and superficially porous silica liquid chromatography. Anal Chem. 2013;85(21):10377–10384. doi: 10.1021/ac402394w. [DOI] [PubMed] [Google Scholar]
- 9.Tran JC, Doucette AA. Gel-eluted liquid fraction entrapment electrophoresis: An electrophoretic method for broad molecular weight range proteome separation. Anal Chem. 2008;80(5):1568–1573. doi: 10.1021/ac702197w. [DOI] [PubMed] [Google Scholar]
- 10.Lee JE, Kellie JF, Tran JC, Tipton JD, Catherman AD, Thomas HM, Ahlf DR, Durbin KR, Vellaichamy A, Ntai I, Marshall AG, Kelleher NL. A Robust Two-Dimensional Separation for Top-Down Tandem Mass Spectrometry of the Low-Mass Proteome. J Am Soc Mass Spectrom. 2009;20(12):2183–2191. doi: 10.1016/j.jasms.2009.08.001. [DOI] [PMC free article] [PubMed] [Google Scholar]
- 11.Tran JC, Doucette AA. Multiplexed size separation of intact proteins in solution phase for mass spectrometry. Anal Chem. 2009;81(15):6201–6209. doi: 10.1021/ac900729r. [DOI] [PubMed] [Google Scholar]
- 12.Wessel D, Flugge UI. A method for the quantitative recovery of protein in dilute solution in the presence of detergents and lipids. Anal Biochem. 1984;138(1):141–143. doi: 10.1016/0003-2697(84)90782-6. [DOI] [PubMed] [Google Scholar]
- 13.Orton DJ, Doucette AA. A universal, high recovery assay for protein quantitation through temperature programmed liquid chromatography (TPLC) J Chromaogr, B. 2013:921–922. 75–80. doi: 10.1016/j.jchromb.2013.01.021. [DOI] [PubMed] [Google Scholar]
- 14.Doucette AA, Vieira DB, Orton DJ, Wall MJ. Resolubilization of precipitated intact membrane proteins with cold formic acid for analysis by mass spectrometry. J Proteome Res. 2014;13(12):6001–6012. doi: 10.1021/pr500864a. [DOI] [PubMed] [Google Scholar]
- 15.Crowell AMJ, MacLellan DL, Doucette AA. A two-stage spin cartridge for integrated protein precipitation, digestion and SDS removal in a comparative bottom-up proteomics workflow. J Proteomics. doi: 10.1016/j.jprot.2014.09.030. in press. [DOI] [PubMed] [Google Scholar]
- 16.Hengel SM, Floyd E, Baker ES, Zhao R, Wu S, Paša-Tolić L. Evaluation of SDS depletion using an affinity spin column and IMS-MS detection. Proteomics. 2012;12(21):3138–3142. doi: 10.1002/pmic.201200168. [DOI] [PMC free article] [PubMed] [Google Scholar]
- 17.Mandal MK, Chen LC, Yu Z, Nonami H, Erra-Balsells R, Hiraoka K. Detection of protein from detergent solutions by probe electrospray ionization mass spectrometry (PESI-MS) J Mass Spectrom. 2011;46(10):967–975. doi: 10.1002/jms.1977. [DOI] [PubMed] [Google Scholar]
- 18.Shieh IF, Lee CY, Shiea J. Eliminating the interferences from TRIS buffer and SDS in protein analysis by fused-droplet electrospray ionization mass spectrometry. J Proteome Res. 2005;4(2):606–612. doi: 10.1021/pr049765m. [DOI] [PubMed] [Google Scholar]
- 19.Sharma R, Dill BD, Chourey K, Shah M, Verberkmoes NC, Hettich RL. Coupling a detergent lysis/cleanup methodology with intact protein fractionation for enhanced proteome characterization. J Proteome Res. 2012;11(12):6008–6018. doi: 10.1021/pr300709k. [DOI] [PubMed] [Google Scholar]
- 20.Vissers JPC, Chervet JP, Salzmann JP. Sodium dodecyl sulphate removal from tryptic digest samples for on-line capillary liquid chromatography/electrospray mass spectrometry. J Mass Spectrom. 1996;31(9):1021–1027. doi: 10.1002/(SICI)1096-9888(199609)31:9<1021::AID-JMS384>3.0.CO;2-G. [DOI] [PubMed] [Google Scholar]
- 21.Giddings JC. Field-flow fractionation: Analysis of macromolecular, colloidal, and particulate materials. Science. 1993;260(5113):1456–1465. doi: 10.1126/science.8502990. [DOI] [PubMed] [Google Scholar]
- 22.Roda B, Zattoni A, Reschiglian P, Moon MH, Mirasoli M, Michelini E, Roda A. Field-flow fractionation in bioanalysis: A review of recent trends. Anal Chim Acta. 2009;635(2):132–143. doi: 10.1016/j.aca.2009.01.015. [DOI] [PubMed] [Google Scholar]
- 23.Pasch H, Makan AC, Chirowodza H, Ngaza N, Hiller W. Analysis of complex polymers by multidetector field-flow fractionation Field-Flow Fractionation. Anal Bioanal Chem. 2014;406(6):1585–1596. doi: 10.1007/s00216-013-7308-0. [DOI] [PubMed] [Google Scholar]
- 24.Reschiglian P, Moon MH. Flow field-flow fractionation: A pre-analytical method for proteomics. J Proteomics. 2008;71(3):265–276. doi: 10.1016/j.jprot.2008.06.002. [DOI] [PubMed] [Google Scholar]
- 25.Kim KH, Moon MH. Chip-Type Asymmetrical Flow Field-Flow Fractionation Channel Coupled with Mass Spectrometry for Top-Down Protein Identification. Anal Chem. 2011;83(22):8652–8658. doi: 10.1021/ac202098b. [DOI] [PubMed] [Google Scholar]
- 26.Kang D, Moon MH. Development of non-gel-based two-dimensional separation of intact proteins by an on-line hyphenation of capillary isoelectric focusing and hollow fiber flow field-flow fractionation. Anal Chem. 2006;78(16):5789–5798. doi: 10.1021/ac0606958. [DOI] [PubMed] [Google Scholar]
- 27.Phuntsho S, Shon HK, Vigneswaran S, Cho J. Assessing membrane fouling potential of humic acid using flow field-flow fractionation. J Membr Sci. 2011;373(1-2):64–73. [Google Scholar]
- 28.Dubascoux S, Le Hécho I, Hassellóv M, Von Der Kammer F, Potin Gautier M, Lespes G. Field-flow fractionation and inductively coupled plasma mass spectrometer coupling: History, development and applications. J Anal At Spectrom. 2010;25(5):613–623. [Google Scholar]
- 29.Van Reis R, Gadam S, Frautschy LN, Orlando S, Goodrich EM, Saksena S, Kuriyel R, Simpson CM, Pearl S, Zydney AL. High performance tangential flow filtration. Biotechnol Bioeng. 1997;56(1):71–82. doi: 10.1002/(SICI)1097-0290(19971005)56:1<71::AID-BIT8>3.0.CO;2-S. [DOI] [PubMed] [Google Scholar]
- 30.Fischer I, Franzreb M. Removal of the nonionic surfactant Eumulgin ES from protein solutions by means of adsorption and ultrafiltration. Sep Purif Technol. 2013;118:217–225. [Google Scholar]
- 31.Al-Ammar A, Siripinyanond A, Barnes RM. Simultaneous sample preconcentration and matrix removal using field-flow fractionation coupled to inductively coupled plasma mass spectrometry. Spectrochim Acta, Part B. 2001;56(10):1951–1962. [Google Scholar]
- 32.Garcia BA, Pesavento JJ, Mizzen CA, Kelleher NL. Pervasive combinatorial modification of histone H3 in human cells. Nat Methods. 2007;4(6):487–489. doi: 10.1038/nmeth1052. [DOI] [PubMed] [Google Scholar]
- 33.Boyne MT, II, Pesavento JJ, Mizzen CA, Kelleher NL. Precise characterization of human histones in the H2A gene family by top down mass spectrometry. J Proteome Res. 2006;5(2):248–253. doi: 10.1021/pr050269n. [DOI] [PubMed] [Google Scholar]
- 34.Siuti N, Roth MJ, Mizzen CA, Kelleher NL, Pesavento JJ. Gene-specific characterization of human histone H2B by electron capture dissociation. J Proteome Res. 2006;5(2):233–239. doi: 10.1021/pr050268v. [DOI] [PubMed] [Google Scholar]
- 35.Garcia BA, Thomas CE, Kelleher NL, Mizzen CA. Tissue-specific expression and post-translational modification of histone H3 variants. J Proteome Res. 2008;7(10):4225–4236. doi: 10.1021/pr800044q. [DOI] [PMC free article] [PubMed] [Google Scholar]
- 36.Pesavento JJ, Yang H, Kelleher NL, Mizzen CA. Certain and progressive methylation of histone H4 at lysine 20 during the cell cycle. Mol Cell Biol. 2008;28(1):468–486. doi: 10.1128/MCB.01517-07. [DOI] [PMC free article] [PubMed] [Google Scholar]
Associated Data
This section collects any data citations, data availability statements, or supplementary materials included in this article.
Supplementary Materials
Supplementary Table 1: The relative ratio of peak area for comparison between precipitation and the removal platform. Supplementary Table 2: The mass accuracy of each histone subunit identified from high-resolution tandem mass spectrometry. Supplementary Figure 1: The mass spectra of carbonic anhydrase in the solution containing various concentrations of SDS. Supplementary Figure 2: The calibration curve of transferrin standard from the removal device and a total ion chromatogram and selected mass spectrum at the center of peak. This material is available free of charge via the Internet at http://pubs.acs.org.


