Abstract
Research collaboration plays an important role in scientific productivity and academic innovation. Multi-institutional collaboration has become a vital approach for integrating multidisciplinary resources and expertise to enhance biomedical research. There is an increasing need for analyzing the effect of multi-institutional research collaboration. In this paper, we present a collaboration analysis pipeline based on research networks constructed from publication co-authorship relationship. Such research networks can be effectively used to render and analyze large-scale institutional collaboration. The co-authorship networks of the Cleveland Clinical and Translational Science Collaborative (CTSC) were visualized and analyzed. SciVal Expert™ was used to extract publication data of the CTSC members. The network was presented in informative and aesthetically appealing diagrams using the open source visualization package Gephi. The analytic result demonstrates the effectiveness of our approach, and it also indicates the substantial growth of research collaboration among the CTSC members crossing its partner institutions.
1. Introduction
Multi-institutional collaboration enhances the productivity and innovation of scientific research. Collaboration has been quickly changing the organization structure and research strategy of the biomedical research community1–3. Research collaboration network is a special type of social network within scientific communities. There has been a growing interest in analyzing the characteristics of collaboration network among research institutions. This creates an increasing need to evaluate the collaboration quality using network analysis methods4. Understanding the collaborative relationships among researchers and their affiliated institutions can help identify important network-based resources, such as leading members, rising personal, and strategic research clusters. Furthermore, collaboration network analysis can support the assessment and evaluation of research activity and productivity.
In biomedical science, organizations and leaders are also increasingly aware of the import roles of collaboration. Hence, developing efficient methods to objectively evaluate research collaboration becomes an important topic5. There have been many initiatives to develop new methods and theories for social network analysis (SNA)6–9. However, little work has been done to implement an efficient method for analyzing multi-institutional research collaboration network. In this paper we share our experience in developing a pipeline for research collaboration analysis10, which not only provides quantitative measurement for decision-making, but also enables intuitive visualization of the key collaboration characteristics. The proposed framework uses co-authorship on scientific publications to generate a research network for collaboration analysis. The method is applied to analyzing the research collaboration of the Cleveland Clinical and Translational Science Collaborative (CTSC). The CTSC is among the early consortiums receiving NIH funding for the CTSA award2. The CTSC has been actively building collaborative infrastructure to support clinical and translational research for the five affiliated institutions, including Case Western School of Medicine (Case), Cleveland Clinic Foundation (CCF), University Hospital (UH), Metro Health, and Louis Stroke VA Medical Center.
In the next section, we describe the proposed method for transforming research publications to structured data sets for network analysis, followed by Results, Analysis and Discussions.
2. Method
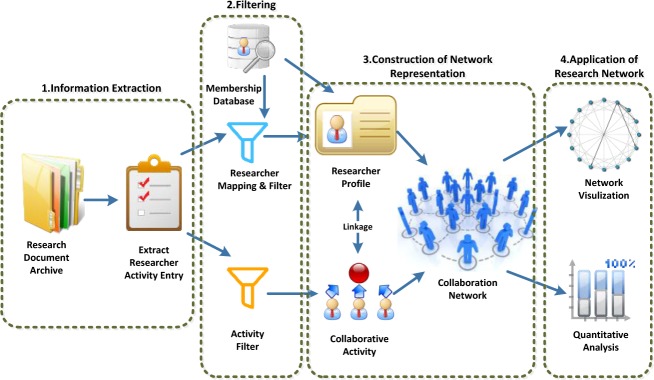
The overall components and steps of the framework are illustrated in Figure 1. Our pipeline consists of four stages of information processing. The first stage “Information Extraction” (Figure 1) focuses on identifying relevant research documents and extracting author activities. A variety of documents can be used for research network analysis. Each type represents a specific aspect of collaborative activity. For example, multi-PI grant proposals indicate the sharing of complementary expertise and skills; clinical trial protocols show the collaboration on research project management; and publications reveal the co-authorship and imply the share of research responsibility and outcome. In this paper, we demonstrate the construction of a social network from the co-authorship data based on scientific publications. We extract co-authorship data from affiliated research publications. Publication datasets are typically inexpensive and widely available to almost all research institutions, hence they are selected for this study.
Figure 1:

Systematic Research Network Generation
The second stage is “Mapping and Filtering,” which focuses on preparing the extracted data for analysis. The documents retrieved from the first step normally contain information that is not relevant to network analysis. For example, non-affiliated researchers need to be filtered out. The best practice is to align the extracted researcher names with a membership database. In the alignment process, the names of the researchers will be disambiguated and mapped to their corresponding profile in the membership database, such as department, specialty. If a formal membership database does not exist, the process of disambiguation and profile alignment could be more challenging. Several prior studies proposed alternative methods for research profile alignment11,12. Another common filter is to limit the range of activities by specifying the year of publications or selecting a specific type of journals.
In the third stage, the social network is constructed and stored in a computable format. The previous filtering process results in two distinct types of data: the research profiles represent the entities of the research network, and the activity records (publications in our case) represent the relationships among the entities. Hence, it is essential to maintain the reference linkage of these two data sets during network construction. A researcher profile is represented as a “node” entity in the research network, while an activity record is transformed as one or more “edges” connecting the nodes. Two dataset tables are constructed and maintained for the nodes and edges respectively. A research collaboration network is then constructed by connecting the nodes (researchers) with their corresponding edges (collaboration activities). The constructed collaboration network can be used for quantitative analysis or rendered through visualization packages in the last step.
CTSC Research Network Construction
The publication data were extracted from SciVal Expert™13. An XML parser was developed to extract the author information from the publication list. Since we focused on research collaboration among CTSC members in this study, non-CTSC members were filtered out by matching the author names to the CTSC membership database. CTSC researchers were represented as network graph nodes with their profiles assigned. Using the co-authorship list of the publications, we generated a pairwise coauthor list, which were used as edges to connect the nodes. To illustrate the interactions among research institutions, nodes (researchers) were colored by the affiliated institutions (CCF, Case Medical School, UH, MetroHealth, and VA center). The rendering of such multi-dimensional information in a compact and intuitive way is a challenge. We address this challenge using the force-directed graph algorithm and the open-source visualization package called Gephi14. The nodes are clustered by the Fruchterman Reingold algorithm15 to show the members’ connectivity power and similarity.
3. Results and Analysis
Research Network Visualization
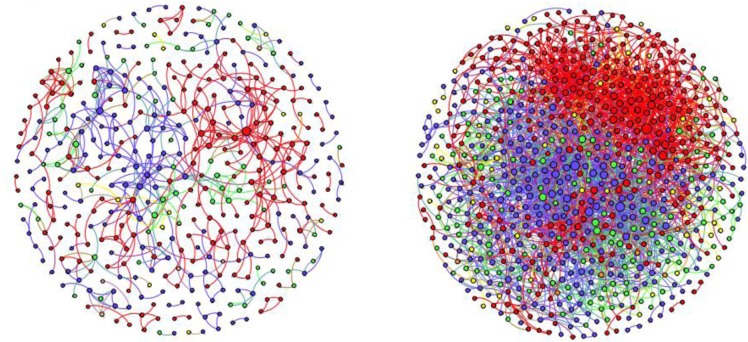
Figure 2 (right) shows the research collaboration network of the CTSC based on 63,533 publications drawn from the SciVal database accumulated from 2008 to 2012. Figure 2 (left) shows the collaboration of 2008, which was the first year the CTSC was funded. Each node in the diagram represents a CTSC member. The names of the researchers are removed in this paper for privacy reason. The color of a node represents the institution to which the member belongs. The size of a node shows the logarithmical connection degree. The larger the size, the more connections a member has. Connections are shown by the colored lines between nodes, with the color being assigned as that of the first author’s affiliation. On the right, a network based on cumulative publications from year 2008 to 2012, shows that Cleveland Clinic (Red, 39%) and Case Medical School (Blue, 35%) represent the majority of the collaborative activities. University hospital (Green, 18%) also has a fair amount of collaborative members. MetroHealth Medical Center (Yellow, 6.18%) and the Louis Stokes Cleveland VA Medical Center (Brown, 0.94%) represent about 7 percent of the members. Comparing to the diagram on the left, the density of the nodes and edges has increased significantly, indicating substantial growth of collaboration among CTSC members across the partner institutions. Two independent evaluators examined the networks and confirmed the precision and the representativeness of the visual network. Note that some members solely collaborated within their own institutions, while others served as hubs that reached out to other research programs. Leaders of the institutions can be identified in the diagram by observing their strategic position in the diagram. The network also reveals researchers who were collaborative due to the possession of widely used services and technologies, such as Biostatistics.
Figure 2:
Left - collaboration network of the first year 2008; Right - collaboration network of 2008–2012
Figure 3 shows the cross-institutional collaboration during the years 2008, 2010 and 2012 respectively from left to right. The big circles delineate the five CTSC affiliated institutions. The color of the edges in Figure 3 is rendered with the combined colors of the two relevant institutions to help distinguish cross-institutional collaboration. For example, the edges between CWRU and CCF are in purple (a combination of blue and red), while the edges between CWRU and UH are in cyan (a combination of blue and green). The yearly network diagrams indicate that there has been a continuous growth of collaboration among the CTSC institutions.
Figure 3:

Growth of cross-institutional collaboration
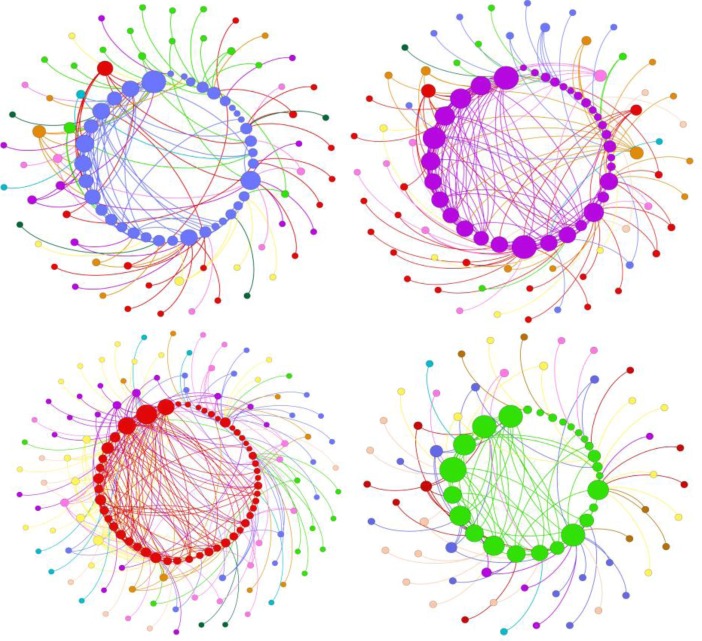
Figure 4 shows the collaboration networks of individual scientific programs. The members of a program are shown in a circle. The color of the nodes in this figure represents the research program. Program members are sorted by their degree of intra-program co-authorships. The sorted sequence is arranged counter clockwise starting from 12 o’clock. Related inter-program connections are shown outside the main program circle.
Figure 4:
Network of individual scientific programs
Quantitative Analysis of Research Collaboration
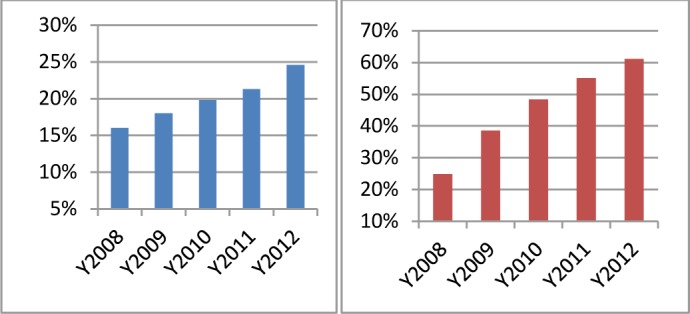
To further quantify the growth of the CTSC research network across institutions, we analyzed the yearly percentage of cross-institutional collaborative publications and researchers. Table 1 shows the percentage of cross-institutional publications which were co-authored by researchers from two or more CTSC institutions. The publications are visualized as edges connecting the institutions in Figure 3. Cross-institution publications increased steadily at a 2%–3% rate each year from 2008 to 2012. In total, the collaborative publications increased 8.6%. Figure 5 (Left) shows the growth rate each year. Table 2 shows researchers who collaboratively published papers with other researchers from a different CTSC institution. The cross-institutional collaborative researchers are visualized as nodes in Figure 3. The result shows that the growth of collaborative researchers in CTSC was significant, from 24.9% to 61.1%. Figure 5 (Right) shows the total growth of researchers with collaborative publications. The results suggest that the CTSC is facilitating and promoting substantive research interactions among researchers from the affiliated institutions.
Table 1:
Percentage of the cross-institution publications
| Year: | 2008 | 2009 | 2010 | 2011 | 2012 |
|---|---|---|---|---|---|
| Cross-institution Publication | 466 | 523 | 599 | 649 | 638 |
| Total Publication | 2909 | 2997 | 3019 | 3052 | 2589 |
| Percent/Year | 16.0% | 18.0% | 19.8% | 21.3% | 24.6% |
Figure 5:

Left - Growth of cross-institutional publications; Right - Researchers collaborated to publish papers
Table 2:
Researchers with cross-institutional publications
| Year: | 2008 | 2009 | 2010 | 2011 | 2012 |
|---|---|---|---|---|---|
| Collaborative Researchers | 177 | 306 | 399 | 461 | 515 |
| Total Researcher | 711 | 792 | 825 | 836 | 843 |
| Percent/Year | 24.9% | 38.6% | 48.4% | 55.1% | 61.1% |
4. Discussion
Many studies have discovered that a high level of research collaboration positively correlates with the quality and quantity of research outcomes16–18. An important strategic goal of the CTSA is to bridge the gap of biomedical research institutions, reduce barriers of communication3, and increase the efficiency of collaboration between basic science researcher, clinical scientist and practicing physician. Hence, research collaboration is a key indicator for assessing the performance of a CTSA institution. In this CTSC case study, the network analysis results show a clear increasing trend of collaboration among the affiliated researchers. The overall quantity of the published paper also increased except for 2012. This may due to the lag of currency of information provided by SciVal Expert™.
Our network analysis pipeline provides an efficient method for evaluating cross-institutional collaborations. A bibliometric-based approached was used to extract co-authorship information for evaluating the collaboration. Although research publication co-authorship may not provide a comprehensive view of the collaboration process, it is still considered an effective and valuable information source for network analysis because of its advantages in availability and its faithful indication in research contribution19–21. In the biomedical research community, there are several ongoing efforts to build research networking tools and expert models to enable expertise discovery and research collaboration, such as Direct2Experts4, CTSAconnect22 and VIVO23. These platforms could provide additional data sources (e.g. facility usage record, clinical trials information) for network analysis. Our method complements these initiatives to provide an effective and self-contained pipeline to visualize and analyze the growth of multi-intuitional research collaboration.
Limitation
First, in this study we focused on analyzing the growth of research collaboration of the CTSC using the extracted publication data. Although many researchers may have external collaboration, the analysis was limited within the five CTSC affiliated institutions. To expand the analysis, we are expanding the data collection to other CTSA consortiums and planning to perform a large-scale network analysis for the CTSA collaboration. Second, social network analysis methods can be applied to measure other aspects of collaboration, such as individual researcher impact, connection diversity, and clustering degree. In the limited scope of this paper, we shared our results on developing an effective pipeline that transforms publication data into a suitable form for analyze the growth of research collaboration. The application scenario is highly desirable to many research institutions24. Hence, we believe our work provides an implementation blueprint and offers insights into the workflow of research collaboration analysis. In future work, we will expand the framework to provide more modules to assess the quality of research collaboration, such as analyzing the correlation between collaboration network and research output.
Conclusion
In this paper, we presented a streamlined pipeline for constructing research networks for collaboration analysis. Our pipeline is shown to be effective in supporting multi-institutional research network visualization and analysis. The approach enabled us to perform an objective evaluation to the research collaboration among the CTSC members using SciVal Expert™ data of 2008 to 2012. The results indicate that the collaboration has grown substantially since the inception of the CTSC. Not only the number of scientific publications shows substantial growth, the collaboration across the five partner institutions of the CTSC has increased.
Acknowledgments
We thank Mr. David Pilasky for providing the exported SciVal Expert™ data for this study.
This publication was made possible by the Clinical and Translational Science Collaborative of Cleveland, UL1TR000439 from the National Center for Advancing Translational Sciences (NCATS) component of the National Institutes of Health and NIH roadmap for Medical Research. Its contents are solely the responsibility of the authors and do not necessarily represent the official views of the NIH.
References
- 1.Zerhouni EA. Clinical research at a crossroads: the NIH roadmap. Journal of investigative medicine. 2006;54(4):171–173. doi: 10.2310/6650.2006.X0016. [DOI] [PubMed] [Google Scholar]
- 2.Zerhouni EA. Translational and clinical science—time for a new vision. New England Journal of Medicine. 2005;353(15):1621–1623. doi: 10.1056/NEJMsb053723. [DOI] [PubMed] [Google Scholar]
- 3.Woolf SH. The meaning of translational research and why it matters. JAMA. 2008;299(2):211–213. doi: 10.1001/jama.2007.26. [DOI] [PubMed] [Google Scholar]
- 4.Weber GM, Barnett W, Conlon M, et al. Direct2Experts: a pilot national network to demonstrate interoperability among research-networking platforms. Journal of the American Medical Informatics Association. 2011 Oct 28; doi: 10.1136/amiajnl-2011-000200. [DOI] [PMC free article] [PubMed] [Google Scholar]
- 5.Greene SM, Hart G, Wagner EH. Measuring and Improving Performance in Multicenter Research Consortia. JNCI Monographs. 2005 Nov 1;(35):26–32. doi: 10.1093/jncimonographs/lgi034. [DOI] [PubMed] [Google Scholar]
- 6.Scott J, Carrington PJ. The SAGE handbook of social network analysis. SAGE publications; 2011. [Google Scholar]
- 7.Merrill J, Hripcsak G. Using Social Network Analysis within a Department of Biomedical Informatics to Induce a Discussion of Academic Communities of Practice. Journal of the American Medical Informatics Association. 2008 Nov 1;15(6):780–782. doi: 10.1197/jamia.M2717. [DOI] [PMC free article] [PubMed] [Google Scholar]
- 8.Park HW. Hyperlink network analysis: A new method for the study of social structure on the web. Connections. 2003;25(1):49–61. [Google Scholar]
- 9.Ellison NB, Steinfield C, Lampe C. The benefits of Facebook “friends:” Social capital and college students’ use of online social network sites. Journal of Computer-Mediated Communication. 2007;12(4):1143–1168. [Google Scholar]
- 10.Luo Z, Sahoo SS, Zhang GQ. A. CTSA Informatics Key Function Committee meeting. Chicago: 2012. Pipeline for Rendering and Analyzing Large Institutional Research Networks; p. 44. [Google Scholar]
- 11.Han H, Giles L, Zha H, Li C, Tsioutsiouliklis K. Two supervised learning approaches for name disambiguation in author citations; Paper presented at: Digital Libraries, 2004. Proceedings of the 2004 Joint ACM/IEEE Conference. [Google Scholar]
- 12.Malin B. Unsupervised name disambiguation via social network similarity; Paper presented at: Workshop on link analysis, counterterrorism, and security; 2005. [Google Scholar]
- 13.Vardell E, Feddern-Bekcan T, Moore M. SciVal Experts: A Collaborative Tool. Medical reference services quarterly. 2011;30(3):283–294. doi: 10.1080/02763869.2011.603592. [DOI] [PubMed] [Google Scholar]
- 14.Bastian M, Heymann S, Jacomy M. Gephi: an open source software for exploring and manipulating networks; Paper presented at: ICWSM; 2009. [Google Scholar]
- 15.Fruchterman TM, Reingold EM. Graph drawing by force-directed placement. Software: Practice and experience. 1991;21(11):1129–1164. [Google Scholar]
- 16.Katz JS, Martin BR. What is research collaboration? Research Policy. 1997;26(1):1–18. [Google Scholar]
- 17.Okubo Y, Sjöberg C. The changing pattern of industrial scientific research collaboration in Sweden. Research Policy. 2000;29(1):81–98. [Google Scholar]
- 18.Heinze T, Kuhlmann S. Across institutional boundaries?: Research collaboration in German public sector nanoscience. Research Policy. 2008;37(5):888–899. [Google Scholar]
- 19.Chin S-C, Madlock-Brown C, Street WN, Eichmann D. Firework visualization: A model for local citation analysis; Paper presented at: Proceedings of the 2nd ACM SIGHIT International Health Informatics Symposium; 2012. [Google Scholar]
- 20.Liu X, Bollen J, Nelson ML, Van de Sompel H. Co-authorship networks in the digital library research community. Information processing & management. 2005;41(6):1462–1480. [Google Scholar]
- 21.Barabâsi A-L, Jeong H, Néda Z, Ravasz E, Schubert A, Vicsek T. Evolution of the social network of scientific collaborations. Physica A: Statistical Mechanics and its Applications. 2002;311(3):590–614. [Google Scholar]
- 22.Torniai C, Essaid S, Lowe B, Corson-Rikert J, Haendel M. Finding common ground: integrating the eagle-i and VIVO ontologies; The Fourth International Conference on Biomedical Ontologies; Montreal, Quebec. 2013. [Google Scholar]
- 23.Krafft DB, Börner K, Corson-Rikert J, Holmes KL. The Future of VIVO: Growing the Community. Synthesis Lectures on Semantic Web: Theory and Technology. 2012:152. [Google Scholar]
- 24.Frechtling J, Raue K, Michie J, Miyaoka A, Spiegelman M. The CTSA National Evaluation Final Report. 2012 [Google Scholar]


