

Abstract
We study genome-wide nucleotide diversity in three subspecies of extant chimpanzees using exome capture. After strict filtering, Single Nucleotide Polymorphisms and indels were called and genotyped for greater than 50% of exons at a mean coverage of 35× per individual. Central chimpanzees (Pan troglodytes troglodytes) are the most polymorphic (nucleotide diversity, θw = 0.0023 per site) followed by Eastern (P. t. schweinfurthii) chimpanzees (θw = 0.0016) and Western (P. t. verus) chimpanzees (θw = 0.0008). A demographic scenario of divergence without gene flow fits the patterns of autosomal synonymous nucleotide diversity well except for a signal of recent gene flow from Western into Eastern chimpanzees. The striking contrast in X-linked versus autosomal polymorphism and divergence previously reported in Central chimpanzees is also found in Eastern and Western chimpanzees. We show that the direction of selection statistic exhibits a strong nonmonotonic relationship with the strength of purifying selection S, making it inappropriate for estimating S. We instead use counts in synonymous versus nonsynonymous frequency classes to infer the distribution of S coefficients acting on nonsynonymous mutations in each subspecies. The strength of purifying selection we infer is congruent with the differences in effective sizes of each subspecies: Central chimpanzees are undergoing the strongest purifying selection followed by Eastern and Western chimpanzees. Coding indels show stronger selection against indels changing the reading frame than observed in human populations.
Keywords: fitness effect, mutation, selection, effective size
Introduction
Chimpanzees and bonobos are the closest living relatives of humans. Population genetic data from chimpanzee subspecies have until recently been scarce and mainly based on either mitogenomes (Stone et al. 2010; Hvilsom et al. 2014), microsatellite markers (Becquet et al. 2007; Wegmann and Excoffier 2010; Gonder et al. 2011; Hvilsom et al. 2013) or on nuclear fragments (Fischer et al. 2004; Caswell et al. 2008). These studies have revealed four distinct chimpanzee populations referred generally as subspecies, which have recently diverged and have maintained limited gene flow for an extended period since.
Prado-Martinez et al. (2013) performed the first high coverage sequencing of five individuals from each subspecies and confirmed separation into four distinct populations and revealed different demographic histories in the four populations. Chimpanzees, unlike modern humans, have not experienced a species wide massive population bottleneck and harbor more genetic variation than humans. Therefore, the action of natural selection may be investigated with more power using chimpanzee data. Hvilsom et al. (2012) performed high coverage exome sequencing of 12 Central chimpanzees and found more efficient purifying selection than in humans and adaptive evolution targeting preferentially the X chromosome.
In this study, we include exome data from the Eastern and Western chimpanzees and compare more broadly general patterns of natural selection in three extant subspecies. We characterize the demographic history using synonymous single nucleotide polymorphisms (SNPs) in coding regions. We infer the distribution of fitness effect of segregating deleterious mutations and find generally higher efficacy of natural selection in the chimpanzee populations than in human populations.
Materials and Methods
DNA Samples, Library Preparation, and Sequencing
Genomic DNA was randomly fragmented by the company Covaris with the size of the library fragments distributed between 150 and 200 bp. Adapters were ligated to both ends of the resulting fragments. The adapter-ligated templates were purified by the Agencourt AMPure SPRI beads and fragments with insert size of about 250 bp were excised. Extracted DNA was amplified by ligation-mediated polymerase chain reaction (LM-PCR), purified, and hybridized to the SureSelect Biotinylated RNA Library (BAITS) for enrichment, hybridized fragments were bound to the strepavidin beads whereas nonhybridized fragments were washed out after 24 h. Captured LM-PCR products were subjected to Agilent 2100 Bioanalyzer to estimate the magnitude of enrichment. Each captured library was then loaded on a Hiseq2000 platform for high-throughput sequencing for each captured library to ensure that each sample meets the desired average sequencing depth. Raw image files were processed by Illumina basecalling Software 1.7 for with default parameters and the sequences of each individual were generated as 90-bp pair-end reads.
Read Mapping on the Human Reference Genome
SOAPaligner (soap2.21) was used to align the cleaned reads to the human reference genome (hg19) with a maximum of three mismatches. The full set of options set was: SOAPaligner -a -b -D -o -u -p -2 -m -x -s 40 -l 35 -v 32. Based on results from SOAPaligner, SOAPsnp was used to assemble the consensus sequence and call genotypes in the target regions. The following options for SOAPsnp were used: SOAPsnp -i -d -o -r 0.0005 -e 0.001 -u -L 150 -T -s -2.
For detailed information on the meaning of each of the above options for SOAPaligner and SOAPsnps, we refer to http://soap.genomics.org.cn/soapsnp.html, last accessed June 2012.
SNP Calling and Filtering
We filtered candidate SNPs with the following criterion applied to each individual mapping file in turn: An SNP in a single individual was called if its quality was equal to or greater than 20, the count of the rarest allele was at least 4, the total sequencing depth was below 200 for the position of the putative SNP, the estimated copy number is no more than 2, and the distance between two SNPs is larger than 5.
Genotypes were subsequently called in all individuals at each SNP position. For genotypes to be called, the coverage had to exceed 15. Heterozygous genotypes were called if the minor allele was seen at least twice. Polarity of chimp SNPs was determined from the human variant that reads were mapped against.
Indel Calling and Filtering
First, BWA was used to align the sequence reads to the human reference genome (hg18), with the parameters setting as -o 1 -e 63 -i 15 -IL -l 31 -k 2 -t 6. Then, Picard was used to examine all the aligned records to locate duplicate molecules. Genome Analysis Toolkit (GATK, version 1.1) was the main tool for indel calling. Indel Realign was executed using the full Smith–Waterman alignment algorithm and base quality scores of reads were recalibrated in the aligned .BAM files. Finally, indels were called with the help of the UnifiedGenotyper in GATK using default parameter. To exclude false positive calls and potential artifacts, indels with QD score less than 2.0 or ReadPosRankSum less than −20.0 or FS score larger than 200.0 were removed as recommended by the Broad Institute. Finally, we then converted hg18 genome coordinates to hg19 genome coordinates.
We merged the indels of all samples and obtained 3,788 indels.
We filtered candidate indels with the following criteria:
Its FILTER flag is not the PASS tag.
It is not a biallelic indel.
It is not called in all 29 individuals.
After filtering, we were left with 2,151 indels.
Principal Component Analysis
SNP data were analyzed using principal component analysis (PCA). For each individual each SNP was encoded as 0 for reference homozygotes, 0.5 for heterozygotes, and 1 for alternative homozygotes. SNPs where both alleles were not called were discarded leaving a total of 76,555 SNPs position for the analysis. PCA was performed in R using the function “prcomp.”
The first three PCs were accounting for, respectively, 10%, 6%, and 4% of the total variance in the data and clearly separated each subspecies.
Inference of Demographic History from Patterns of Polymorphism and Divergence between Subspecies
We based our analysis on autosomal synonymous SNPs only. We summarized the patterns of within subspecies polymorphism using the number of polymorphic sites and the number of private SNPs in each subspecies. We summarized patterns of divergence between subspecies using the mean and variance of differences in allele frequencies between pairs of subspecies. Thus, we used 12 summary statistics in total to summarize the synonymous SNPs data.
Following Wegmann and Excoffier (2010), we assumed two evolutionary models to compare model fit, one with standard population size and the other with exponential growing or shrinking population size, and we assumed uninformative (bounded) uniform prior distributions for all parameters (the current and ancestral population size, and the splitting time). We performed 2 million simulations of 19.85-Mb DNA sequences with mutation rate using fastsimcoal2 (Excoffier et al. 2013) and used ABCtoolbox (Wegmann and Excoffier 2010) to estimate demographic parameters through an approximate Bayesian computation (ABC) procedure where the 5,000 best simulations (yielding the summary statistics closest to the observed) were kept to compute an approximate posterior distribution of the parameters.
D Statistics
We computed D statistics (Durand et al. 2011) for all triplets of one Eastern, one Central, and one Western chimpanzee using humans as outgroup. Positive values indicate a closer relationship between Central and Western chimpanzees than between Eastern and Western chimpanzees and negative values a closer relationship between Western and Eastern chimpanzees.
To obtain measures of the uncertainty in the statistics, the data were split into 100 equal sized blocks and resampled from these 100 times to obtain a standard deviation. Dividing the D statistics with this gives us Z scores. Values falling outside the −2.96 to 2.96 are considered significant when not correcting for multiple tests. Correcting for the multiple comparisons is not straightforward as theses tests are not independent but the general pattern is showing a large amount of significant negative values (see supplementary fig. S2, Supplementary Material online)
Intensity of Purifying and Positive Selection
Direction of selection (DoS), just like neutrality index (NI), provides a single summary statistic that measures the strength of purifying selection based on counts of polymorphism and divergence for synonymous and nonsynonymous sites (Stoletzki and Eyre-Walker 2011). DoS was computed as DoS =Dn/(Dn + Ds) − Pn/(Pn + Ps), in each of the 10-kb exonic windows for each subspecies, where Ds (respectively, Dn) represents the number of synonymous (respectively, nonsynonymous) divergent sites and Ps (respectively, Pn) the number of polymorphic synonymous (respectively, nonsynonymous) sites.
The DoS is expected to be zero under selective neutrality, negative under purifying selection, and positive under positive selection. Approximate standard errors (SEs) for DoS in each window were obtained by parametric bootstrap under the assumption that Pn, Ps, Dn, and Ds are independently distributed Poisson random variables. Upon visual inspection, empirical DoS distributions were roughly normal and are reported using a smoothed distribution for each subspecies (using the R function “density” with the default smoothing kernel and a bandwidth of 0.1). We used a Kolmogorov–Smirnov two-sample tests to contrast the autosomal and X-linked distributions of DoS values within each subspecies.
Theoretical Expectations for DoS
Exact expectations for the value of DoS as a function of the mean strength of purifying selection, S, presented in figure 7 were obtained numerically. All numerical calculations and analytical approximations are summarized in a Mathematica notebook.
Fig. 7.—

Theoretical expectation for DoS as a function of the strength of purifying selection against a mutation, S. Expectations are derived by numerical (exact) calculation based on the diffusion approximation of the Wright–Fisher model to calculate sojourn times and the total number of synonymous nonsynonymous polymorphic and divergent sites (see supplementary Mathematica notebook, Supplementary Material online, for details). Each S value on the x axis corresponds to a mean strength of selection that is also the mean of the assumed Γ distribution for S when computing the expected value of DoS. Different curves correspond each to a different shape parameter assumed for modeling the Γ distribution of S: Blue (shape of α = 0.05), magenta (α = 0.25), red (α = 0.5). In gray, we use for illustration the shape parameter inferred from the full SFS data in the Central subspecies (α = 0.12).
Some analytical approximations are provided in the notebook that rely on the assumption that S is Γ distributed with a shape parameter assumed to be smaller than 1. Note that Welch et al. (2008) used a similar strategy to obtain analytical approximations for the NI.
Inference of the Strength of Purifying Selection from SFS Data in Each Subspecies
We used the method proposed by Eyre-Walker et al. (2006) to infer the strength of purifying selection, S, from SFS counts in each subspecies. The method assumes independence among SNPs, that synonymous SNPs are neutral, that all segregating nonsynonymous mutations are deleterious, and that the strength of purifying selection S is Γ distributed across the genome. The method we used is agnostic to the exact underlying demographic scenario experienced by each subspecies and jointly infers the Γ distribution and a set of nuisance parameters that describe the effect of (unknown) demographics on the SFS counts relative that what is expected in an ideal Wright–Fisher population at demographic equilibrium.
We also estimated S for autosomal indels under the assumption that multiple of three indels is selectively neutral. Making that assumption is necessary to have a neutral base line. This gives a conservative estimate of purifying selection against indels as we can still expect some purifying selection acting on indels that are multiple of three in coding regions.
Results
Patterns of Polymorphism Detected in Exonic Regions
We sequenced 29 exomes of Central (n = 12 individuals), Western (n = 6), and Eastern chimpanzees (n = 11, see supplementary table S1, Supplementary Material online, for details on the origin of samples). For each individual, we obtained at least 15 million raw reads (average read length 90 bp) that mapped to the reference human genome (hg19). Overall capture specificity of the exons we targeted was high (>78%) and we achieved a high coverage for the exonic regions of every individual sequenced (at least 30× mean coverage and most often 35–40×, see supplementary table S1, Supplementary Material online).
Based on mapped reads, we called a total of 114,373 SNP and indel polymorphisms in both autosomal and X-linked exonic regions. The mean depth of coverage of the flanking regions was substantially smaller (3–6×) and these regions were not considered further in this study. The counts of private versus shared SNPs and indels for autosome and X chromosome are shown in figure 1. Central chimpanzees have most private polymorphisms, a high proportion of which are singletons in our sample. More synonymous SNPs than nonsynonymous are shared among populations, and more insertions than deletions. This suggests stronger purifying selection on nonsynonymous changes and on deletions. Furthermore, there is also evidence for selection against indels that do not conserve the reading frame as these are less likely to be shared among subspecies.
Fig. 1.—

(a) Venn diagrams for the autosomes and the X chromosomes are shown (left and right, respectively). The red numbers are nonsynonymous alleles and the green are synonymous alleles. The numbers in the brackets for nonsynonymous and synonymous alleles are the number of singletons for all three subpopulation that are present in the respective species. The blue are fixed nonsynonymous alleles and the black are fixed synonymous alleles. Notice that these fixed alleles are not part of the Venn diagram; they are just a measure of how many alleles that are fixed in each subspecies. The allele can be both polymorphic and fixed in the other species. The numbers in the brackets for the fixed synonymous and nonsynonymous alleles are fixed alleles that are different from the reference allele (here the human allele), which only occurs in the respective subspecies, meaning that the two other species both have the reference allele in this position with no variation. (b) Venn diagrams for the autosomes and the X chromosomes are shown (left and right, respectively). The red numbers show the number of deletions and the green number shows the number of insertions. The numbers in the brackets are how many deletions or insertions that are a multiple of 3.
We used a PCA of SNP polymorphisms to visualize the genetic proximity of individuals within and between subspecies (fig. 2A). The first two principal components illustrate that individuals are grouped unambiguously according to subspecies. This is expected given the amount of data available to distinguish individuals. We note that at most 16% of the total variation is accounted for by the first two principal components and that most of the variation detected here is shared among subspecies. This finding is congruent with the modest genetic divergence between the three subspecies we are studying. A PCA of indel polymorphism data shows a similar result with more scatter among individuals from the same subspecies (fig. 2B). Interestingly, this pattern is not just due to the fact that much fewer indels were called relative to SNPs (supplementary fig. S5, Supplementary Material online) and suggests that indels polymorphisms exhibit on average less genetic differentiation than SNPs among the three subspecies.
Fig. 2.—
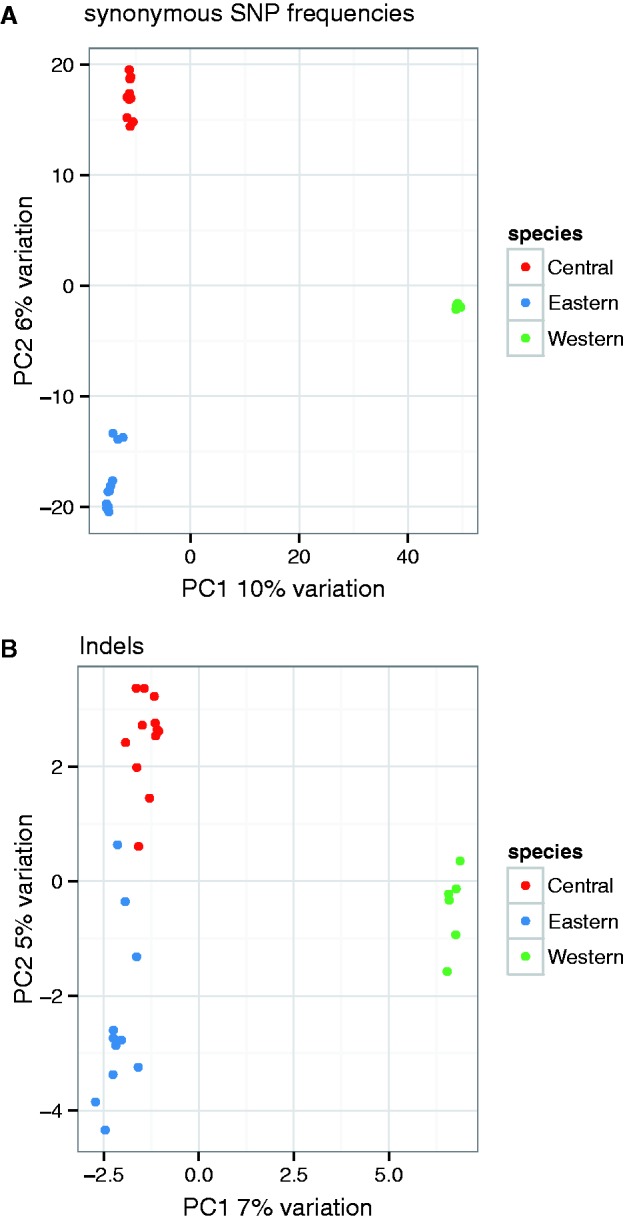
Principal component analysis. (A) Synonymous SNP frequencies. (B) Indels.
Demographic History Inferred through the Synonymous Autosomal SNP
We assumed a model with instantaneous population splits followed by complete isolation to describe the joint demographic history of Eastern, Central, and Western chimpanzees. In order to infer the parameters under each model and compare the relative fit of the model to the data, we first extracted the 59,905 synonymous SNPs from the 112,034 autosomal SNPs. We used a total of 12 statistics to summarize the patterns of within-subspecies polymorphism (the number of polymorphic sites and the number of private SNPs for each subspecies) and between-subspecies divergence (mean and variance of differences in allele frequencies between each pair of species). This set was used in conjunction with coalescent simulations to infer, through ABC, the demographic parameters under each model (see details about the ABC-based inference in the Materials and Methods section).
Comparison of models through Bayes factors suggests that the simplest model pictured in figure 3 produced a satisfactory fit to the data (Bayes factor = 1.51) compared with the model that included the possibility for exponential growth or decline after the separation of each subspecies. The full posterior distributions of parameters are shown in supplementary figure S4, Supplementary Material online. The estimated divergence time of Central and Eastern chimpanzees is about 0.14 Ma, whereas Western chimpanzees separated from these about 0.64 Ma. These estimates are assuming a mutation rate of per base pair per year (Venn et al. 2014) and a generation time of 20 years (fig. 3). Note that these estimates are also contingent on the assumption of pure divergence among subspecies.
Fig. 3.—

Overview of the demographic model inferred from autosomal synonymous SNPs. Estimates reported here are assuming a constant population sizes within each subspecies and a pure divergence model without gene flow. Population size and divergence time estimates are based on ABC and coalescent simulations assuming a generation time of 20 years and a mutation rate of 0.6 × 10⁻⁹ per year per site.
We used a new simulation approach to compute the expected site frequency spectrum (SFS) under our fitted model and thereby assess the fit of the demographic model to the observed synonymous SFS of the three subspecies (supplementary method, Supplementary Material online). We found a very good fit for the Central chimpanzee, slightly less good fit for the Eastern Chimpanzee, and a poorer fit for the Western chimpanzee (supplementary fig. S3, Supplementary Material online). This prompted us to use nonparametric test of possible gene flow among subspecies.
The D statistic (Durand et al. 2011) summarizes the patterns of SNP sharing at the individual level and as an alternative test of recent gene flow among the three subspecies. We find evidence for gene flow between Eastern and Western chimpanzees although these are currently the geographically most distant subspecies with most likely direction of gene flow from Western into Eastern as Eastern samples show most variance in gene flow from Western individuals (supplementary fig. S2, Supplementary Material online).
Genome-Wide Patterns of Polymorphism and Divergence
We derived the synonymous and nonsynonymous site frequency spectra for autosomes and X chromosomes separately (fig. 4). Nonsynonymous SNPs show a shift toward more rare variants when compared with synonymous SNPs in all three populations. This effect appears less pronounced for the X chromosome in the Eastern and Central subspecies but not in Western chimpanzees.
Fig. 4.—
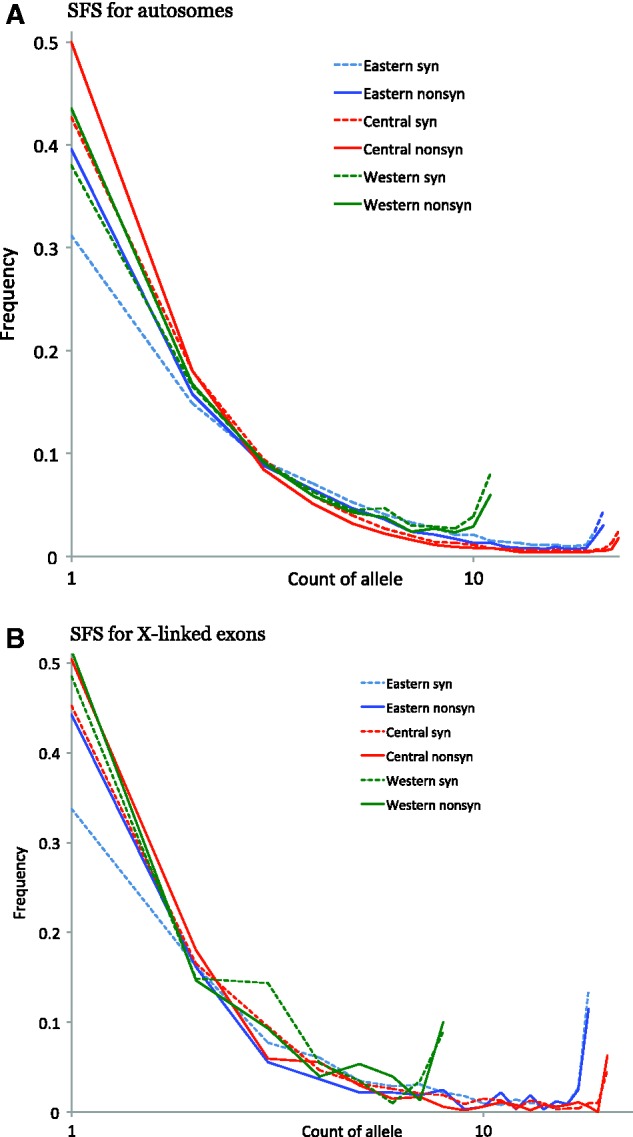
Derived SFS of polymorphism segregating in each subspecies. (A) SFS for autosomes. (B) SFS for X-linked exons.
The distribution of coding indel size is shown in figure 5B. There is an excess of deletions compared with insertions and a strong enrichment of indels that conserve the reading frame (around 65%). This suggests stronger purifying selection against indels that disrupt the reading frame than what is found in humans, where the fraction is below 60% (Genomes Project Consortium et al. 2012). For segregating variation, indels that disrupt the reading frame have an excess of rare variants compared with indels that conserve the reading frame (fig. 5B) also suggestive of selection against the former.
Fig. 5.—

Distribution of indel polymorphism and indel size. (A) SFS of indel in autosomes. (B) Distribution of indel variants size.
Inferring the distribution of fitness effects by likelihood approaches often requires a well-defined demographic scenario (Keightley and Eyre-Walker 2007; Boyko et al. 2008; Eyre-Walker and Keightley 2009). Alternatively, simpler statistics, such as the NI and the DoS, could potentially be used to measure more broadly the role of purifying and positive selection on patterns of polymorphism and divergence (Weinreich and Rand 2000; Stoletzki and Eyre-Walker 2011). The advantage of these statistics is that they can be used to estimate the relative roles of purifying or positive selection in particular genomic region compared with the rest of the genome as for instance, Paape et al. (2013).
We computed the genome-wide distribution of both the NI and DoS statistics for genomic regions spanning 10 kb of consecutively called exons. These empirical distributions are reported as smoothed histograms of both NI and DoS (fig. 6, see also supplementary fig. S1, Supplementary Material online, for a nonsmoothed histogram). For the autosomes, the Eastern and Central subspecies have virtually identical distributions of both NI and DoS whereas the Western subspecies shows a larger variance (Central vs. Eastern F = 1.02, P = 0.73; Central vs. Western F = 1.61, P < 10−15). For X-linked regions, the DoS is different from the autosomal (Kolmogorov–Smirnov two sample tests; Eastern: D = 0.30, P = 1.36 e-06; Central: D = 0.31, P = 4.9 e-07; Western: D = 0.26, P = 6.36 e-05) and X-linked regions shifted to more positive values of DoS relative to autosomes (fig. 6A), particularly in the Central chimpanzees. Distributions of DoS thus suggest that autosomal regions have undergone less positive selection than X-linked regions.
Fig. 6.—
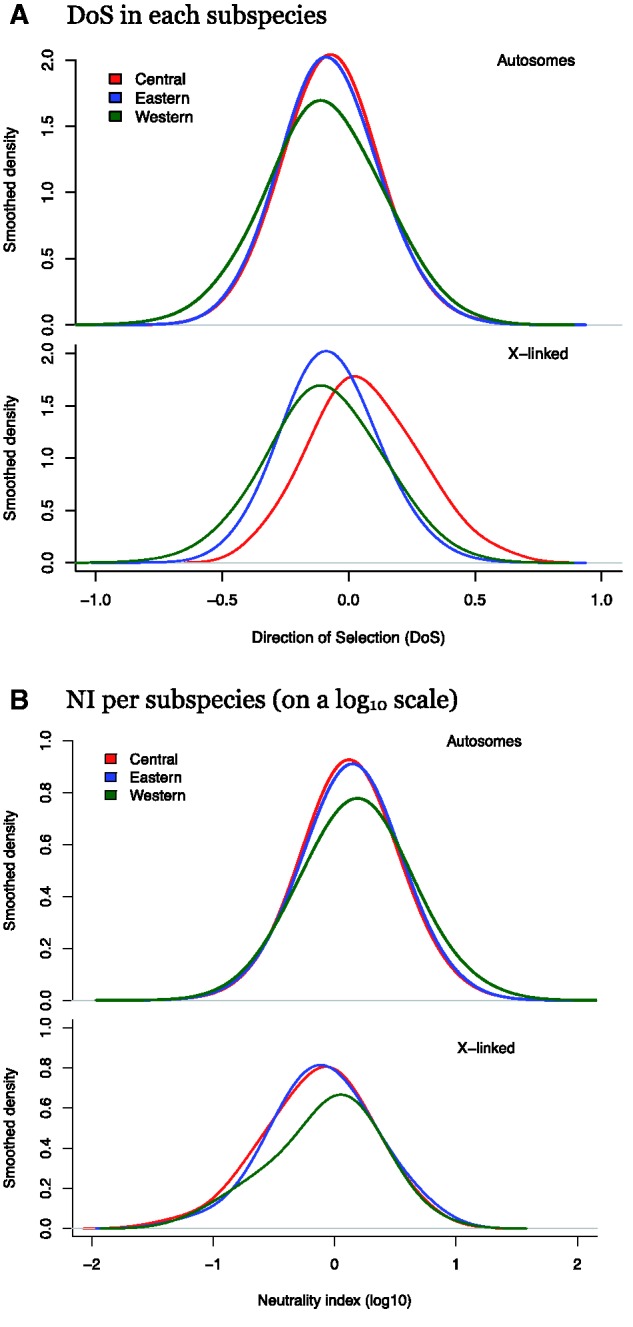
Empirical distribution of NI and DoS on autosomal and X-linked regions. Divergence is computed using exclusively the chimpanzee branch from human–chimpanzee ancestor. (A) DoS in each subspecies. (B) NI per subspecies (on a log10 scale).
If different mean values or distributions of DoS and NI are expected from differences in strength of purifying selection, these can be used as a proxy for the SFS to compare differences in strength of purifying selection among the three subspecies. Others’ studies have derived the relationship between NI and S (Weinreich and Rand 2000) and further analytical approximations for expected values of NI by Welch et al. (2008), but to our knowledge this is the first investigation of the relationship between DoS and S. We examined how the DoS statistic covaries with the strength of purifying selection.
To do so, we assumed a standard Wright–Fisher model of mutation–selection–drift equilibrium and computed numerically the expected value of DoS as a function of the strength of purifying selection, S = 4Nes, acting against a mutation with deleterious effect s segregating in population with effective size Ne (fig. 7). Using S to measure the strength of purifying selection makes explicit reference to a Wright–Fisher model for the action of purifying selection. Using S we can compare the intensity of purifying selection across groups of genes with specific properties such as breath of expression (Paape et al. 2013) or chromosomes (Hvilsom et al. 2012). It also allows direct comparison of the strength of purifying selection among different species and different studies (Keightley and Eyre-Walker 2010; Bataillon and Bailey 2014).
We assume that every nonsynonymous SNP is under purifying selection with strength S drawn from an underlying Γ distribution. Although NI varies monotonically with S (i.e., Welch et al. 2008), DoS exhibits a strong nonmonotonic variation with S (fig. 7). This analysis reveals that although DoS can still work as a summary statistic for detecting positive selection from counts of polymorphism and divergence at synonymous versus nonsynonymous sites, it should not be used as a proxy for the strength of purifying selection.
Strength of Purifying Selection among Chimpanzee Subspecies
DoS is not a useful summary statistic to quantify the strength of purifying selection. Therefore, we inferred S directly from SFS data. We used the likelihood-based method of Eyre-Walker et al. (2006) (see Materials and Methods for details) to infer the Γ distribution that describes the variation of S within each subspecies. The advantage of this method is that it controls for demographic effects on SFS without specifying a specific demographic scenario.
The Γ distributions inferred from autosomal SFS in each species exhibited shape parameters that were low (Eastern: 0.17 [CI: 0.15–0.19], Central: 0.16 [0.15–0.17], Western: 0.12 [0.11–0.14]) generating distributions that are very L shaped with a large statistical uncertainty around the mean strength of purifying selection (Eastern: mean S = 3.57e4 [1.07e4, 1.0e5], Central: mean S = 7.71e4 [3.74e4, 1.39e5], Western: mean S = 3.64e5 [5.27e4, 1.0e6]). We therefore chose to report the proportion of mutations falling within four categories of S values reflecting different strengths of selection on both autosomes (fig. 8A) and the X chromosome (fig. 8B). This provides a visual summary of the inferred Γ distributions underlying the variation in S and facilitates comparison with studies assuming different underlying distribution for S (Kousathanas and Keightley 2013; Bataillon and Bailey 2015).
Fig. 8.—

Distribution of fitness effect of nonsynonymous and indel mutations in each subspecies. (A) Distribution of S inferred from the synonymous and nonsynonymous SFS autosomal data in each subspecies. Distributions are discretized by reporting the proportion of the mutation in four classes of purifying selection. Error bars denote SE around estimated proportions. (B) Distribution of S inferred from the synonymous and nonsynonymous SFS on X-linked data in each subspecies. (C) Distribution of S inferred from the multiple of three and nonmultiple of three SFS of autosomal indel data in each subspecies.
Overall, we found that all subspecies of chimpanzee undergo fairly strong purifying selection. Very slightly deleterious mutations with |S| < 1 represent at most 20% of all deleterious mutations (fig. 8B) and a large fraction of the nonsynonymous mutations are under strong (10 < |S| < 100) or very strong purifying selection (|S| > 100) in all subspecies. The strength of purifying selection we infer on autosomes is different from subspecies to subspecies and is qualitatively consistent with the differences we can expect from our estimates of effective sizes of each subspecies (fig. 3), and with the comparison of piN/piS ratios (table 1): Central chimpanzees are undergoing the strongest purifying selection followed by Eastern and Western chimpanzees.
Table 1.
Summary of Synonymous and Nonsynonymous Variation in Exon Regions
| Watterson’s Theta (θw) |
Nucleotide Diversity (π) |
|||||
|---|---|---|---|---|---|---|
| East | Central | West | East | Central | West | |
| Autosomal synonymous | 0.0016 | 0.0023 | 0.0008 | 0.0015 | 0.0017 | 0.0008 |
| Autosomal nonsynonymous | 0.0004 | 0.0005 | 0.0002 | 0.0003 | 0.0003 | 0.0002 |
| Ratio | 0.23 | 0.22 | 0.25 | 0.21 | 0.20 | 0.24 |
| X synonymous | 0.0009 | 0.0011 | 0.0004 | 0.0007 | 0.0008 | 0.0004 |
| X nonsynonymous | 0.0002 | 0.0002 | 0.0001 | 0.0001 | 0.0002 | 0.0001 |
| Ratio | 0.20 | 0.20 | 0.22 | 0.18 | 0.18 | 0.22 |
| X/Autosomal (syn) | 0.53 | 0.49 | 0.50 | 0.47 | 0.49 | 0.48 |
| X/Autosomal (nonsyn) | 0.46 | 0.45 | 0.45 | 0.41 | 0.44 | 0.44 |
When we infer the strength of selection on indels (fig. 8C) from the indel SFS data (fig. 5A), we interestingly infer that the strongest selection is detected in Central chimpanzees followed by Eastern and Western exhibiting the greatest fraction of deleterious mutations with |S| < 1. Given the much lower sample size on indels relative to SNPs, the proportion of S categories is not statistically different between Eastern and Central but Western chimpanzees exhibiting the greatest fraction of deleterious mutations with |S| < 1 for that class of mutations.
Moreover, our analysis suggests that purifying selection is just as strong on X compared with autosomes, possibly marginally stronger. However, the number of SNPs available on the X chromosome is quite modest relative to all autosomes and this precludes detecting any clear difference between the three subspecies although the X seems to undergo marginally less purifying selection in the Western subspecies (fig. 8B).
Discussion
Patterns of Polymorphism and Demographic History of Chimpanzee Subspecies
We provide the first detailed genome-wide survey of nucleotide and indel polymorphism for gene-coding regions in three extant subspecies of chimpanzee. In doing so, we confirm findings of earlier studies comparing the amounts of polymorphism in chimpanzee that, based on limited nucleotide sequence data in both genic and intergenic regions, reported higher diversity in Central chimpanzee relative to Eastern and Western chimpanzees (Fischer et al. 2004; Prado-Martinez et al. 2013). We also provide a first empirical characterization of the distribution of indel polymorphism in protein-coding regions. As expected, indel sizes in coding sequence that are a multiple of 3 bp, thus preserving the reading frame of the exon, segregate at consistently higher frequency compared with those that are not a multiple of 3 bp.
Using a very simple demographic scenario to fit the patterns of synonymous polymorphism and divergence, we infer a demographic history with separation times that are very close to those inferred by Wegmann and Excoffier (2010) using a much smaller amount of data (microsatellites and nucleotide sequence) as well as other previous studies by Won and Hey (2005), Hey (2010), Caswell et al. (2008), and Becquet et al. (2007). In particular we confirm the relative ratios of long-term coalescence effective sizes inferred by Wegmann and Excoffier (2010), as well as the closer genetic proximity of Eastern and Central subspecies with an estimated separation time of approximately 0.14 Ma, with the Western subspecies separating about 0.64 Ma. Despite a substantial amount of data used for our inference, models invoking more complicated demographics after the split of Central, Eastern, and Western population did not provide a much better fit.
A detailed inference of the demographic history of the three subspecies of chimpanzee we surveyed is not our primary focus, and our sample was not designed for such a goal. However, it is interesting that the nonparametric method we used (Durand et al. 2011) confirms the existence of recent gene flow from the Western into the Eastern chimpanzee subspecies originally discussed by Hey (2010) and also observed by Prado-Martinez et al. (2013). Unlike Wegmann and Excoffier (2010) we do not find evidence for gene flow between Eastern and Central chimpanzees, but as the D statistic we use only reveals asymmetries in patterns of derived alleles it only shows that there has been more gene flow between Eastern and Western subspecies and does not suggest the absence of gene flow between Central chimpanzees and the other subspecies.
Finally, in the light of the points made above, we caution that the estimates of effective size and divergence times reported here (fig. 3) are contingent on a pure divergence model and specific assumption on mutation rates. Future work on demographic inference should ideally be based on more realistic models for mutation rates, employ samples comprising individuals from all four extent subspecies, and investigate how admixture between subspecies might affect these estimates.
Inference of Purifying and Positive Selection in Chimpanzee
We have performed the first comprehensive study of the amount of purifying and positive selection in the chimpanzee genome. Our theoretical analysis (fig. 7) demonstrates that DoS statistic does not vary monotonically with the strength of selection, S, and therefore cannot be used to infer the strength of purifying selection. But one can still use the DoS statistic to track genomic regions harboring excess nonsynonymous divergence (with DoS > 0) suggestive of the recurrent action of positive selection throughout the human–chimpanzee divergence. The proportion of windows subject to positive selection is virtually zero for the set of autosomal genomic regions we surveyed. We note and emphasize that the window size we used (10k of accumulated exonic sites called for SNPs) is likely too coarse grained for detecting positive selection affecting isolated genes. However, when inspecting the distribution of DoS values for X-linked regions, two observations are striking: The variance of these distributions is typically larger than the distribution for autosomal windows and several windows with DoS values significantly above zero are found (fig. 6). This trend is found across all three subspecies of chimpanzees.
We used a method that estimates the strength of purifying selection by treating underlying demographics as a nuisance parameter. That approach complements a variety of existing approaches that estimate distribution of fitness effects of nonsynonymous mutations based on SFS data (possibly complemented by divergence data) under very specific demographic scenarios (see Bataillon and Bailey 2015; Lawrie and Petrov 2014, for a review of various methods). These approaches—typically likelihood based—are work under a set of strictly defined demographic scenarios and currently can at best accommodate a few populations but see also Boyko et al. (2008) for a complex demographic scenarios in human populations. Importantly, in the weak purifying selection limit, the method we used is rigorously insensitive to underlying demographics and merely a function of the underlying Γ distribution of deleterious fitness effects.
This means that our estimation of the strength of purifying selection is expected to be robust to unknown details of demographics and possible sampling bias that distort both the synonymous and the nonsynonymous SFS. Effects of (unknown) demographics that distort counts away from expectations based on a Wright–Fisher model at mutation–selection–drift equilibrium will cancel out perfectly, as long as purifying selection is not too strong. A caveat that remains is that SNPs under very strong purifying selection (|S| > 100) may still experience an average demographic history that deviates from effectively neutral SNPs (|S| < 1) that may be much older in the population.
It is noteworthy that we infer a strength of purifying selection in Central chimpanzees that is very close to the estimation obtained by Hvilsom et al. (2012) using a method that assumes a single exponentially growing or shrinking population (Keightley and Eyre-Walker 2007; Eyre-Walker and Keightley 2009). The estimates of strength of purifying selection we obtained for autosomal regions (fig. 8A) are also aligned qualitatively with expectations about differences in the strength of purifying selection among subspecies given the differences in estimated long-term effective size: The Central subspecies has the highest estimated effective population size followed by Eastern and Western.
The likelihood framework we used ensures that although different sample size—in number of individuals—was used to obtain SFS data in each subspecies, the mean estimates of strength of selection are not biased by sample size (although variance on the distribution of fitness effects (DFE) parameters is affected, see error bars in fig. 8) and thus can be compared.
However, we expect a priori that efficacy of selection against a deleterious mutation scales proportionally according to the effective size. The estimates of current effective population sizes inferred from synonymous SNPs in our ABC analysis would suggest much more pronounced differences in the mean efficacy of purifying selection between the three subspecies. The modest differences we observed could be explained by their relatively recent divergence and the large amount of shared polymorphisms between them as well as possible geneflow contributing rare alleles.
Data Availability
VCF files with called polymorphisms and divergence sites are deposited in the Dryad archive. The identifier associated with our publcation is doi:10.5061/dryad.56m2g
Supplementary Material
Supplementary method, Mathematica notebook, table S1, and figures S1–S5 are available at Genome Biology and Evolution online (http://www.gbe.oxfordjournals.org/).
Acknowledgments
The authors acknowledge financial support from the Danish Council for Independent Research through research grants to M.H.S. and T.B. They thank Susan Bailey for stylistic comments, two anonymous reviewers and the associate editor George Zhang for their constructive comments.
Literature Cited
- Bataillon T, Bailey SF. Effects of new mutations on fitness: insights from models and data. “The year in evolutionary biology 2014.”. Ann N Y Acad Sci. 2014;1320:76–92. doi: 10.1111/nyas.12460. [DOI] [PMC free article] [PubMed] [Google Scholar]
- Becquet C, Patterson N, Stone AC, Przeworski M, Reich D. Genetic structure of chimpanzee populations. PLoS Genet. 2007;3:e66. doi: 10.1371/journal.pgen.0030066. [DOI] [PMC free article] [PubMed] [Google Scholar]
- Boyko AR, et al. Assessing the evolutionary impact of amino acid mutations in the human genome. PLoS Genet. 2008;4:e1000083. doi: 10.1371/journal.pgen.1000083. [DOI] [PMC free article] [PubMed] [Google Scholar]
- Caswell JL, et al. Analysis of chimpanzee history based on genome sequence alignments. PLoS Genet. 2008;4:e1000057. doi: 10.1371/journal.pgen.1000057. [DOI] [PMC free article] [PubMed] [Google Scholar]
- Durand EY, Patterson N, Reich D, Slatkin M. Testing for ancient admixture between closely related populations. Mol Biol Evol. 2011;28:2239–2252. doi: 10.1093/molbev/msr048. [DOI] [PMC free article] [PubMed] [Google Scholar]
- Excoffier L, Dupanloup I, Huerta-Sanchez E, Sousa VC, Foll M. Robust demographic inference from genomic and SNP data. PLoS Genet. 2013;9:e1003905. doi: 10.1371/journal.pgen.1003905. [DOI] [PMC free article] [PubMed] [Google Scholar]
- Eyre-Walker A, Keightley PD. Estimating the rate of adaptive molecular evolution in the presence of slightly deleterious mutations and population size change. Mol Biol Evol. 2009;26:2097–2108. doi: 10.1093/molbev/msp119. [DOI] [PubMed] [Google Scholar]
- Eyre-Walker A, Woolfit M, Phelps T. The distribution of fitness effects of new deleterious amino acid mutations in humans. Genetics. 2006;173:891–900. doi: 10.1534/genetics.106.057570. [DOI] [PMC free article] [PubMed] [Google Scholar]
- Fischer A, Wiebe V, Pääbo S, Przeworski M. Evidence for a complex demographic history of chimpanzees. Mol Biol Evol. 2004;21:799–808. doi: 10.1093/molbev/msh083. [DOI] [PubMed] [Google Scholar]
- Genomes Project Consortium, et al. An integrated map of genetic variation from 1,092 human genomes. Nature. 2012;491:56–65. doi: 10.1038/nature11632. [DOI] [PMC free article] [PubMed] [Google Scholar]
- Gonder MK, et al. From the Cover: Evidence from Cameroon reveals differences in the genetic structure and histories of chimpanzee populations. Proc Natl Acad Sci U S A. 2011;108:4466–4471. doi: 10.1073/pnas.1015422108. [DOI] [PMC free article] [PubMed] [Google Scholar]
- Hey J. The divergence of chimpanzee species and subspecies as revealed in multipopulation isolation-with-migration analyses. Mol Biol Evol. 2010;27:921–933. doi: 10.1093/molbev/msp298. [DOI] [PMC free article] [PubMed] [Google Scholar]
- Hvilsom C, Carlsen F, Heller R, Jaffré N, Siegismund HR. Contrasting demographic histories of the neighboring bonobo and chimpanzee. Primates. 2014;55:101–112. doi: 10.1007/s10329-013-0373-3. [DOI] [PubMed] [Google Scholar]
- Hvilsom C, et al. Extensive X-linked adaptive evolution in central chimpanzees. Proc Natl Acad Sci U S A. 2012;109:2054–2059. doi: 10.1073/pnas.1106877109. [DOI] [PMC free article] [PubMed] [Google Scholar]
- Hvilsom C, et al. Understanding geographic origins and history of admixture among chimpanzees in European zoos, with implications for future breeding programmes. Heredity (Edinb) 2013;110:586–593. doi: 10.1038/hdy.2013.9. [DOI] [PMC free article] [PubMed] [Google Scholar]
- Keightley P, Eyre-Walker A. What can we learn about the distribution of fitness effects of new mutations from DNA sequence data? . Philos Trans R Soc Lond B Biol Sci. 2010;365:1187–1193. doi: 10.1098/rstb.2009.0266. [DOI] [PMC free article] [PubMed] [Google Scholar]
- Keightley PD, Eyre-Walker A. Joint inference of the distribution of fitness effects of deleterious mutations and population demography based on nucleotide polymorphism frequencies. Genetics. 2007;177:2251–2261. doi: 10.1534/genetics.107.080663. [DOI] [PMC free article] [PubMed] [Google Scholar]
- Kousathanas A, Keightley PD. A comparison of models to infer the distribution of fitness effects of new mutations. Genetics. 2013;193:1197–1208. doi: 10.1534/genetics.112.148023. [DOI] [PMC free article] [PubMed] [Google Scholar]
- Lawrie DS, Petrov DA. Comparative population genomics: power and principles for the inference of functionality. Trends Genet. 2014;30:133–139. doi: 10.1016/j.tig.2014.02.002. [DOI] [PMC free article] [PubMed] [Google Scholar]
- Paape T, et al. Selection, genome-wide fitness effects and evolutionary rates in the model legume Medicago truncatula. Mol Ecol. 2013;22:3525–3538. doi: 10.1111/mec.12329. [DOI] [PubMed] [Google Scholar]
- Prado-Martinez J, et al. Great ape genetic diversity and population history. Nature. 2013;499:471–475. doi: 10.1038/nature12228. [DOI] [PMC free article] [PubMed] [Google Scholar]
- Stoletzki N, Eyre-Walker A. Estimation of the neutrality index. Mol Biol Evol. 2011;28:63–70. doi: 10.1093/molbev/msq249. [DOI] [PubMed] [Google Scholar]
- Stone AC, et al. More reliable estimates of divergence times in Pan using complete mtDNA sequences and accounting for population structure. Philos Trans R Soc Lond B Biol Sci. 2010;365:3277–3288. doi: 10.1098/rstb.2010.0096. [DOI] [PMC free article] [PubMed] [Google Scholar]
- Venn O, et al. Nonhuman genetics. Strong male bias drives germline mutation in chimpanzees. Science. 2014;344:1272–1275. doi: 10.1126/science.344.6189.1272. [DOI] [PMC free article] [PubMed] [Google Scholar]
- Wegmann D, Excoffier L. Bayesian inference of the demographic history of chimpanzees. Mol Biol Evol. 2010;27:1425–1435. doi: 10.1093/molbev/msq028. [DOI] [PubMed] [Google Scholar]
- Weinreich DM, Rand DM. Contrasting patterns of nonneutral evolution in proteins encoded in nuclear and mitochondrial genomes. Genetics. 2000;156:385–399. doi: 10.1093/genetics/156.1.385. [DOI] [PMC free article] [PubMed] [Google Scholar]
- Welch JJ, Eyre-Walker A, Waxman D. Divergence and polymorphism under the nearly neutral theory of molecular evolution. J Mol Evol. 2008;67:418–426. doi: 10.1007/s00239-008-9146-9. [DOI] [PubMed] [Google Scholar]
- Won Y-JJ, Hey J. Divergence population genetics of chimpanzees. Mol Biol Evol. 2005;22:297–307. doi: 10.1093/molbev/msi017. [DOI] [PubMed] [Google Scholar]
Associated Data
This section collects any data citations, data availability statements, or supplementary materials included in this article.
Supplementary Materials
Data Availability Statement
VCF files with called polymorphisms and divergence sites are deposited in the Dryad archive. The identifier associated with our publcation is doi:10.5061/dryad.56m2g