

Abstract
Electronic health records (EHRs) have been used as a valuable data source for phenotyping. However, this method suffers from inherent data quality issues like data missingness. As patient self-reported health data are increasingly available, it is useful to know how the two data sources compare with each other for phenotyping. This study addresses this research question. We used self-reported diabetes status for 2,249 patients treated at Columbia University Medical Center and the well-known eMERGE EHR phenotyping algorithm for Type 2 diabetes mellitus (DM2) to conduct the experiment. The eMERGE algorithm achieved high specificity (.97) but low sensitivity (.32) among this patient cohort. About 87% of the patients with self-reported diabetes had at least one ICD-9 code, one medication, or one lab result supporting a DM2 diagnosis, implying the remaining 13% may have missing or incorrect self-reports. We discuss the tradeoffs in both data sources and in combining them for phenotyping.
Introduction
The vast amounts of clinical data made available by pervasive electronic health records (EHRs) presents a great opportunity for reusing these data to improve the efficiency and lower the costs of clinical and translational research1. One popular use case is to identify patients for care management or research, prospectively, or as part of retrospective cohort for study. In this context, cohort identification using EHR data is known as EHR phenotyping.
The Electronic Medical Records and Genomics (eMERGE) consortium is a current multi-site research network sponsored by the National Institutes of Health of the United State. This network develops precise and portable phenotyping algorithms using heterogeneous EHR data2. To improve algorithm portability across different EHR systems, the design and evaluation of EHR phenotyping algorithms have relied on collaboration across institutions. For example, the eMERGE Type 2 Diabetes Mellitus (DM2) Case and Control algorithms were developed collaboratively by five institutions, resulting in the identification of over three thousand cases and controls to support a genome-wide association study (GWAS) on diabetes patients3,4. The algorithm uses commonly captured EHR data elements for diagnosis, medications, and lab values to identify Type 2 diabetics. The emphasis on portability imposes a tradeoff due to the inherent data quality issues of those commonly captured EHR data elements. For example, ICD-9 billing codes are a coarse representation for nuanced narrative notes, medication orders do not necessarily reflect medication adherence, and as reported by Wei et al., EHR data fragmentation could negatively impact clinical phenotyping5. Moreover, while EHR data like lab values may be objectively correct, they may not actually reflect patient awareness of their own health status.
The eMERGE DM2 algorithm was originally validated using chart review. The expense of chart review typically limits sample size and only 50–100 each for cases and controls were reviewed in this example3,4. Moreover, the chart review process does not sample from patients excluded from the case and control groups, meaning that a true sensitivity for identification of diabetes cases may not be established. Finally, chart review is still internal validation, implying the reference standard is still limited to information captured within the EHRs of related institutions5. Richesson et al. compared the identified individuals from different diabetes phenotyping algorithms6. While different algorithms might be created for different purposes, for example maximizing sensitivity for a registry versus specificity for a genetic study, the results do suggest that any given algorithm may fail to identify all diabetics in a database.
With the increasing emphasis on patient and community engagement for clinical research, self-reported diseases status has risen as an alternative data source for clinical phenotyping. These data are usually collected directly from patients, as opposed to EHR data that reflect the encounters of a patient with a single institution. Prior studies checked the self-reported diabetes status against EHR data and achieved sensitivities around0.75, and specificities around 0.97–10.
While pieces of patient self-reported data have informed specific elements of clinical data used for phenotyping, such as self-reported smoking rate11 and date of diagnosis12, little is known about how self-reported disease status data might be useful for clinical phenotyping. Both EHR data and patient self-reported health data have advantages and disadvantages for patient identification. We faced an unusual opportunity to address this research question.
The Washington Heights/Inwood Informatics Infrastructure for Community-Centered Comparative Effectiveness Research (WICER) Project has been conducting community-based research and collecting patient self-reported health information13. A subset of surveyed individuals have clinical information stored at the Columbia University Medical Center, allowing direct comparison of diabetes status derived from clinical data to the self-reported diabetes status. Therefore, in this study we will validate the eMERGE DM2 Case algorithm using patient-reported diabetes status. This study is part of a larger research effort to use research data to verify clinical data accuracy.
Methods
1. Data Collected by WICER
Through cluster and snowball sampling methodologies, the WICER Community Survey collected data from residents in Washington Heights, an area of Northern Manhattan in New York City with a population of approximately 300,000 people. Surveys were administered to individuals over the age of 18 who spoke either English or Spanish. Survey data was collected and processed from March 2012 through September 2013. A total of 5,269 individuals took the WICER Community Survey in either the household or clinic setting.
The survey collected information about social determinants of health and health seeking behaviors as well as established some baseline health information. Survey participants were explicitly asked whether they had been told they had diabetes, high blood sugar, or sugar in the urine when not pregnant. The answer to this question was extracted as the self-reported diabetes status.
2. Data Collected by the Columbia University Clinical Data Warehouse
The Columbia University Medical Center’s Clinical Data Warehouse (CDW) integrates patient information collected from assorted EHR systems for about 4.5 million patients for more than 20 years. Commonly available structured EHR data elements include visits, medications, diagnostic codes, lab values, and clinical notes.
3. The eMERGE DM2 Case and Control Algorithms
As stated above, the eMERGE DM2 Case algorithm consists of three sets of criteria: diagnosis, medications, and lab values4. Diagnosis and medication criteria have components which indicate Diabetes Mellitus Type I (DM1) or Type II. Only patients with DM1 ICD-9 codes were completely excluded from the Case algorithm. For the purpose of this study, any patient reporting positive diabetes status who also had DM1 ICD-9 codes had their status reset to negative. DM1 medications only denote insulin dependence, which may also be found in DM2, and so additional logical criteria are required.
In contrast, the criteria for the eMERGE DM2 Control algorithm are very similar to the case algorithm, albeit inverted. Controls must have at least two visits recorded, a normal glucose measurement, and no evidence of either diabetes or conditions which might lead to diabetes. The other differences are that no effort is made to distinguish between the types of diabetes (i.e., I or II), and the range of ICD-9 codes for the diagnostic criteria is expanded to include observations that co-occur with Type 2 diabetes. Criteria and their definitions are presented in Table 1.
Table 1:
eMERGE DM2 algorithm criteria and definitions
| Criterion | Definition | Query Terms |
|---|---|---|
| DM1 Diagnosis | Patient has ICD-9 codes indicating Diabetes Type I. | 250.x1, 250.x3 |
| DM2 Diagnosis | Patient has ICD-9 codes indicating Diabetes Type II. | 250.x0, 250.x2 excl 250.10, 250.12 |
| Control Diagnosis | Patient has ICD-9 codes indicating diabetes, conditions which may lead to diabetes, or family history of diabetes | 250.xx, 790.21, 790.22, 790.2, 790.29, 648.8x, 648.0x, 791.5, 277.7, V18.0, V77.1 |
| DM1 Medications | Patient has medication history for drugs treating Diabetes Type I. | insulin pramlintide |
| DM2 Medications | Patient has medication history for drugs treating Diabetes Type II. | acetoexamide tolazamide chlorpropamide glipizide glyburide glimepiride repaglinide nateglinide metformin rosiglitazone pioglitazone troglitazone acarbose miglitol sitagliptin exenatide |
| Control Medications | Patient has medication history for drugs treating diabetes. | Combination of DM1 and DM2 Medications |
| DM Lab | Patient has recorded lab value for HbA1c > 6.5, Fasting Glucose >= 126, Random Glucose > 200 | HbA1c, Fasting Glucose, Random Glucose |
4. Cohort Identification
Patient data were extracted for every patient in the CDW for 2009–13. We chose this time window to replicate the time scale used by Richesson, et al. and to accommodate the fact that the medication data in our data warehouse are not complete prior to 2009. A subset of CDW patients who also have a WICER-recorded diabetes status was identified for validation of the eMERGE DM2 Case algorithm. The remainder of the CDW population was used to investigate potential differences between the self-reported population and the general data population.
5. Data Element Extraction for Each Cohort
Table 2 presents the variables and definitions required for cohort identification and comparison using the eMERGE Case and Control algorithms. For each patient in a dataset, the data elements in Table 2 were either extracted or calculated. The self-reported diabetes status for each individual was extracted from their survey response and included in the patient level data. For the purpose of this study, any patient reporting positive diabetes status who also had DM1 ICD-9 codes had their self-reported status reset to negative.
Table 2:
Patient level data variables and definitions
| Variable | Definition |
|---|---|
| Sex | Sex of the patient. |
| Age | Age in years on 1/1/2014. |
| Visits | Number of visits between 2009 and 2013. |
| Span | Length of time in days between first and last recorded visit. |
| DM1 Diagnosis | Number of ICD-9 codes meeting the Diabetes Type I diagnostic criteria. |
| DM2 Diagnosis | Number of ICD-9 codes meeting the Diabetes Type II diagnostic criteria. |
| Control Diagnosis | Number of ICD-9 codes meeting the Control algorithm diagnostic and family history exclusion criteria. |
| DM1 Medication | Earliest prescription date for medication meeting the Diabetes Type I medication criteria. |
| DM2 Medication | Earliest prescription date for medication meeting the Diabetes Type II medication criteria. |
| Control Medication | Number of medication orders meeting the control algorithm exclusion criteria. |
| Glucose Tests | Number of glucose test values recorded for the patient. |
| Abnormal Labs | Number of lab results high enough to indicate diabetes. |
| Diagnosis Criteria | 1 if the patient meets the diagnostic criteria for Diabetes Type II, 0 otherwise. |
| Medication Criteria | 1 if the patient meets the medication criteria for Diabetes Type II, 0 otherwise. |
| Lab Value Criteria | 1 if the patient meets the labs criteria for Diabetes Type II, 0 otherwise. |
| Case | 1 if the patient is identified by the eMERGE Case algorithm, 0 otherwise. |
| Control | 1 if the patient is identified by the eMERGE Control algorithm, 0 otherwise. |
| Survey Diabetes | 1 for a positive patient-reported diabetes status, 0 otherwise. Exists only in Matched Data |
6. Analysis Plan
Several groups of patients were collected for comparison from both the subset of patients with self-reported diabetes status and general patient population. These groups are the patients identified by the eMERGE DM2 Case algorithm (eMERGE Case: Case = 1), the pool of potential cases meeting any of the diagnostic, medication, or lab value criteria (Case Pool: Diagnosis OR Medication OR Lab), and those patients meeting none of the criteria (Excluded: Not Diagnosis AND Not Medication AND Not Lab AND Not Control). For patients with self-reported status, patients responding “Yes” and “No” were also separated for analysis. The number of patients, fraction of patients who are female, average and standard deviation for age, number of visits, and time between the first and last recorded visit for each group were reported. For groups of patients with self-reported status, the number of patients identifying as diabetic was also reported. Summary values for each group were quantitatively described and compared.
Sensitivity, specificity, and positive predictive value against all patient self-reported statuses were calculated for the eMERGE DM2 Case algorithm, the component criteria individually (Diagnosis, Medication, Lab), the group of patients meeting all the criteria (Diagnosis AND Medication AND Lab), and patients meeting any of the criteria (Diagnosis OR Medication OR Lab). Sensitivity, specificity, and positive predictive value were also calculated for the eMERGE DM2 Case group using just the individuals identified by the paired Control algorithm.
The eMERGE DM2 Case algorithm was expected to identify patients who do not report having diabetes, and not all patients reporting diabetes were expected to be identified by the algorithm. To investigate whether identification by the DM2 Case algorithm was a result of different subtypes of diabetes, with different patterns of comorbidities, all ICD-9 codes were pulled for each patient. ICD-9 codes were truncated at the root code level, or the whole number component of the code, and the frequencies of codes for each group were reported.
Results
We report our results in Tables 3–6, which includes summary statistics and demographics on specified patient groups, as well as validation statistics against all patient self-reported diabetes statuses and only those identified by the Control algorithm. See Figure 1 for a Venn diagram displaying the overlap between the patients identified by the eMERGE DM2 Case algorithm and those patients self-reporting positive diabetes status.
Table 3:
Cohort Demography and Characteristics. Groups are patients identified by the eMERGE DM2 Case algorithm (eMERGE Case), pool of potential cases meeting any of the diagnostic, medication, or lab value criteria (Case Pool), and those patients meeting none of the criteria (Excluded). Patients answering “Yes” or “No” to diabetes status are also presented.
| Cohort | Group | N | Patient-reported Diabetes Count | Fraction Female | Average Age (SD Age) | Average Visits (SD Visits) | Average Time between First and Last Visit (SD Time) |
|---|---|---|---|---|---|---|---|
| Patient-reported Diabetes Status | Yes | 447 | 447 | 0.76 | 62.0 (12.1) | 40.3 (45.4) | 1223.6 (665.3) |
| No | 1,802 | 0 | 0.79 | 48.0 (16.9) | 24.4 (33.6) | 1052.2 (654.6) | |
| eMERGE Case | 204 | 143 | 0.72 | 62.4 (12.3) | 34.8 (36.7) | 1293.6 (568.5) | |
| Case Pool | 670 | 387 | 0.76 | 61.8 (13.0) | 43.3 (45.9) | 1285.1 (520.1) | |
| Excluded + Control | 1,579 | 60 | 0.79 | 46.1 (16.3) | 20.9 (29.7) | 1159.0 (564.9) | |
| General Patient Population | eMERGE Case | 25,310 | n/a | 0.50 | 65.8 (15.2) | 18.7 (29.6) | 902.1 (641.0) |
| Case Pool | 106,569 | n/a | 0.50 | 61.0 (21.3) | 19.0 (32.2) | 848.4 (649.7) | |
| Excluded + Control | 680,324 | n/a | 0.58 | 36.4 (22.8) | 5.8 (11.6) | 677.3 (589.2) |
Table 6:
Prevalence of comorbidities for group of patients identified by the eMERGE DM2 Case algorithm (+eMERGE +Self), groups of patients where the two methods disagree (+eMERGE −Self, −eMERGE +Self), and the group of patients with no identification for diabetes (−eMERGE −Self).
| ICD9 Root Code | Root Code Description | +eMERGE +Self (n= 143) | +eMERGE −Self (n = 61) | −eMERGE +Self (n = 304) | −eMERGE −Self (n = 1,275) |
|---|---|---|---|---|---|
| 250 | Diabetes mellitus | 0.99 | 0.93 | 0.74 | 0.05 |
| 401 | Essential hypertension | 0.86 | 0.85 | 0.79 | 0.34 |
| 272 | Disorders of lipid metabolism | 0.65 | 0.67 | 0.63 | 0.21 |
| 786 | Symptoms involving respiratory system | 0.48 | 0.47 | 0.44 | 0.31 |
| V67 | Follow-up examination | 0.46 | 0.44 | 0.48 | 0.44 |
| V76 | Special screening for malignant neoplasms | 0.46 | 0.43 | 0.54 | 0.30 |
| 724 | Other and unspecified disorders of the back | 0.41 | 0.33 | 0.37 | 0.28 |
| V72 | Special investigations and examinations | 0.39 | 0.39 | 0.49 | 0.47 |
| 789 | Abdominal pain | 0.38 | 0.43 | 0.39 | 0.34 |
| 780 | General Symptoms | 0.36 | 0.43 | 0.40 | 0.28 |
| 719 | Other and unspecified disorders of joint | 0.35 | 0.43 | 0.39 | 0.27 |
| 530 | Diseases of the esophagus | 0.35 | 0.36 | 0.29 | 0.16 |
| 729 | Disorders of the soft tissue | 0.34 | 0.33 | 0.39 | 0.23 |
| 278 | Obesity | 0.33 | 0.43 | 0.40 | 0.21 |
| V04 | Need for prophylactic vaccination and inoculation against single disease | 0.31 | 0.49 | 0.48 | 0.25 |
Figure 1:
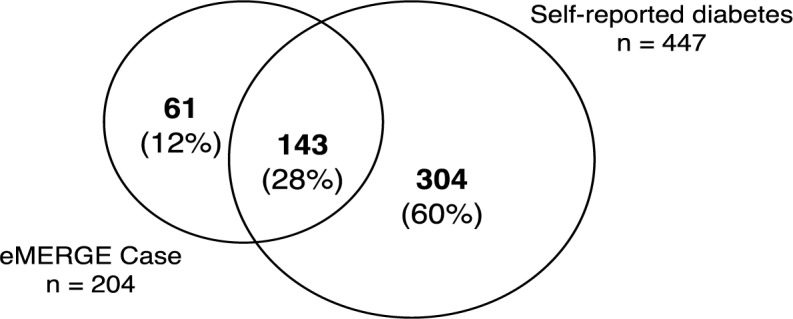
Venn diagram of overlap between patients identified by the eMERGE DM2 Case algorithm and patients self-reporting positive diabetes status.
There were 2,249 WICER Survey participants with self-reported diabetes status who had at least one visit recorded at our institution within the last five years. Table 3 presents summary statistics and demography for patients reporting diabete s and no diabetes. The patients identified by the eMERGE DM2 Case algorithm (eMERGE Case), the pool of potential cases meeting any of the diagnostic, medication, or lab value criteria (Case Pool), and those patients meeting none of the criteria (Excluded) are presented for both the patients with reported diabetes status and the general population. In patients with self-reported status, eMERGE Cases and patients in the Case Pool are, on average, more than 15 years older than the Excluded group, and have twice as many recorded visits. The same difference is more than 24 years in the general patient population, with three times as many recorded visits. Patients with reported status are more likely to be female, as expected, but follow the same trend with regard to age and visits, albeit with 1.8–3.5x as many visits. While patients with reported status do tend to be older than the general population in general (46.1 vs. 36.4), those in the respective Case Pools are approximately the same age (61.8 vs. 61.0).
Table 4 shows the validation statistics against self-reported status. Sensitivity and specificity for the eMERGE phenotyping algorithm were .32 and .97, respectively, while positive predictive value was .70. The highest positive predictive value (.85) was achieved by requiring all criteria (Diagnosis AND Medication AND Lab). This combination also has the highest specificity (.98). While the highest sensitivity (.87) was achieved by the least restrictive combination (Diagnosis OR Medication OR Lab), the sensitivity of the combination requiring all criteria (.55) was still higher than that of the eMERGE algorithm.
Table 4:
Positive predictive value, sensitivity, and specificity for the eMERGE DM2 Case algorithm using only the patients identified by the eMERGE DM2 Control algorithm.
| Set | N | Patient-reported Diabetes Count | Positive PredictiveValue | Sensitivity | Specificity |
|---|---|---|---|---|---|
| eMERGE Case | 204 | 143 | 0.70 | 0.32 | 0.97 |
| Diagnosis | 517 | 369 | 0.71 | 0.83 | 0.92 |
| Medication | 320 | 260 | 0.81 | 0.58 | 0.97 |
| Labs | 549 | 330 | 0.60 | 0.74 | 0.88 |
| Diagnosis AND Medication AND Lab | 291 | 246 | 0.85 | 0.55 | 0.98 |
| Diagnosis OR Medication OR Lab | 670 | 387 | 0.58 | 0.87 | 0.84 |
Validation statistics were also computed for the eMERGE DM2 Case algorithm using only the eMERGE DM2 Control patients for comparison. These results are presented in Table 5. As a pair the DM2 Case and Control algorithms excluded 1,449 patients, reducing the pool of analyzable patients to 800. The majority of self-identified diabetes patients fell into the excluded group, which raised the apparent sensitivity of the eMERGE DM2 Case algorithm to .93. However, the apparent specificity fell to .91.
Table 5:
Positive predictive value, sensitivity, and specificity for the eMERGE DM2 Case algorithm, the component criteria individually (Diagnosis, Medication, Lab), the group of patients meeting all criteria (Diagnosis AND Medication AND Lab), and patients meeting any of the criteria (Diagnosis OR Medication OR Lab). All statistics were calculated against patient-reported diabetes status.
| Set | N | Patient-reported Diabetes Count | Positive Predictive Value | Sensitivity | Specificity |
|---|---|---|---|---|---|
| eMERGE Case | 204 | 143 | 0.70 | 0.93 | 0.91 |
| eMERGE Control | 596 | 11 | n/a | n/a | n/a |
| Excluded | 1449 | 293 | n/a | n/a | n/a |
The 15 most frequent ICD-9 codes for the intersections between the patients satisfying the eMERGE DM2 Case algorithm and the patients with positive self-identified diabetes status (+eMERGE +Self) are presented in Table 6. Codes for groups where the two methods disagreed (+eMERGE −Self, −eMERGE +Self) are presented in the same table as well as codes for the group of patients with no identification for diabetes (−eMERGE −Self). Note that DM1 and DM2 share the same root code (250) and no steps were taken to distinguish between types in this analysis. In general, the rank order of codes by frequency, as well as their general prevalence, is the same for the three diabetic groups regardless of how they were identified. The prevalence for diabetes ICD-9 codes is notably high in these groups. Prevalence for many of these codes is very different from patients without any indication of diabetes. Other comorbidities which are at least twice as prevalent in a diabetes group as in the non-diabetes group are hypertension, high cholesterol, diseases of the esophagus, and obesity. Patients with some identification for diabetes resemble the non-diabetic, general patient population in the prevalence of codes for follow-up examination, special investigations or examinations.
Discussion
The results of the eMERGE DM2 Case algorithm, as well as its component criteria, was validated against all patients with self-reported diabetes status, prompting several points for consideration. We will discuss issues surrounding the generalizability of the patients with self-reported diabetes status to the general patient population, discrepancies between identification from the eMERGE DM2 Case algorithm and the self-reported statuses, and the potential contributions of patient self-reported data to EHR phenotyping.
Patient Comparison and Generalizability
One concern with this dataset is the patients with self-reported diabetes status, those who participated in the WICER Community Survey, are known to differ from the general population in several ways.
The group is older, containing more women, and is mostly Hispanic. However, the portion of these patients with positive indications for diabetes do resemble their counterparts in the general patient population in terms of age, and the relatively increased number of recorded visits, as shown in Table 3. These findings suggest that the characteristics of patients with diabetes do not depend on the population from which they are drawn.
In Table 6, ICD-9 codes for diabetes are the most frequently represented in patients with some identification, either by the eMERGE DM2 Case algorithm or self-report, for diabetes, as expected. However, there are some discrepancies. The relatively lower prevalence of diabetes ICD-9 codes in the portion of self-reporting patients not identified by the eMERGE DM2 Case algorithm may indicate self-report inaccuracies or the effect of missing data in this group. The 5% prevalence of diabetes ICD-9 codes in the group with no identification for diabetes (−eMERGE −Self) may be a result of codes specific for DM1 which were filtered out by the DM2 case algorithm and not in that analysis.
Discrepancies in Identifying Diabetes
The eMERGE DM2 Case algorithm is known to perform well against case review and does achieve very high specificity in this evaluation. The algorithm performs less well in selecting all of the individuals who self-report having diabetes, and this may be for many reasons. First, the case algorithm is restrictive in order to limit the inclusion of DM1 patients. While steps were taken to exclude any patients who obviously had DM1, some of the patients who remain in the pool of potential cases may be rightfully excluded for this reason. Second, the non-selected patients may be incorrect about their diabetes status, though this is probably unlikely as this group of patients resembles the selected patients in patterns of visits and other demographics as well as the presence and frequency of comorbitidies. Moreover, if a large number of patients were in fact incorrect about their diabetes status, we would expect to see more discovered by the control selection algorithm. Lastly, and suggested by Wei, et al., the non-selected patients may be the product of data fragmentation, which is to say they do not have enough of their healthcare data consolidated in our system to allow identification by the eMERGE DM2 Case algorithm. For example, 83% of the self-reporting diabetic patients have at least a ICD-9 code for DM2 in our data warehouse, but at least 60% of those fail to be identified by the eMERGE DM2 Case algorithm for lack of sufficient clinical evidence for that diagnosis.
The more interesting group may be those patients selected by the eMERGE DM2 Case algorithm who do not self-identify as having diabetes. They have met the algorithm’s stringent inclusion criteria, have visit patterns, other demographics, and comorbidities in common with the self-identifying diabetic patients, suggesting by very objective measures that they do have diabetes. That these patients seem to not be aware they have diabetes may have large implications to their treatment, adherence to that treatment, and their engagement with any treatment. Pacheco reported that only approximately half of the patients identified by the eMERGE DM2 algorithm at Northwestern had diabetes as part of the patient’s problem list, further suggesting that this effect is not confined to the patient14.
Contribution of Patient Self-reported Data
There are pros and cons to both EHR data and patient self-reported data (Table 7) which point to how the two data sources might complement each other. EHR data is very heterogenous, with many data types, but that data may have issue such as missingness and inaccuracies that limit their secondary use for research. The more common elements have successfully been used for patient phenotyping algorithms, but that does not necessarily imply the algorithms have high sensitivity. In contrast, patient self-reported data reflects the patient’s perception of their health status and may imply higher patient engagement in treatment, but may also be inaccurate and does not imply there is a useful quantity of clinical data at any one institution.
Table 7:
Pros and cons of EHR and Patient self-report data sources.
| Data Source | ||
|---|---|---|
| EHR | Patient self-report | |
| Pro | Heterogenous data types support high specificity. Common, standardized elements support portability. |
Reflects patient perception. Might imply higher patient engagement. |
| Con | High rate of missingness. May only reflect encounter with a single institution |
Does not imply useful quantity of clinical data. Patient perception may not be clinically accurate. |
The best use of patient self-reported status may be augmenting EHR-based phenotyping algorithms. Phenotyping algorithms like the eMERGE DM2 algorithm typically require multiple criteria for successful identification of a disease and in our study the majority of patients who self-reported positive diabetes status did not have enough data in our system to be selected by the DM2 Case algorithm. Yet, 87% of them did have at least one ICD-9 code, medication order, or lab result to support a diagnosis of diabetes. If patient self-reported status could be standardized and used in addition to commonly captured EHR data elements for phenoyping algorithms, our study suggests the number of patients identified by such algorithms could be greatly increased.
This recommendation comes with two caveats, however. First, the contribution of patient self-reported status to phenotyping algorithms for research will depend on the needs of that research. If clinical data are important, as in a retrospective observational study, then patients who cannot be identified from their data alone may not be useful. Approaches such as the eMERGE DM2 Case algorithm would therefore be the best way to identify meaningful cases within a data source. On the other, if the goal is to simply identify as many patients with a disease or status as possible, for a potential prospective study or a GWAS, then self-reported data would be a valuable addition.
The second caveat is the issue of standardization. The portability of phenotyping algorithms relies on the use of common and standardized EHR data elements, such as ICD-9 codes. If the source of patient self-reported disease status is not standardized down to the exact wording of the question being answered, then the results may not be comparable and the resulting algorithm may not be portable. For example, the source of patient self-reported diabetes status in our study did not distinguish between DM1 and DM2. While steps were taken to address this limitation, the exact results of this study would probably be different if the survey question had specifically addressed DM2 alone. Therefore, any potential phenotyping algorithm built using our data might not perform the same on a data source with a patient self-reported data source specific to DM2.
Limitations
This study has several limitations. First, relatively few people were surveyed compared to the size of the large volume of patients in the EHRs. While the patients with self-reported status do appear to resemble identified cases from the general patient population, the population taking the WICER Community Survey is known to be older, and contain a higher proportion of women and Hispanic individuals. Weighting approaches exist which could be used to approximate the expected census distribution. These approaches were not used for two reasons. First, our prior research suggests the differences in measured variables are not large15. Second, the purpose of this paper was to explore the performance of the algorithm and we wished to leave its operation as transparent as possible. An additional limitation is that the WICER Community Survey does not distinguish between DM1 and DM2. While obvious DM1 cases were removed from the dataset, it is unknown what percentage of the remaining patients may have DM1.
Conclusions
There are pros and cons in both EHR data and patient self-reported health data. Phenotyping algorithms typically require multiple criteria for successful disease identification and may miss many patients with the disease in question. Likewise, self-reported health data does not imply sufficient EHR data to support a clinical diagnosis. If patient self-reported status could be used in addition to commonly captured EHR data elements for phenotyping algorithms, our study suggests the number of patients identified by such algorithms could be greatly increased.
References
- 1.A First Look at the Volume and Cost of Comparative Effectiveness Research in the United States. Academy Health; 2009. [DOI] [PubMed] [Google Scholar]
- 2.McCarty CA, Chisholm RL, Chute CG, Kullo IJ, Jarvik GP, Larson EB, Li R, Masys DR, Ritchie MD, Roden DM, Struewing JP, Wolf WA, e, Merge Team The eMERGE Network: a consortium of biorepositories linked to electronic medical records data for conducting genomic studies. BMC Med Genomics. 2011;4:13. doi: 10.1186/1755-8794-4-13. [DOI] [PMC free article] [PubMed] [Google Scholar]
- 3.Kho AN, Hayes MG, Rasmussen-Torvik L, Pacheco JA, Thompson WK, Armstrong LL, Denny JC, Peissig PL, Miller AW, Wei WQ, Bielinski SJ, Chute CG, Leibson CL, Jarvik GP, Crosslin DR, Carlson CS, Newton KM, Wolf WA, Chisholm RL, Lowe WL. Use of diverse electronic medical record systems to identify genetic risk for type 2 diabetes within a genome-wide association study. J Am Med Inform Assoc. 2012;19(2):212–218. doi: 10.1136/amiajnl-2011-000439. [DOI] [PMC free article] [PubMed] [Google Scholar]
- 4.Pacheco J, Thompson W. Type 2 Diabetes Mellitus. 2012. from http://phenotype.mc.vanderbilt.edu/phenotype/type-2-diabetes-mellitus.
- 5.Wei WQ, Leibson CL, Ransom JE, Kho AN, Caraballo PJ, Chai HS, Yawn BP, Pacheco JA, Chute CG. Impact of data fragmentation across healthcare centers on the accuracy of a high-throughput clinical phenotyping algorithm for specifying subjects with type 2 diabetes mellitus. J Am Med Inform Assoc. 2012;19(2):219–224. doi: 10.1136/amiajnl-2011-000597. [DOI] [PMC free article] [PubMed] [Google Scholar]
- 6.Richesson RL, Rusincovitch SA, Wixted D, Batch BC, Feinglos MN, Miranda ML, Hammond WE, Califf RM, Spratt SE. A comparison of phenotype definitions for diabetes mellitus. J Am Med Inform Assoc. 2013;20(e2):e319–326. doi: 10.1136/amiajnl-2013-001952. [DOI] [PMC free article] [PubMed] [Google Scholar]
- 7.Palepu Prakruthi R, Brown Catherine, Joshi Gautam, Epsin-Garcia Osvaldo, Eng Lawson, Ramanna Jayalakshmi, Hon Henrique, Momin Salma, Pringle Dan, Cuffe Sinead, Waddell Thomas K, Keshavjee Shaf, Darling Gail Elizabeth, Yasufuku Kazuhiro, de Perrot Marc, Pierre Andrew, Cypel Marcelo, Xu Wei, Liu Geoffrey. Assessment of accuracy of data obtained from patient-reported questionnaire (PRQ) compared to electronic patient records (EPR) in patients with lung cancer. ASCO Meeting Abstracts. 2013;31(31_suppl):40. [Google Scholar]
- 8.Kriegsman DM, Penninx BW, van Eijk JT, Boeke AJ, Deeg DJ. Self-reports and general practitioner information on the presence of chronic diseases in community dwelling elderly. A study on the accuracy of patients’ self-reports and on determinants of inaccuracy. J Clin Epidemiol. 1996;49(12):1407–1417. doi: 10.1016/s0895-4356(96)00274-0. [DOI] [PubMed] [Google Scholar]
- 9.Martin LM, Leff M, Calonge N, Garrett C, Nelson DE. Validation of self-reported chronic conditions and health services in a managed care population. Am J Prev Med. 2000;18(3):215–218. doi: 10.1016/s0749-3797(99)00158-0. [DOI] [PubMed] [Google Scholar]
- 10.Okura Y, Urban LH, Mahoney DW, Jacobsen SJ, Rodeheffer RJ. Agreement between self-report questionnaires and medical record data was substantial for diabetes, hypertension, myocardial infarction and stroke but not for heart failure. J Clin Epidemiol. 2004;57(10):1096–1103. doi: 10.1016/j.jclinepi.2004.04.005. [DOI] [PubMed] [Google Scholar]
- 11.Pacheco JA, Avila PC, Thompson JA, Law M, Quraishi JA, Greiman AK, Just EM, Kho A. A highly specific algorithm for identifying asthma cases and controls for genome-wide association studies. AMIA Annu Symp Proc. 2009;2009:497–501. [PMC free article] [PubMed] [Google Scholar]
- 12.Sciortino S, Walter L, Ranatunga D, Ludwig D, Schaefer C, Kay J, Jorgenson E. PS3-14: CREX: Utility of a Computerized Methodology to Identify Health Conditions Using EMR for GWAS, in the Kaiser Permanente Research Program on Genes, Environment, and Health. Clinical Medicine and Research. 2013;11(3):149. [Google Scholar]
- 13.WICER: Washington Heights/Inwood Informatics Infrastructure for Community-Centerede Comparative Effectiveness Research. from http://www.wicer.org.
- 14.Pacheco JA, Thompson W, Kho A. Automatically detecting problem list omissions of type 2 diabetes cases using electronic medical records. AMIA Annu Symp Proc. 2011;2011:1062–1069. [PMC free article] [PubMed] [Google Scholar]
- 15.Fort D, Weng C, Bakken S, Wilcox A. Considerations for Using Research Data to Verify Clinical Data Accuracy; Proceedings of the 2014 Summit on Translational Bioinformatics; 2014. [PMC free article] [PubMed] [Google Scholar]