

Abstract
The sparse cells that are shed from tumors into peripheral circulation are an increasingly promising resource for noninvasive monitoring of cancer progression, early diagnosis of disease, and serve as a tool for improving our understanding of cancer metastasis. However, the extremely sparse concentration of circulating tumor cells (CTCs) in blood (~1–100 CTC in 7.5 mL of blood) as well as their heterogeneous biomarker expression has limited their detection using conventional laboratory techniques. To overcome these challenges, we have developed a microfluidic chip-based micro-Hall detector (μHD), which can directly measure single, immunomagnetically tagged cells in whole blood. The μHD can detect individual cells even in the presence of vast numbers of blood cells and unbound reactants, and does not require any washing or purification steps. Furthermore, this cost-effective, single-cell analytical technique is well suited for miniaturization into a mobile platform for low-cost point-of-care use. In this chapter, we describe the methodology used to design, fabricate, and apply these chips to cancer diagnostics.
Keywords: Hybrid microfluidic, Microelectronic chips, BioMEMS, Sensors, Microfluidics, Magnetic nanomaterials
1 Introduction
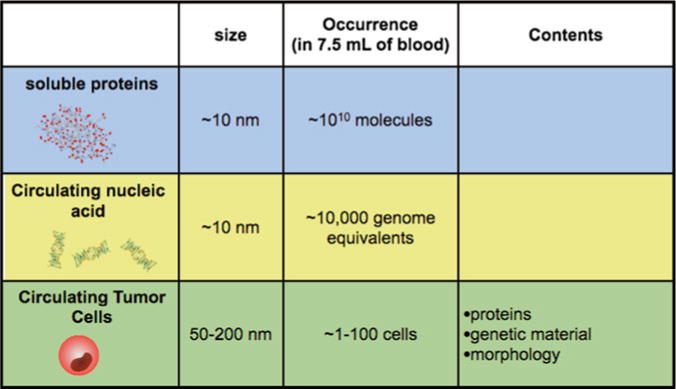
Tumor cells are often localized in difficult to access parts of the body, making molecular diagnostics on cancer cells reliant on invasive procedures. The analyses of the sparse molecular markers that are shed from tumor cells into peripheral circulation have great potential to address this challenge [1]. These markers, including soluble proteins and nucleic acids [2, 3] as well as circulating tumor cells (CTCs) [1] (Table 1), have been shown to contain valuable information on the molecular state of the cancer that can be used for disease diagnostics and monitoring [1, 4, 5].
Table 1.
Comparison of soluble proteins, circulating nucleic acid, and circulating tumor cells (CTCs) for cancer monitoring
|
Engineers have devised many ingenious strategies to isolate and measure both rare CTCs and sparse soluble molecules in blood. However, fundamental technical challenges of these detection modalities have impeded their clinical application. The detection of soluble protein based biomarkers, such as prostate specific a ntigen (PSA), has been limited by issues of specificity [6]. Because the biogenesis of soluble protein found in blood cannot be determined, diagnostics based on protein detection suffer from high false-positive rates. Circulating genetic material can have improved specificity to proteins, but are limited by low concentrations due to their short half-life in the blood (~10 min) [2].
Circulating tumor cells (CTCs) carry with them a great deal of information about the cancer that they come from—protein expression, RNA expression, mutations—and as such their biogenesis can be determined with high specificity [1]. Additionally, because each CTC carries with it multiple biomarkers, their measurement allows cellular heterogeneity to be resolved and thus reveals a richer picture of the molecular state of the cancer than is not possible with soluble protein detection [1, 7, 8]. However, using conventional techniques, the detection of CTCs has been limited by their sparse concentrations in blood (~1–100 CTC in 7.5 mL of blood), resulting in long run-times, excessive consumption of valuable clinical samples, and Poisson counting error [1].
A promising methodology to overcome these challenges is immunomagnetic detection, in which molecular biomarkers identifying CTCs are labeled using magnetic particles. The inherently negligible magnetic susceptibility of biological material enables CTCs to be isolated and detected with little interference from the complex background regardless of pH, salinity, or turbidity. High-contrast detection can thus be performed with minimum sample preparation and short incubation times, which avoids sample loss and simplifies clinical use. Furthermore, magnetic sensing and sorting is amenable to miniaturization and integration into monolithic chips for portable use [9].
We harness the small feature size and high sensitivity of microelectronics and combine it with the biocompatibility of microfluidics to create a highly sensitive and miniaturized diagnostic (Fig. 1a). Our proposed design consists of an array of sensors fabricated on a semiconductor substrate with a microfluidic network built directly on top of it (Fig. 1b). The microfluidics serve as an interface between the sensors and the sample, preparing the complex sample for measurement and guiding potential CTCs over the array of sensors for detection. Because the chip detects cells individually, it is able to ignore biological objects with inadvertently attached MNPs using software-defined gating, as is done in fluorescence flow cytometry.
Fig. 1.
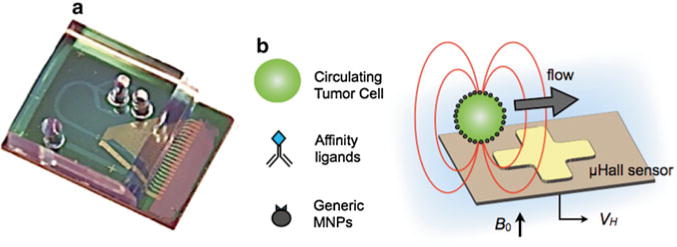
Summary of our detection method. (a) Our hybrid chip consists of a GaAs substrate with microfabricated Hall sensors. Built directly on top of the semiconductor chip is a microfluidic network to controllably deliver cells to the sensors. The microfluidics are fabricated using soft-lithography and are permanently bonded to the GaAs. (b) Circulating tumor cells are magnetically labeled based on a panel of relevant cancer biomarkers (EGFR, HER2/neu, etc.) and magnetic nanoparticles (MNPs). The cells are passed one-by-one via hydrodynamic flow structures over μHall sensors for highly sensitive detection
Additionally, the chip can ignore unbound MNPs, eliminating the need to wash away unbound reagents [10]. The μHall sensors measure the magnetic moment arising from a very small volume (~10 pL) directly above the sensor. In an unwashed sample containing a particle concentration of 108/mL, there is on average less than 1 unbound MNP in the detection volume at any given time. Targeted tumor cells, in contrast, can have 105–107 MNPs per cell, creating a much larger signal than the background.
Our micro-Hall Detector (μHD) was specifically designed to detect magnetically labeled cellular targets. On our chip, cells that have been labeled with MNPs are magnetized with an external permanent magnet, and assume a magnetic moment m. The magnetic moment of each cell m is directly proportional to both the number of biomarkers on the cell N and the magnetic moment of the MNPs mp (m = N × mp). The demagnetization field of each individual cell is measured as it passes over an array microfabricated Hall sensors (Fig. 1b). The total number of biomarkers N for each cell can thus be calculated by the measurement of the demagnetization field from individual cells as they are delivered one-by-one by a microfluidic network built over the micro-Hall sensors.
Magnetic sensors based on both the giant magnetoresistance (GMR) and the Hall effect have been developed to sensitively detect magnetically labeled biomarkers in complex biological media. The Hall effect refers to the production of a voltage VH = RH × I × B⊥ across an electrical conductor proportional to the magnetic field normal to the plane of the conductor B⊥, its bias current I, and its characteristic Hall resistance RH [11]. Sensors that use GMR have inherently greater sensitivity than the Hall effect at low fields [12]. However, due to the nonlinear response of GMR, these sensors saturate at large fields (B > 0.01 T). We selected the Hall effect for cell detection, rather than magnetoresistance because it allows us to apply the large magnetic fields (B > 0.1T) necessary to fully magnetize the superparamagnetic MNPs [13], without saturating the sensors. Additionally, due to the linear response of the μHall sensors, cells with nonspecifically bound MNPs can be accurately excluded by gating the measured signals above a particular threshold value. Additionally, Hall sensors are fully compatible with standard semiconductor processing, which enables low-cost production and integration with auxiliary electronics onto a monolithic chip. Because of this integration, the entire detection system can be realized as a self-contained, cost-effective lab-on-chip for mobile health applications.
The detection of rare cells using magnetic nanomaterials and micro-Hall detectors is particularly well suited for mobile diagnostics. Because the diagnostic is fully automated and the sample requires minimal processing, it can be used in practical clinical environments by minimally trained personnel. Additionally, because the chip uses sensors built on semiconductor substrates with electronic output, the chip can be easily interfaced with mobile devices for remote clinical data sharing and epidemiological surveillance [10, 14]. The microchip’s input is a raw clinical sample and its output is quantitative, electronic data that can be immediately transmitted, shared, and stored [4, 15].
We have described in two recent papers the development of these μHall chips for the detection of CTCs [4] and bacteria [15]. In the sections below, we focus with greater depth than has previously been published on the methodology used to design and fabricate these chips.
2 Materials
2.1 μHall Chip Farbrication
The sensors were built on a pseudomorphic high electron mobility GaAs wafer using standard semiconductor processing (Fig. 2a). A mesa was etched onto the GaAs wafer heterostructure (Fig. 2b). The mesa was defined using photolithography and followed by an anisotropic reactive ion etch. Electrodes were photolithographically patterned and metal layers were deposited in the following order: Nickel/Ni (50 Å), Gold/Au (50 Å), Germanium/Ge (250 Å), Au (400 Å), Ni (100 Å), and Au (400 Å) (Fig. 2c). To make ohmic contact to the two-dimensional electron gas, an eutectic alloy was formed. To create this alloy, the electrodes were subsequently annealed at 480°C for 90 s using a rapid thermal annealer (Fig. 2d). The Hall sensors were protected from the biological solutions using three layers of oxide. The first layer was Al2O3 layer (30 nm) grown by atomic layer deposition (ALD) to ensure conformal coverage (Fig. 2e). Next, a Si3N4 layer (100 nm) was grown by chemical vapor deposition (CVD) to protect against the diffusion of ions. Finally, an SiO2 layer (100 nm) was grown by CVD to form a layer that could be activated to make a permanent bond with the PDMS microfluidics (Fig. 2f).
Fig. 2.
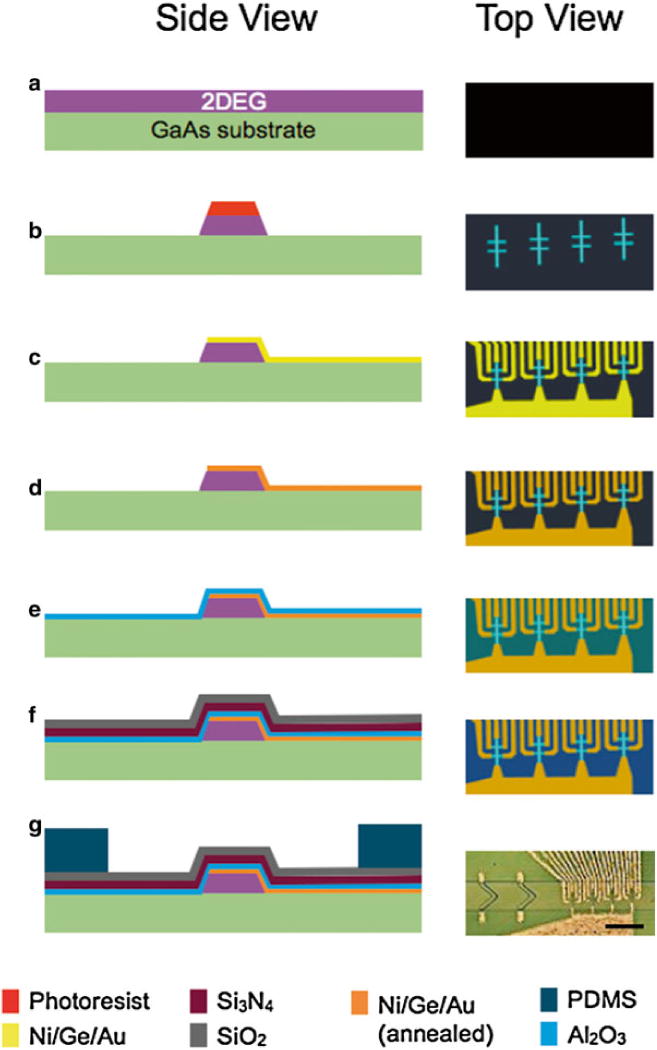
Summary of our fabrication method. The cartoons on the left are side-view schematics of the chip in the various stages of the fabrication (a–g). The images on the right are schematics of the top-view. (g) A micrograph of the finished micro-Hall chip. The scale bar is 250 μm. (h) A cross-sectional schematic of the instrumentation that connect to the μHall chip (i) A photograph of the slot-connector/magnet holder, where the μHD chip sits. A shielded ribbon cable connects the output of the μHD to the custom printed circuit board
The PDMS based microfluidics were fabricated using soft lithography. A two layer SU-8 (MicroChem) mold was fabricated with two-step photolithography. The PDMS was poured onto the mold and cured at 65°C for 3 h. The PDMS microfluidics and GaAs chip were treated with O2 plasma, aligned using a modified mask aligner (ABM), and then permanently bonded (Fig. 2g).
2.2 Electronics
We electrically characterized the bandwidth, noise, and sensitivity of the μHall sensors that we fabricated. The magnetic field sensitivity of the Hall sensors (78 Ω/T) was measured using a known magnetic field. The magnetic field was created using a water cooled electromagnet (HV-4H, Walker LDJ Scientific) and was independently measured using a commercial magnetometer (THM 7025, MetroLab) (Fig. 3a). The bandwidth 150 MHz and input-referred noise 1.3 nV/√Hz were measured with a spectrum analyzer (Fig. 3b).
Fig. 3.
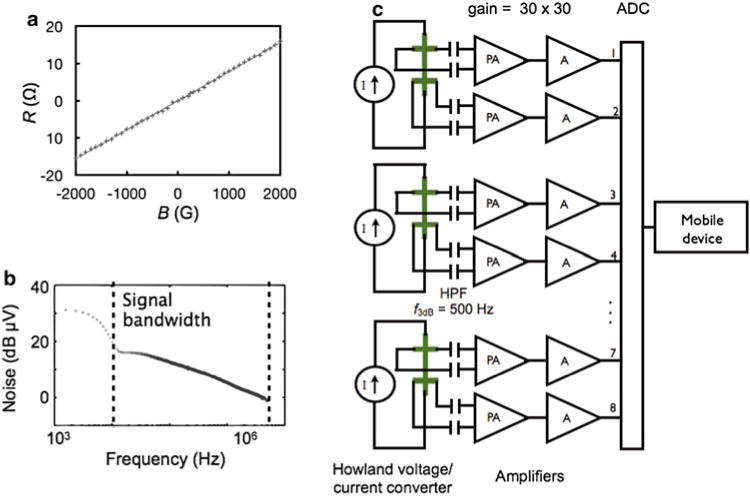
Electronics to process the micro-Hall signal. (a) The hall resistance R was measured versus the applied magnetic field B, and a sensitivity of 78 Ω/T was calculated. (b) The input-referred noise of the μHall sensors as measured with a spectrum analyzer. (c) A schematic of the electronics to condition the μHall signal prior to software analysis. Each pair of μHall sensors are driven with a current source. The differential output of each μHall sensor is AC coupled to a two-stage amplifier (gain = 30 × 30) before analog-to-digital conversion ADC. Once digitized the signal is sent to either a computer or mobile device for software analysis
The μHall sensors were connected to custom electronics that drive the μHall sensors and condition their output before they are sent to a mobile device or computer for analysis. The electronic scheme to read out the μHall sensors is shown in Fig. 3c. Howland voltage to current converters were used to bias the Hall sensors with a current from −10 to 10 mA. The Hall sensors were AC coupled to the preamplifier through a high pass filter, with a cutoff frequency of ƒ3dB = 500 Hz. AC coupling allows the large signal that arises from the static field (B ~ 0.5T) be completely removed, such that the much smaller signal that arises from a passing cell to be resolved. The preamplifier and amplifier (THS4131, Texas Instruments) had a gain of 30 × 30 (900). The conditioned signal was digitized (PCI6133, National Instruments) and sent to either a computer or a mobile device for digital analysis. The chip fits into a slot connector, which holds a 2″ diameter, 1″ thick NdFeB magnet underneath it (K and J magnets) (Fig. 2h, i).
While the μHD was designed with mobile diagnostics in mind, several improvements to the peripheral instrumentation are needed to make the platform fully mobile. One important design choice for the μHD, which make it well suited for mobile applications, is that it only requires a single source of negative pressure (at the outlet). Because this pressure source does not need to be stable, since the flow focusing is sensitive only to the relative velocities between the sheath and sample flow, the flow can be driven by an inexpensive spring-loaded syringe or vacuum pack [16]. Additionally, rather than the PCI card based analog-to-digital-converted used in this demonstration, a USB based platform would allow the PC used in this study to be replaced with a tablet or smartphone. In previous work, we demonstrated that a similar device could be interfaced with an iPhone and an iPad using a custom programmed app [14].
2.3 Magnetic Nanomaterials
The μHD is designed to detect magnetically labeled cellular targets. By targeting cells with MNPs and subjecting them to an external magnetic field B, each cell acquired a magnetic moment m that is directly proportional to both the number of biomarkers N and the magnetic moment of the MNPs mp (m = N × mp). The induced magnetic fields of these cells are then measured using the microfabricated Hall sensors.
To efficiently label cellular biomarkers with MNPs, we used a two-step bio-orthogonal procedure that is based on the cycloaddition between a 1,2,4,5-tetrazine (Tz) and a trans-cyclooctene (TCO) [17]. In this approach, cells were first targeted with TCO-conjugated antibodies. Once bound to their cellular targets, the TCO antibodies then acted as scaffolds onto which multiple Tz-modified MNPs could be coupled. This technique results in much higher (>300 %) nanoparticle loading onto target cells (~106 MNPs per cell) than direct antibody–MNP conjugates [17].
Amine-terminated, cross-linked iron oxides (CLIOs) were prepared as described previously [17]. These CLIOs nanoparticles have a core size of 7 nm and a hydrodynamic diameter of 30 nm. Modification with 2,5-dioxopyrrolidin-1-yl 5-(4-(1,2,4,5-tetrazin-3-yl)benzylamino)-5-oxopentanoate (TZ-NHS) create CLIO-TZ. Briefly, excess TZ-NHS was reacted with amino-CLIO in phosphate-buffered saline (PBS) containing 0.1 M sodium bicarbonate, for 3 h at room temperature. TZ-CLIO was purified using Sephadex G-50 columns (GE Healthcare).
Antibodies were modified with (E)-cyclooct-4-enyl 2,5-dioxopyrrolidin-1-yl carbonate (TCO-NHS) as previously reported [2]. Briefly, purified antibody was reacted with TCO-NHS in 10 % dimethylformamide for 3 h at room temperature. TCO-conjugated antibodies were subsequently buffer-exchanged into PBS and their concentrations determined by absorbance measurements. The following monoclonal antibodies were modified with TCO: Herceptin (anti-HER2/neu), Cetuximab (anti-EGFR), anti-EpCAM (R&D Systems), and anti-Mucin-1 (Fitzgerald Industries).
The sample was labeled with TCO-conjugated antibodies (10 μg/mL) in PBS with 0.5 % bovine serum albumin (BSA, Sigma) for 45 min at 4°C. Following washing and centrifugation, cells were labeled with CLIO-TZ at room temperature for 30 min. The sample was subsequently measured using the μHD sensor.
2.4 List of Materials
Here, we list the materials used in the construction of the μHD. The list is organized into the following sections: micro-Hall (μHall) chip, magnetic labeling reagents, and auxiliary electronics.
2.4.1 μHall Chip
Substrate: epitaxially grown pseudomorphic high-electron mobility transistor (PHEMT) GaAs (IntelliEpi).
Metals: Ni, Au, Ge.
Photoresists: SU-8 2000 (Microchem), Shipley 1813 (Microchem).
Poly(dimethylsiloxane) (PDMS) (KR Anderson Company, Sylgard/Elastomer Kit). (All fabrication performed at Harvard Center for Nanoscale Systems).
2″ × 2″ × 1″ NdFeB magnet (K and J).
2.4.2 Magnetic Labeling
Cross-linked iron oxide nanoparticles: Courtesy of N. Sergeyev, Center for Systems Biology, Massachusetts General Hospital [17]. The particles were modified with 2,5-dioxopyrrolidin-1-yl 5-(4-(1,2,4,5-tetrazin-3-yl)benzylamino)-5-oxopentanoate (TZ-NHS) to create CLIO-TZ.
The following monoclonal antibodies were modified with TCO: Herceptin (anti-HER2/neu), Cetuximab (anti-EGFR), anti-EpCAM (R&D Systems), and anti-Mucin-1 (Fitzgerald Industries).
2.4.3 Auxiliary Electronics
Custom printed circuit board (described in Subheading 2.2).
Power supply, 12 V, 100 mA.
National Instruments Analog to Digital Converter (NI-PCI-633).
USB cable.
Computer, tablet, or smartphone.
2.4.4 Auxiliary Fluidics
Syringe pump (Braintree Scientific).
Tygon non-DEHP microbore tubing, 0.020″ × 0.060″OD (Cole Parmer).
3 Methods
3.1 Finite Element Simulations: Magnetic
To aid in the design and characterization of our microfabricated Hall sensors, we constructed a numerical model to describe the spatial response of the sensors to magnetically labeled cells (Matlab). The model treats each cell as a magnetic dipole moment mtot located at the center of the cell, aligned with the external magnetic field in the z direction (Fig. 4a). The Hall voltage (VH = I × RH × B⊥), where I is the input current to the sensor and RH is the characteristic Hall resistance of the device, is calculated by analytically solving for the demagnetization field B, and averaging B⊥ over the sensing area of the Hall element. This numerical model was used to determine the optimum sensor size that maximizes signal-to-noise ratio (SNR) (Fig. 4b). We found that for cells with an average diameter of 12 μm, the SNR was maximal when the sensors had a detection area similar to that of the cells (8 × 8 μm2).
Fig. 4.
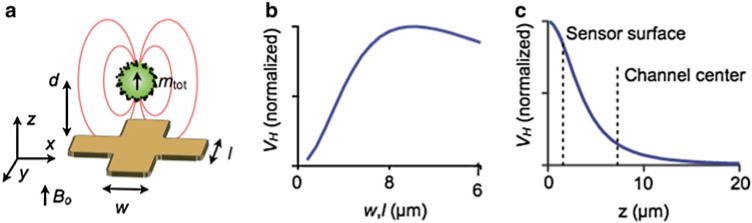
Summary of our detection method. (a) A computer model was used to design and optimize the μHall chip. The software calculates the magnetic field B⊥ normal to the chip’s surface, which is produced by a magnetic dipole at a specific position (x y z). (b) VH is a function of the sensor size (w, l) for a magnetic dipole at a height d = 4 μm above the chip surface. (c) Simulation of the normalized VH as a function of the height of a magnetic dipole at (x y) = (0, 0). The signal strength was found to decay rapidly with distance (~ d−3) from the sensor surface
The spatial response of the Hall voltage VH was also simulated. As the dipole was moved away from the sensor surface, the VH signal steeply declined (Vh αd−3) (Fig. 4c) Our numerical simulation showed that the VH was >100-fold larger for a cell brought to the sensor surface (d = 4 μm) than for a cell placed at the center of the microfluidic channel (d = 7.5 μm), thus motivating accurate positioning of the cell to the bottom of the channel with hydrodynamic focusing.
3.2 Finite Element Simulations: Fluidic
To controllably stream cells over the μHall sensors, we design a two-stage flow focusing structure (Fig. 5a). Cells are directed laterally towards the center of the fluid channel via coplanar sheath flows. Cells are pushed vertically toward the bottom of the channel using hydrodynamic forces generated with Chevron patterned cut-out of the roof of the channel. The physical channel was 500 μm wide and 30 μm high, and designed to operate under very large flow rates (φ ~ 1 mL/h). The use of hydrodynamic focusing allows the physical channel to be much larger than the cells, which in turn lowers the fluidic resistance and reduce the risk of channel clogging.
Fig. 5.
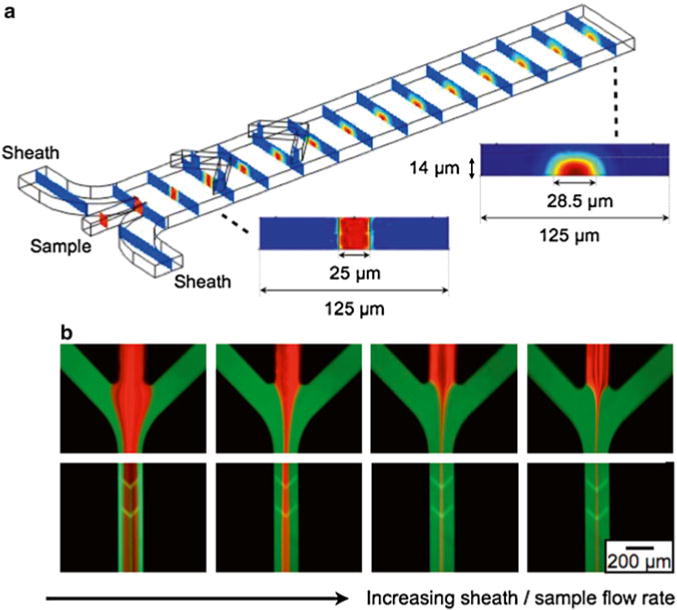
To enhance the μHall signal, a hydrodynamic focusing structure was used to bring individual cells close to the μHall sensors. Cells entering the chip though the sample input are pushed towards the center of the channel by the lateral sheaths and are pushed vertically to the bottom of the channel by the chevron patterns. (a) The results of a finite element computer simulation. The sheath fluid is colored blue and the sample fluid in colored red. (b) Fluorescence micrographs, demonstrating flow focusing. The sheath fluid was labeled with fluorescein and the sample was labeled with rhodamine. As the sheath/sample flow rate ratio increased, the sample flow was focused to an increasingly narrow region in the center of the chip
To design this two-stage flow focusing structure we utilized an iterative finite element analysis (Comsol). A cross section of the microfluidic channel after lateral flow focusing is plotted (Fig. 5a, inset). The sample, which includes the cells, is focused laterally towards the center of the channel. After the chevron pattern the sample is pushed vertically towards the bottom of the channel (Fig. 5a, inset). The initial design for the chevron pattern was modeled after a previously reported design [18]. We modified this design for our application by including chevrons only on the top of the channel rather than on the top and bottom as was previously done. In this way, our chip drives cells to the bottom of the channel rather than towards the center as was done by Howell et al.
After a process of iterative simulation and redesign, which led to a design that brought the cells to the bottom-center of the channel, experimental verification was done. The device was built using standard two-layer SU-8 soft lithography. The sample flow was stained red with rhodamine and the sheath flow green with fluorescein, and flow was analyzed using a fluorescence microscope (Fig. 5b). As the sheath flow rate increased relative to the sample flow rate, the width of sample stream decreased. The ratio of the flow rate between the sheath flow and the sample streams was controlled using gravitational flow, with negative pressure provided by a syringe pump on the output (BS8000, Braintree Scientific). Typical total flow rates were 0.1–1 mL/h.
3.3 Circulating Tumor Cell Detection
o demonstrate clinical use of the μHall chip, we detected rare circulating tumor cells (CTCs) in whole blood. We conducted a small study on a cohort of ovarian cancer patients (n = 20). Each of the patients selected had advanced disease (Stage IIIc or IV), such that we expected to find CTCs in each of their blood samples. As a negative control, blood samples were obtained from healthy volunteers (n = 15). To measure the performance of the μHall chip, we directly compared its results against the clinical gold standard, the CellSearch system.
Each patient sample we divided into two aliquots. One aliquot was magnetically labeled for a panel of four markers (EpCAM, HER2/neu, EGFR, and MUC1) and measured using the μHD (Fig. 6a). The use of a panel of biomarkers enables a heterogeneous population of CTCs to be labeled, including those that may have gone through an epithelial–mesenchymal transition and do not express EpCAM [19]. The other aliquot was measured using CellSearch. CA-125, a clinical biomarker for ovarian cancer, was also measured for each patient. The average CA-125 level for each of the cancer patients was 640 U/mL (with a range of 141–1,142 U/mL), whereas a level for a healthy patient is 35 U/mL. In addition to the n = 20 ovarian cancer patients, blood samples from n = 15 healthy volunteers were also measured as a negative control.
Fig. 6.

Circulating tumor detection on a μHall chip. (a) The μHall chip was used to detect CTCs in blood samples from patients with late stage ovarian cancer. Samples were magnetically labeled using four known cancer biomarkers: EpCAM, HER2/neu, EGFR, and MUC1. (b) Patient samples (n = 20) were split into two and profiled using both the μHall chip (top) and CellSearch (bottom). (c) Additionally, n = 15 healthy controls were screened by the μHD. The mean values of cell counts are shown as a dashed line. (d) A receiver operating curve (ROC) for the μHD was generated from the data in (c)
Figure 6b compares CTC counts reported by the μHall Chip and by CellSearch for each patient (n = 20). CellSearch detected CTCs in only 5 of 20 ovarian cancer cases, resulting in a diagnostic accuracy of 25 %. The μHall chip counted more CTCs in every patient, and the cell counts were greater for patients with either advanced disease who were no longer undergoing therapy or with aggressive cancer types [4]. The μHall chip successfully identified CTCs in 100 % of patients with evidence of clinical progression or stage IV disease, where only 18 % of cases were detected with CellSearch. Samples from patients with cancer showed significantly higher number of CTC counts than the control group (P < 0.01, two-tailed t-test) with wide margins (Fig. 6c). We constructed a receiver operating characteristic (ROC) curve using the micro-Hall chip results from 20 patient and 15 healthy volunteers (Fig. 6d) [4]. Cutoff values were determined with input from control cohort data. The diagnostic accuracy of the mHD reached 94%.
3.4 Drug Response Measurements
In addition to the detection of cancer via the enumeration of rare tumor cells in blood, the μHall chip can also be used to sensitively measure biomarker expression on individual cells. This ability allows the μHall chip to profile biomarker expression on samples with limited cell numbers, such as fine needle aspirates (FNAs), for applications such as the monitoring of disease progression during treatment. The single cell measurements enabled by the μHall chip obviate the need for separate experiments to normalize against an independent cell count. To demonstrate this capability, we used the μHall chip to monitor drug treatment efficacy on human A431 epidermoid cancer cells xenografted onto mice. Tumor samples were obtained through fine-needle aspiration (~1,800 tumor cells per aspirate). The aspirates were then labeled with EGFR-specific MNPs and processed for micro-Hall measurement (Fig. 7a).
Fig. 7.
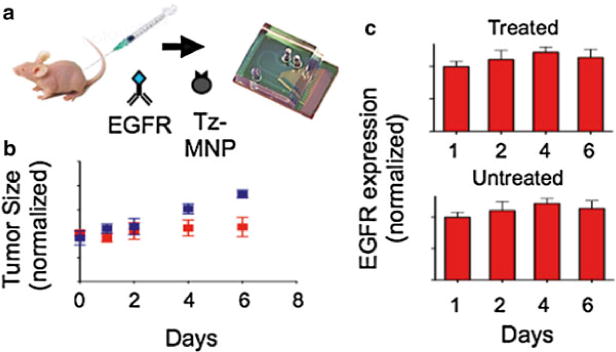
Molecular analysis of fine needle aspirates on a μHall chip. (a) The μHall chip was used to profile EGFR expression of cells obtained by fine needle aspirate from mice with a xenografted tumor. Mice bearing xenografted tumors were treated with geldanamycin for 6 days or left untreated (n = 6 per group). (b) Rate of tumor growth in untreated mice and mice treated with geldanamycin. The blue and red data points represent untreated and treated mice, respectively. (c) Tumor samples were screened by the μHall chip to monitor the changes in EGFR expression over the course of the drug treatment (Color figure online)
For a proof-of-concept experiment, three mice with xenografted tumors received treatment with geldanamycin, a heat shock protein 90 (HSP90) inhibitor. As a negative control, three mice received saline. Geldanamycin has been shown to decrease the expression of growth factor receptors by promoting their degradation. As time progressed, the tumor size of the treated mice decreased and the tumor size of the untreated continued to grow (Fig. 7b). With the micro-Hall chip, we observed a progressive decrease in EGFR expression in tumor cells from the treatment group (P < 0.05, two-tailed t-test), whereas the expression level of EGFR remained unchanged in untreated mice (Fig. 7c). The μHD could therefore be used for minimally invasive longitudinal treatment monitoring because it reports biomarker expression per cell in a small number of cells.
References
- 1.Lang JM, Casavant BP, Beebe DJ. Circulating tumor cells: getting more from less. Sci Transl Med. 2012;4:141ps13. doi: 10.1126/scitranslmed.3004261. [DOI] [PubMed] [Google Scholar]
- 2.Wang G-K, Zhu J-Q, Zhang J-T, Li Q, Li Y, He J, Qin Y-W, Jing Q. Circulating microRNA: a novel potential biomarker for early diagnosis of acute myocardial infarction in humans. Eur Heart J. 2010;31:659–666. doi: 10.1093/eurheartj/ehq013. [DOI] [PubMed] [Google Scholar]
- 3.Alix-Panabieres C, Schwarzenbach H, Pantel K. Circulating tumor cells and circulating tumor DNA. Annu Rev Med. 2012;63:199–215. doi: 10.1146/annurev-med-062310-094219. [DOI] [PubMed] [Google Scholar]
- 4.Issadore D, Chung J, Shao H, Liong M, Ghazani AA, Castro CM, Weissleder R, Lee H. Ultrasensitive clinical enumeration of rare cells ex vivo using a micro-hall detector. Sci Transl Med. 2012;4:141ra92. doi: 10.1126/scitranslmed.3003747. [DOI] [PMC free article] [PubMed] [Google Scholar]
- 5.Nagrath S, Sequist LV, Maheswaran S, Bell DW, Irimia D, Ulkus L, Smith MR, Kwak EL, Digumarthy S, Muzikansky A, Ryan P, Balis UJ, Tompkins RG, Haber DA, Toner M. Isolation of rare circulating tumour cells in cancer patients by microchip technology. Nature. 2007;450:1235. doi: 10.1038/nature06385. [DOI] [PMC free article] [PubMed] [Google Scholar]
- 6.Mettlin C, Littrup PJ, Kane RA, Murphy GP, Lee F, Chesley A, Badalament R, Mostofi FK. Relative sensitivity and specificity of serum prostate specific antigen (PSA) level compared with age-referenced PSA, PSA density, and PSA change. Cancer. 1994;74:1615–1620. doi: 10.1002/1097-0142(19940901)74:5<1615::aid-cncr2820740520>3.0.co;2-6. [DOI] [PubMed] [Google Scholar]
- 7.de B, Johann S, Scher HI, Montgomery RB, Parker C, Miller MC, Tissing H, Doyle GV, Terstappen LWWM, Pienta KJ, Raghavan D. Circulating tumor cells predict survival benefit from treatment in metastatic castration-resistant prostate cancer. Clin Cancer Res. 2008;14:6302–6309. doi: 10.1158/1078-0432.CCR-08-0872. [DOI] [PubMed] [Google Scholar]
- 8.Ozkumur E, Shah AM, Ciciliano JC, Emmink BL, Miyamoto DT, Brachtel E, Yu M, Chen P-I, Morgan B, Trautwein J, et al. Inertial focusing for tumor antigen – dependent and – independent sorting of rare circulating tumor cells. Sci Transl Med. 2013;5:179ra47. doi: 10.1126/scitranslmed.3005616. [DOI] [PMC free article] [PubMed] [Google Scholar]
- 9.Gaster R, Hall D, Wang S. nanoLAB: an ultraportable, handheld diagnostic laboratory for global health. Lab Chip. 2011;11:950–956. doi: 10.1039/c0lc00534g. [DOI] [PubMed] [Google Scholar]
- 10.Issadore D, Westervelt RM, editors. Point of care diagnostics on a chip. Springer, Berlin, Heidelberg; 2013. [Google Scholar]
- 11.Ejsing L, Hansen MF, Menon AK, Ferreira HA, Graham DL, Freitas PP. Planar Hall effect sensor for magnetic micro- and nanobead detection. Appl Phys Lett. 2004;84:4729–4731. [Google Scholar]
- 12.Gaster RS, Hall DA, Nielsen CH, Osterfeld SJ, Yu H, Mach KE, Wilson RJ, Murmann B, Liao JC, Gambhir SS, et al. Matrix-insensitive protein assays push the limits of biosensors in medicine. Nat Med. 2009;15:1327–1332. doi: 10.1038/nm.2032. [DOI] [PMC free article] [PubMed] [Google Scholar]
- 13.Lee JH, Huh YM, Jun YW, Seo JW, Jang JT, Song HT, Kim S, Cho EJ, Yoon HG, Suh JS, Cheon J. Artificially engineered magnetic nanoparticles for ultra-sensitive molecular imaging. Nat Med. 2007;13:95–99. doi: 10.1038/nm1467. [DOI] [PubMed] [Google Scholar]
- 14.Issadore D, Min C, Liong M, Chung J, Weissleder R, Lee H. Miniature magnetic resonance system for point-of-care diagnostics. Lab Chip. 2011;11:2282–2287. doi: 10.1039/c1lc20177h. [DOI] [PMC free article] [PubMed] [Google Scholar]
- 15.Issadore D, Chung HJ, Chung J, Budin G, Weissleder R, Lee H. μHall chip for sensitive detection of bacteria. Adv Healthc Mater. 2013;2(9):1224–1228. doi: 10.1002/adhm.201200380. [DOI] [PMC free article] [PubMed] [Google Scholar]
- 16.Weigl B, Domingo G, LaBarre P, Gerlach J. Towards non-and minimally instrumented, microfluidics-based diagnostic devices. Lab Chip. 2008;8:1999–2014. doi: 10.1039/b811314a. [DOI] [PMC free article] [PubMed] [Google Scholar]
- 17.Haun JB, Devaraj NK, Hilderbrand SA, Lee H, Weissleder R. Bioorthogonal chemistry amplifies nanoparticle binding and enhances the sensitivity of cell detection. Nat Nanotechnol. 2010;5:660–665. doi: 10.1038/nnano.2010.148. [DOI] [PMC free article] [PubMed] [Google Scholar]
- 18.Howell J, Peter B, Mott DR, Fertig S, Kaplan CR, Golden JP, Oran ES, Ligler FS. A microfluidic mixer with grooves placed on the top and bottom of the channel. Lab Chip. 2005;5:524–530. doi: 10.1039/b418243j. [DOI] [PubMed] [Google Scholar]
- 19.Rhim AD, Mirek ET, Aiello NM, Maitra A, Bailey JM, McAllister F, Reichert M, Beatty GL, Rustgi AK, Vonderheide RH, et al. EMT and dissemination precede pancreatic tumor formation. Cell. 2012;148:349–361. doi: 10.1016/j.cell.2011.11.025. [DOI] [PMC free article] [PubMed] [Google Scholar]