Abstract
Heme oxygenase-1 is critical for iron recycling during red blood cell turnover, whereas its impact on steady-state erythropoiesis and red blood cell lifespan is not known. We show here that in 8- to 14-week old mice, heme oxygenase-1 deficiency adversely affects steady-state erythropoiesis in the bone marrow. This is manifested by a decrease in Ter-119+-erythroid cells, abnormal adhesion molecule expression on macrophages and erythroid cells, and a greatly diminished ability to form erythroblastic islands. Compared with wild-type animals, red blood cell size and hemoglobin content are decreased, while the number of circulating red blood cells is increased in heme oxygenase-1 deficient mice, overall leading to microcytic anemia. Heme oxygenase-1 deficiency increases oxidative stress in circulating red blood cells and greatly decreases the frequency of macrophages expressing the phosphatidylserine receptor Tim4 in bone marrow, spleen and liver. Heme oxygenase-1 deficiency increases spleen weight and Ter119+-erythroid cells in the spleen, although α4β1-integrin expression by these cells and splenic macrophages positive for vascular cell adhesion molecule 1 are both decreased. Red blood cell lifespan is prolonged in heme oxygenase-1 deficient mice compared with wild-type mice. Our findings suggest that while macrophages and relevant receptors required for red blood cell formation and removal are substantially depleted in heme oxygenase-1 deficient mice, the extent of anemia in these mice may be ameliorated by the prolonged lifespan of their oxidatively stressed erythrocytes.
Introduction
In healthy adults the constant large-scale production of mature red blood cells (RBC) is counterbalanced by the clearance of aged or damaged RBC. The bone marrow (BM) is the primary erythropoietic organ with the spleen becoming important during acute or chronic stress. Erythroid progenitor cells interact with BM macrophages to form multicellular clusters termed erythroblastic islands (EBI).1,2 Within this microenvironment, macrophages are thought to supply the rapidly hemoglobinizing erythroblasts with iron and growth factors. Erythroblasts condense and expel their nuclei in a process termed enucleation.3 BM macrophages engulf and destroy these free nuclei leading to the release of anuclear reticulocytes into the circulation,4,5 where they rapidly mature to RBC which then circulate for ~35–50 days in the mouse6, and 120 days in the human.
Erythrocyte clearance typically takes place in the spleen, where phagocytes engulf and destroy aged or damaged RBC. Exposure of phosphatidylserine on the RBC surface is a feature of aging, and the recognition of such phosphatidylserine by Tim4-expressing splenic macrophages leads to RBC engulfment and destruction.7,8 A critical stage in RBC clearance is the hemoglobin breakdown and catabolism of released heme into carbon monoxide, iron and biliverdin9 by heme oxygenase-1 (encoded by Hmox1).10 Biliverdin reductase then converts biliverdin to the potent antioxidant bilirubin.11
Mice lacking both copies of Hmox1 exhibit a range of severe defects. Firstly, only ~10–20% of expected Hmox1-deficient animals are born alive suggesting that most die in utero.12 Secondly, the Hmox1-null mutant animals that reach adulthood show numerous health problems including altered spleen morphology and function, vascular injury, renal and hepatic damage, and an increased sensitivity to oxidative stress and endotoxemia.13–15 Moreover, in Hmox1−/− mice, initial splenic enlargement progresses to red pulp fibrosis, atrophy, and functional hyposplenism in animals older than 9 months,16 reminiscent of the asplenia in the extremely rare HMOX1-null patients who also present with anemia, microcytosis and abnormal iron metabolism.15,17,18 Furthermore, polymorphisms in the HMOX1 gene promoter which can affect the extent of gene transcription are associated with a range of clinical pathologies, including idiopathic recurrent miscarriage,19 fetal hemoglobin expression in Brazilian patients with sickle cell anemia,20 and pre-eclampsia.21
Splenic macrophages are central to whole body iron recycling and return the iron from cleared RBC to the BM for use in erythropoiesis.16,22 Hmox1 plays a critical role in this iron recycling and regulates the ability of splenic macrophages to tolerate the toxic heme released during RBC clearance.16 Hmox1 is expressed in splenic macrophages and is up-regulated in other cell types in response to heme and oxidative stress.23 Splenic macrophages are significantly decreased in mice lacking Hmox1,16 resulting in iron redistribution from the spleen and hepatic Küpffer cells to hepatocytes and proximal tubular cells of the kidney.16 Inappropriate handling of heme and tissue deposition of iron in Hmox1−/− mice and HMOX1-deficient patients results in increased oxidative stress and vascular cell injury.16,17 Hematopoiesis and stress erythropoiesis in Hmox1+/− mice has been investigated recently. BM cells from Hmox1+/− mice are less capable of reconstituting lethally irradiated recipient animals.24 Moreover, mice with a hematopoietic system reconstituted from Hmox1+/− donor animals demonstrate decreased stress erythropoiesis in response to anemia.25
Here, we investigated erythropoiesis in the complete absence of the Hmox1 gene and protein expression and without exerting exogenous stress in young, 8- to 14-week old mice. We found significant alterations in the BM, circulating and splenic erythroid populations in Hmox1−/− mice. In the BM, the number of EBI macrophages was decreased and the expression of adhesion molecules was altered in erythroblast and macrophage populations, manifested as the inability of Hmox1-deficient BM to form EBI. Hmox1-deficient RBC also showed profound changes in redox biology and lifespan. Splenic erythropoiesis was almost completely absent and splenic macrophages involved in RBC removal were severely depleted. Our findings document defects in RBC production and lifespan resulting from the loss of this crucial heme-catabolizing enzyme.
Methods
Full details of the materials and methods are provided in the Online Supplementary Methods.
Mice
Hmox1+/− breeders on a BALB/c background were obtained from Dr MP Soares (Instituto de Gulbenkian de Ciencia, Portugal) from a colony generated originally by Dr SF Yet.26 Male and female mice, 8 to 14 weeks old, Hmox−/−, Hmox1+/− and Hmox1+/+ littermates obtained from Hmox1+/− × Hmox1+/− breeding, were used for experiments. All procedures were carried out according to the Australian NHMRC guidelines for animal research and were approved by the Animal Care and Ethics Committees of the University of Sydney and the Garvan Institute of Medical Research/St Vincent’s Hospital.
Flow cytometry and cytological analysis
Blood, BM, spleen and liver single cell suspensions were treated with FcR-block (MACS Miltenyi Biotech) then with appropriate antibodies for 1 h at 4°C. A list of antibodies is presented in Online Supplementary Table S1. The presence of a nucleus or surface membrane phosphatidylserine was assessed as described in the Online Supplementary Methods. Resuspended samples were analyzed using FACSCalibur (Becton Dickinson) and FlowJo software. Iron staining was performed on methanol-fixed cytospun BM samples using the Iron Stain Kit (Sigma Aldrich) according to the manufacturer’s instructions.
Isolation and imaging of erythoblastic islands
EBI were obtained from BM as described elsewhere,27 with modifications described in the Online Supplementary Methods. For confocal microscopy imaging, cells were permeabilized and fixed, before treatment with AlexaFluor 647-conjugated phalloidin (Life Technologies) and imaging using a Leica SPEII confocal microscope.
Scanning electron microscopy
The pelleted RBC and EBI underwent standard work-up procedures required for scanning electron microscopy imaging, as described in the Online Supplementary Methods.
Red blood cell production and lifespan
RBC production and lifespan were determined using in vivo carboxyfluorescein diacetate succinimidyl ester (CFSE) labeling,6 with slight modifications described in the Online Supplementary Methods. The number of CFSE−-RBC over time indicates RBC production, whereas the number of CFSE+-RBC over time indicates lifespan. A second strategy involved transfusing CSFE-labeled RBC from Hmox1+/+ into Hmox1+/+ or Hmox1−/− mice.
Biochemical analyses
Freshly collected blood (1 vol) was added to 1 vol of 200 mM N-ethylmaleimide in EDTA tubes and incubated at room temperature for 1 h, before the native redox state of peroxiredoxin 2 (Prx2) was determined.28 Heparinized blood was centrifuged and cells washed and incubated for 10 min at 37°C with hydrogen peroxide (0–150 mM). Cells were alkylated with N-ethylmaleimide for 1 h. Protein concentrations were determined and Prx2 redox state assessed. Blood hemoglobin was determined by the Drabkin method,29 while plasma hemoglobin and erythropoietin were assessed by enzyme-linked immunosorbent assay. Heme and bilirubin were analyzed by liquid chromatography-tandem mass spectrometry.
Statistical analysis
Details regarding the statistical analysis are presented in the Online Supplementary Methods.
Results
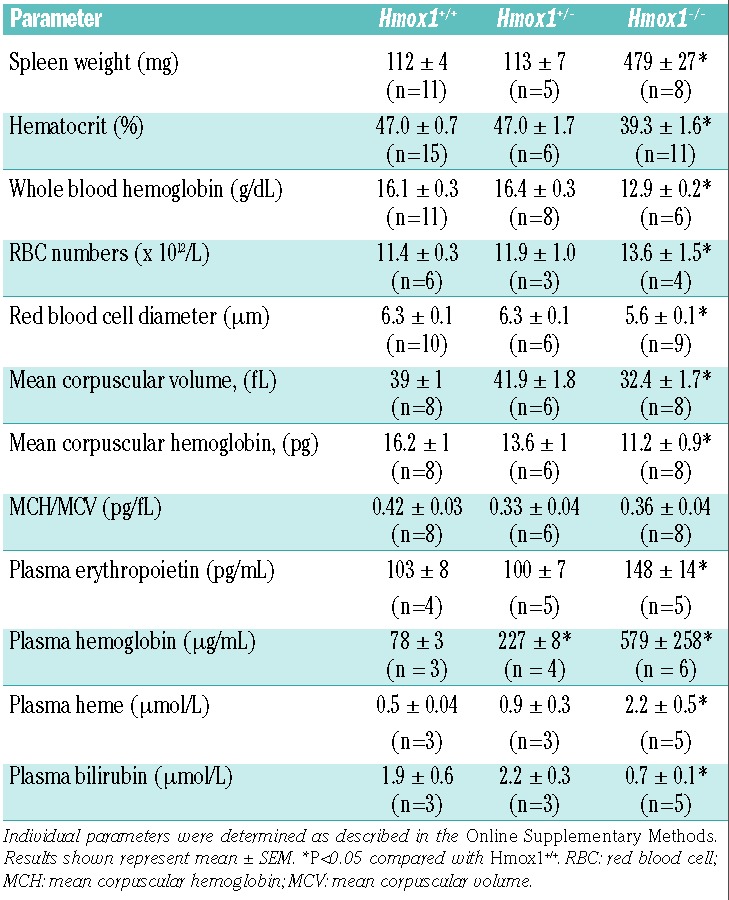
By 20 weeks of age, 129/Sv x C57BL/6 chimeras of Hmox1−/− mice display systemic inflammation and disordered iron metabolism characterized by microcytic anemia, anisocytosis, decreased serum iron, splenomegaly, and iron deposition in the liver and kidney.12,16 As genetic background and age affect phenotypes, the current study used comparatively young (8 to 14 weeks old) Hmox1−/− mice back-crossed for ≥14 generations onto the BALB/c genetic background. Compared with Hmox1+/+ littermates, Hmox1−/− mice also showed splenomegaly and a decrease in hematocrit and hemoglobin (Table 1), indicating that Hmox1 deficiency causes anemia even in young adult mice prior to the progressive inflammation present in older animals.12 Hematologic parameters of Hmox1+/− animals have not been reported previously even though a decrease in Hmox1 is associated with vascular and hematopoietic alterations. Most parameters were not altered in Hmox1+/− mice compared with wild-type animals, except for the significant increase in plasma hemoglobin in heterozygous mice. This demonstrates that Hmox1 gene dosage is important in regulating hemoglobin clearance, although this was not investigated further. We also determined plasma concentrations of heme and bilirubin, the substrate for Hmox1 and end-product of heme catabolism, respectively, as such information is currently lacking. We observed that plasma hemoglobin and heme were increased and bilirubin decreased in Hmox1−/− mice compared with Hmox1+/+ and Hmox1+/− mice (Table 1).
Table 1.
Characteristics of mice with Hmox1 deficiency.
Hmox1 deficiency alters steady-state erythropoiesis
As the BM is the primary site for erythropoiesis, we first examined the frequency of BM erythroid cells identified by the lineage-specific surface antigen Ter-119. The proportion of nucleated and enucleated BM cells being Ter-119+ was decreased significantly in Hmox1−/− compared with Hmox1+/+-and Hmox1+/− mice (Figure 1A). Consistent with the suggested impairment of steady-state erythropoiesis in Hmox1 deficiency, bones and BM cells collected from Hmox1+/+ and Hmox1+/− mice generally appeared more pigmented than their counterparts from Hmox1−/− mice (Online Supplementary Figure S1). We next subjected Ter-119+CD71+ BM cells to flow cytometry to quantify erythroid cells as they differentiate from pro-erythroblasts (R1), into basophilic (R2), polychromatophilic (R3) and orthochromatophilic erythroblasts (R4) (Figure 1B), as verified previously.30 Hmox1 deficiency caused a blockade of erythroid maturation in the R1 stage, leading to a significant decrease in R3 (Figure 1B). Similar results were obtained when the different erythroid developmental stages were segregated using expression of Ter-119, the adhesion molecule CD44 and cell size31 (Figure 1C). A consistent reduction in the frequency of “population V” cells was observed. Both R3 and “population V” identify reticulocytes.
Figure 1.
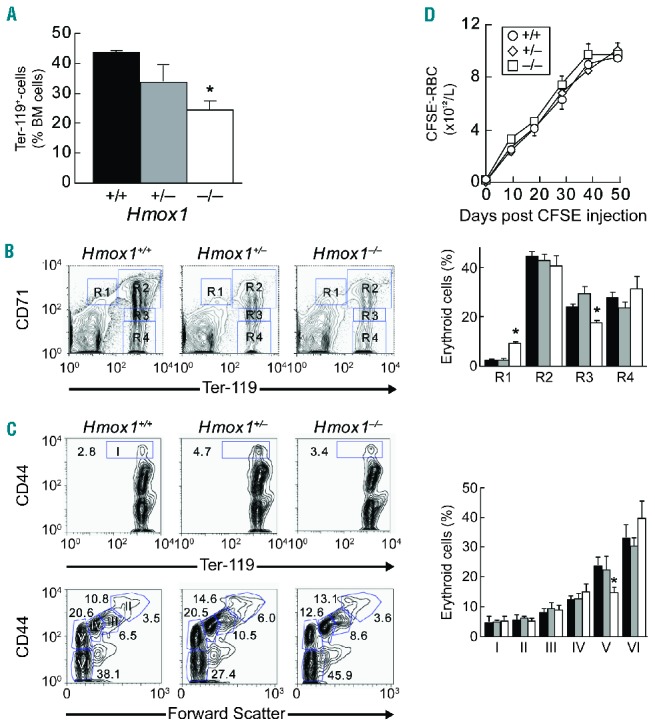
Altered steady-state erythropoiesis in the BM of Hmox1−/− mice. Erythroid maturation in BM of Hmox1+/+ (n=6), Hmox1+/− (n=3) and Hmox1−/− mice (n=5) was assessed by flow cytometry. (A) Proportion of nucleated and enucleated Ter-119+ BM cells. (B) Representative flow cytometric profiles and quantification of maturing erythroid populations R1-R4 as assessed by Ter-119 and CD71 surface expression. Results show the different populations as a percent of total cells. (C) Representative flow cytometric profiles and quantification of stages of erythroid differentiation as assessed by Ter-119 and CD44 expression in combination with forward scatter.31 (D) Graphic representation of the number of CFSEnegative-RBC over 48 days in Hmox1+/+ (circles), Hmox1+/− (diamonds) and Hmox1−/− mice (squares) (n=3 each). *P<0.05 compared with Hmox1+/+ and Hmox1+/−.
The above results show that Hmox1 regulates steady-state erythropoiesis, and they suggest that Hmox1 deficiency decreases the frequency of reticulocytes in the BM. We therefore asked if Hmox1 deficiency causes a decrease in the numbers of RBC formed and released into the circulation. To do so, we determined the time-dependent appearance of CFSE−-RBC in the circulation of mice after in vivo labeling of their blood cells with CFSE.32 The numbers of RBC released into circulation were comparable in Hmox1−/−, Hmox1+/− and Hmox1+/+ mice (Figure 1D). However, Hmox1 deficiency caused a significant decrease in the mean corpuscular diameter, volume and hemoglobin content of circulating RBC (Table 1), as has been reported previously for older animals.12 The extent of decrease in RBC corpuscular hemoglobin was comparable to the 20% decrease in whole blood hemoglobin, whereas the ratio of RBC corpuscular hemoglobin to volume was unaffected by Hmox1 deficiency (Table 1). Scanning electron microscopy and size assessment (Online Supplementary Figure S2) confirmed these findings, indicating that the abnormal erythropoiesis observed in Hmox1 deficiency results in microcytic anemia and an associated decrease in whole blood hemoglobin.
Hmox1 deficiency disrupts bone marrow macrophage-erythroblast interactions
During erythroid maturation, erythroid progenitors interact with the central macrophages of EBI in BM. We first determined Hmox1 expression in EBI by immunostaining and confocal imaging. As can be seen (Figure 2A), Hmox1 protein is abundantly expressed by the central EBI macrophages. We next assessed the impact of Hmox1 deficiency on EBI. EBI from wild-type mice yielded typical ‘EBI rosettes’, consisting of F4/80+ macrophages and their companion Ter-119+ erythroblasts (Figure 2B, middle panel). Despite repeated attempts, clusters from Hmox1−/− BM did not remain adhered to the coverslip after the numerous incubation and wash steps involved in the immunolabeling procedure. Rare individual macrophages could be observed (Figure 2B, right panel), but these were never observed in clusters associating with erythroblasts. To examine the impact of Hmox1 on EBI formation further, EBI were immediately fixed and processed for scanning electron microscopy. These experiments showed that wild-type BM macrophages readily adhered to and spread across the surface of the coverslip with adhering erythroid progenitors and, occasionally, reticulocytes (Figure 2C). The morphology of most Hmox1+/− EBI was similar to that of wild-type EBI, although some appeared disrupted and their macrophages ruffled. Compared with wild-type EBI, the few EBI that could be obtained from Hmox1−/− mice were smaller, contained fewer erythroblasts and showed profound abnormalities in structure and morphology: macrophages appeared dome-shaped (rather than flattened) and stressed, with a ruffled and abnormal cell membrane (Figure 2C, bottom right).
Figure 2.
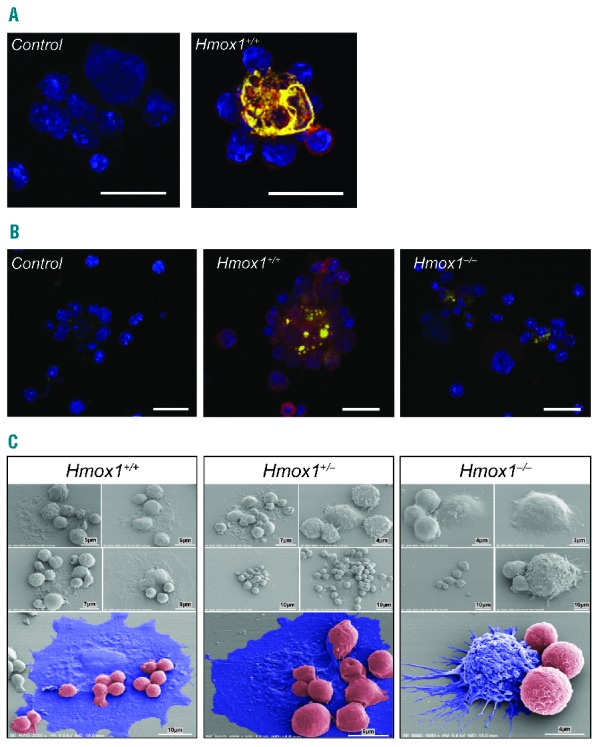
EBI formation is defective in Hmox1−/− mice. (A) Hmox1 is expressed by EBI central macrophages. EBI were obtained as described in the Methods, fixed and stained with isotype control antibody (left panel) or antibodies against Hmox1 (yellow) and F4/80 (red). Cells were counterstained with DAPI to indicate the nuclei (blue). Hmox1 is abundantly expressed by F4/80+ EBI central macrophages (right panel). (B) Macrophages from BM of Hmox1−/− mice cannot be identified in multicellular clusters. EBI assays were performed as described in the Methods from wild-type and Hmox1-deficient bone marrow, fixed and immunostained with Ter-119 (green) and F4/80 (red) antibodies. Multicellular EBI could be identified readily in wild-type samples (middle panel) whereas in samples from Hmox1−/− mice BM adherent macrophages could be detected as individual cells. (C) EBI morphology revealed by scanning electron microscopy. EBI, obtained from BM of Hmox1+/+, Hmox1+/− and Hmox1−/− mice as described in the Methods, were assessed by scanning electron microscopy. Five EBI are shown for each genotype. Bottom panels show pseudo-colored images with macrophages in blue and hematopoietic progenitor cells in red. Hmox1+/+ EBI (left panel) attached to and spread across the surface of the glass coverslip with smaller erythroblasts clearly adherent. Hmox1+/− EBI (middle panel) showed different morphology, ranging from those resembling wild-type EBI (top left, middle and bottom panels) to EBI showing abnormal macrophages (top right). Hmox1−/− EBI (right panel) were repeatedly observed with abnormal morphology. Hmox1−/− macrophages failed to extend, spread out and tether hematopoietic progenitor cells. Hmox1−/− macrophages failed to spread across the coverslip and in some cases showed signs of stress with ruffled cell membranes and erratic cytoplasmic projections (bottom pseudo-colored panel).
To identify the causes of EBI failure in Hmox1−/− mice, we examined the expression of α4β1-integrin on BM Ter-119+-erythroid cells, as erythroid cells express Hmox1,33 α4-integrin regulates terminal erythroid maturation,34 and α4β1-integrin interaction with macrophage vascular cell adhesion molecule 1 (VCAM-1) is a key determinant of EBI formation.1,35 Ter-119+-cells of Hmox1−/− mice expressed higher levels of α4β1-integrin than the corresponding cells from Hmox1+/+ and Hmox1+/− animals (Figure 3A), indicating that limited erythroid integrin expression was not responsible for the observed failure of BM from Hmox1−/− mice to form EBI.
Figure 3.
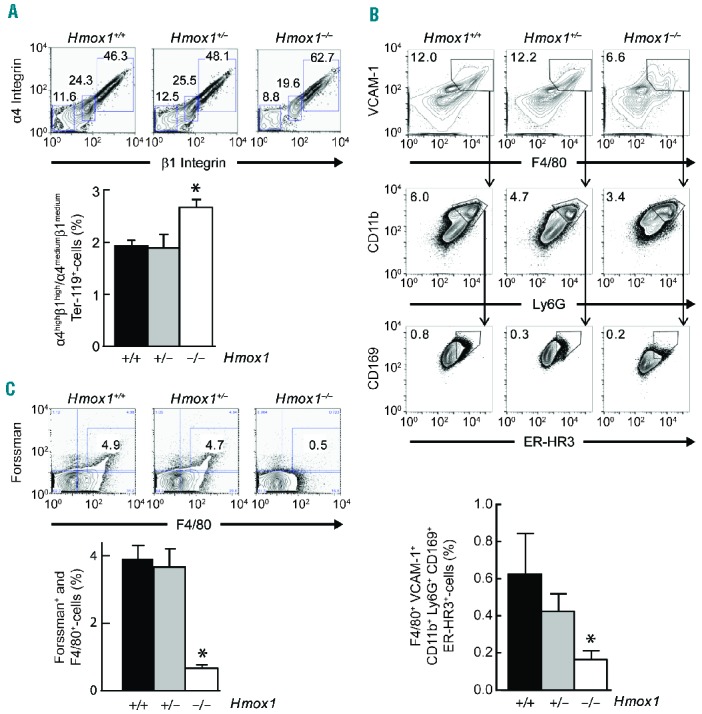
Hmox1 deficiency reduces the frequency of EBI island macrophages. (A) Representative flow cytometric profiles (top) and quantification (bottom) of α4β1 integrin expression on Ter-119+-cells from BM of Hmox1+/+ (n = 8), Hmox1+/− (n = 4) and Hmox1−/− mice (n = 6). (B) Representative flow cytometric profiles (top) and quantification (bottom) of macrophages expressing F4/80+ VCAM 1+ CD11b+ Ly6G+ CD169+ ER-HR3+, showing decreased EBI macrophages in the BM of Hmox1−/− (n=3) compared to Hmox1+/+ (n=3) and Hmox1+/− (n=3) mice. (C) Representative flow cytometric profiles (top) and quantification (bottom) indicate that BM F4/80+-macrophages of Hmox1−/− mice (n = 8) have decreased expression of the Forssman antigen, specific for EBI central macrophages, compared with Hmox1+/+ (n = 10) and Hmox1+/− (n = 5) mice *P<0.05 compared with Hmox1+/+ and Hmox1+/−.
We next employed a recently described detailed characterization of EBI macrophages, using a cocktail of differently labeled antibodies directed against six antigens.36 BM from Hmox1−/− mice had significantly decreased numbers of EBI macrophages expressing the surface antigens F4/80, VCAM 1, CD11b, Ly6G, CD169 and ER-HR3 (Figure 3B). Consistent with this observation, the expression of the glycosphingolipid Forssman antigen, a specific marker for EBI-macrophages,37 was decreased profoundly in BM macrophages of Hmox1−/− compared with Hmox1+/+ and Hmox1+/− mice (Figure 3C). These results indicate that BM of Hmox1−/− animals have a limited ability to form EBI because the numbers of EBI macrophages are decreased. Iron staining of BM cells revealed a build-up of redox-active iron in macrophages or Hmox1−/− compared with Hmox1+/+ mice (Online Supplementary Figure S3). Interestingly, despite the defects in iron metabolism in Hmox1−/− mice, no ring sideroblasts were observed.
Hmox1 deficiency alters circulating and splenic erythroid population frequency
Plasma erythropoietin was significantly increased in Hmox1−/− compared with Hmox1+/− and Hmox1+/+ mice (Table 1). Correspondingly, we observed an increase in circulating nucleated erythroid (Figure 4A) and α4-integrin+Ter-119+ cells (Figure 4B). The latter include both erythroblasts and reticulocytes. Compared with Hmox1+/+, circulating Ter-119+CD71+-cells were increased in Hmox1−/− mice (Figure 4C), suggesting that erythroblastosis takes place in these animals.
Figure 4.
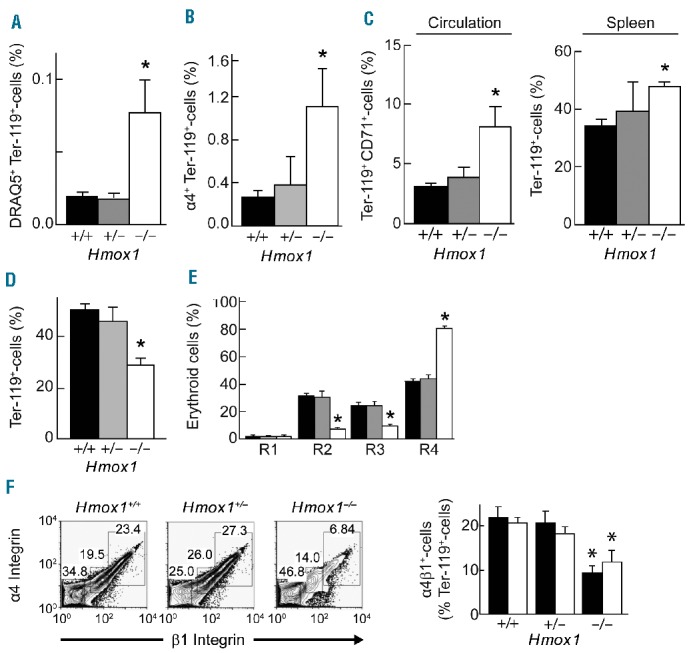
Absence of Hmox1 alters circulating and splenic erythroid population frequency. Hmox1 deficiency increases circulating erythroid cells that stain with (A) DRAQ5, (B) the erythroblast marker α4-integrin, and (C) CD71 (n = 5, 3 and 6 for Hmox1−/−, Hmox1+/− and Hmox1+/+ mice, respectively). (D) Increased frequency in Ter-119+ erythroid cells in the spleen of Hmox1−/− (n = 5) compared with Hmox1+/+ (n = 6) and Hmox1+/− (n = 3) mice. (E) Splenic erythroid maturation in Hmox1+/+ (black, n = 6), Hmox1+/− (gray, n = 3) and Hmox1−/− mice (white, n = 5) as assessed by expression of Ter-119+ and CD71+. (F) Decreased frequency of Ter-119+-erythroid cells expressing α4β1-integrin (left panel), α4β1high (black) or α4β1med integrin (white) (right panel). Data show representative flow cytometric profiles and their quantification (n = 3–10 for different groups). *P<0.05 compared with Hmox1+/+ and Hmox1+/− mice.
We next examined whether the observed erythroblastosis was associated with increased erythropoiesis in the spleen. The proportion of splenic Ter-119+-cells was increased significantly in Hmox1−/− mice (Figure 4D). This increase, combined with the decrease in Ter-119+ cells in the BM (Figure 1A), suggest that the erythropoiesis defect seen in Hmox1−/− mice is specific for BM. However, the spleen of Hmox1−/− mice also exhibited decreased basophilic (R2) and polychromatophilic (R3) erythroblast frequency, while the most mature erythroid cells (R4) were increased (Figure 4E), suggesting that stress erythropoiesis was also affected by Hmox1 deficiency. To assess this further, we examined spleen Ter-119+-cells for their expression of α4-integrin as well as α5-integrin. The latter regulates the interaction of stress erythroblasts with the splenic microenvironment.38 The expression of both α4-(Figure 4F) and α5-integrin (data not shown) in splenic erythroid cells of Hmox1−/− mice was decreased substantially compared with the expression in Hmox1+/+ or Hmox1+/− animals. This suggests that stress erythropoiesis, characterized by the influence of large numbers of integrin-expressing R2 and R3 erythroblasts, is not a major player in the maintenance of relatively normal RBC levels in Hmox1−/− mice.
Hmox1 deficiency increases red blood cell lifespan
We next examined the impact of Hmox1 deficiency on parameters known to regulate the removal of circulating RBC. For this, RBC were assessed first for signs of increased oxidative stress, using oxidized Prx2 as a marker. Prx2 is a thiol-dependent peroxidase essential for sustaining the lifespan of RBC in mice,39 and the third most abundant RBC protein.40 Upon reaction with hydrogen peroxide (H2O2), the Prx2 monomer is oxidized to two forms of dimers that contain one or two disulfide bonds and that can be separated and detected by western blotting.41 An increase in the ratio of Prx2 dimers to monomers reflects increased oxidative stress.40,41 When treated in vitro with reagent H2O2, Prx2 dimers formed at lower oxidant concentrations in isolated RBC from Hmox1−/− compared with Hmox1+/+ mice (Figure 5A), consistent with a previous study14 showing that RBC from Hmox1−/− mice were hypersensitive to oxidants ex vivo. In addition, freshly isolated RBC from Hmox1−/− mice contained a higher proportion of Prx2 as dimers compared with cells from Hmox1+/+ mice even in the absence of an added oxidant (Figure 5B). This shows for the first time that Hmox1 deficiency increases endogenous oxidative stress in circulating RBC, possibly as a consequence of the elevated plasma concentrations of the pro-oxidant heme (Table 1).
Figure 5.
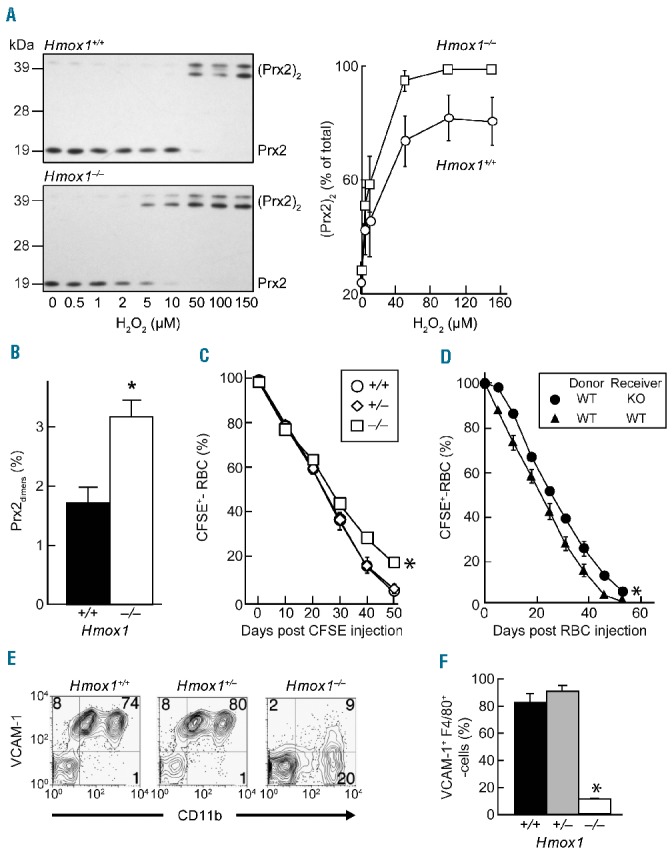
Hmox1 deficiency increases systemic oxidative stress and RBC lifespan. (A) Greater susceptibility of RBC from Hmox1−/− (n = 6) than Hmox1+/+ animals (n = 7) to oxidation induced by added H2O2. Representative western blots (left) showing oxidation of Prx2 monomer to Prx2 dimers with increasing concentrations of H2O2, with the upper and lower dimer band representing Prx2 with one and two disulfide bonds, respectively.41 Graphic representation of the densitometry data on the right. (B) Increased systemic endogenous oxidative stress in Hmox1 deficiency indicated by an increase in the percentage of endogenous RBC Prx2 present as dimers in Hmox1−/− (n = 6) compared with wild-type mice (n = 7). (C) Increase in the lifespan of RBC in Hmox1−/− (squares) compared with Hmox1+/+ (circles) and Hmox1+/− mice (diamonds) (n=3 each), as determined by the percentage of CFSE+-RBC detected over a 48-day period following in vivo CFSE labeling. *P<0.05 compared with Hmox1+/+ and Hmox1+/− as assessed by two-way ANOVA. (D) Increased lifespan of in vivo CFSE-labeled RBC from wild-type (WT) after transfer to Hmox1−/− compared with Hmox1+/+ mice, determined (n = 3 per treatment). *P<0.05 compared with Hmox1+/+ and Hmox1+/− as assessed by two-way ANOVA. (E, F) Decreased frequency of F4/80+-macrophages expressing CD11b and VCAM-1 in Hmox1−/− compared with Hmox1+/+ and Hmox1+/− mice (n=3 each). *P<0.05 compared with Hmox1+/+ and Hmox1+/−.
The rate of removal of circulating RBC was then measured by in vivo labeling of cells with CFSE.32 Compared with RBC in Hmox1+/− and Hmox1+/+ mice, RBC in Hmox1−/− mice were removed at a significantly slower rate, as determined by the percentage of CFSE+-RBC remaining over time (Figure 5C). The estimated average lifespan for RBC in Hmox1−/− mice was longer (48.8±0.1 days) than that for Hmox1+/+ and Hmox1+/− mice (i.e., 44.1±0.8 and 44.0±2.5 days, respectively; mean ± SEM, n=3 for each of the three genotypes). These results suggest that the removal of senescent RBC was compromised in Hmox1−/− mice. We therefore performed transfer lifespan studies with CFSE-labeled RBC. We observed that RBC from Hmox1+/+ mice were removed significantly slower in Hmox1−/− recipients than in Hmox1+/+ recipients (Figure 5D), consistent with the notion that RBC lifespan is increased in Hmox1−/− mice as a result of extrinsic factors, i.e., compromised RBC removal, rather than RBC intrinsic factors. Consistent with this, splenic F4/80+-macrophages expressing CD11b (Figure 5E) and VCAM-1 (Figure 5F) were severely depleted in Hmox1−/− mice, and we found no differences in the phosphatidylserine content or osmotic fragility of blood RBC from Hmox1+/+ and Hmox1−/− mice (data not shown).
The liver can serve as an extramedullary hematopoietic organ and also clear aged RBC under stress conditions. However, CD71+Ter-119+ erythroblasts occurred with comparable frequency in dispersed liver cells of Hmox1+/+, Hmox1+/− and Hmox1−/− mice (Figure 6A). Hepatic F4/80+ cells were decreased in Hmox1−/− mice (data not shown), although not as drastically as observed in the spleen of these animals. Similarly, macrophages lacking VCAM-1 and the phosphatidylserine receptor Tim4 were more abundant in the liver of Hmox1−/− than Hmox1+/+ and Hmox1+/− mice (Figure 6B), with this decrease in Tim4-expressing F4/80+ cells being less severe in the liver than in BM and spleen (Figure 6C). These results indicate that the liver in animals lacking Hmox1 does not engage consistently in erythropoiesis, and that the population of hepatic macrophages responsible for RBC clearance is decreased in Hmox1 deficiency.
Figure 6.
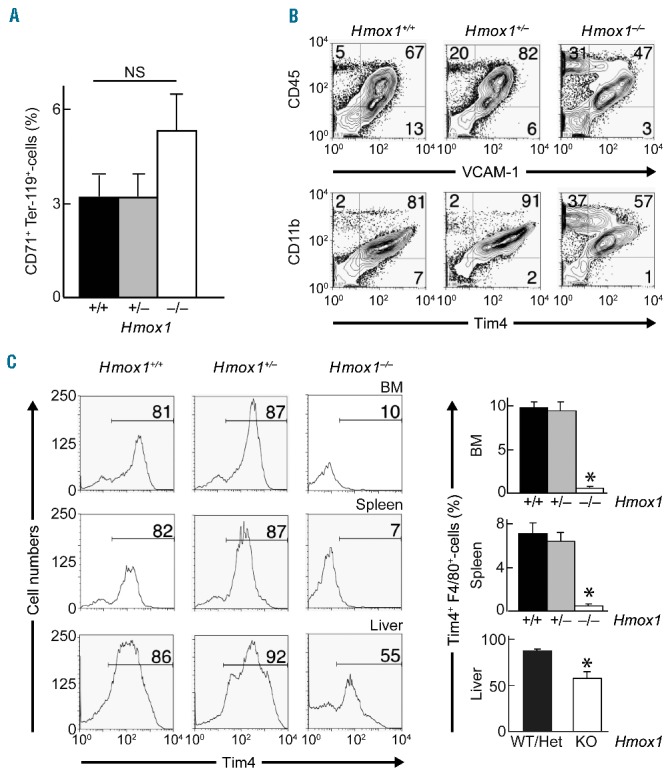
Hepatic macrophages are less severely affected by Hmox1 deficiency than bone marrow and splenic macrophages. (A) Erythropoiesis in the liver of Hmox1−/− (n = 3) and Hmox1+/+ mice (n = 3), as assessed by the frequency of CD71+Ter-119+ erythroblasts. (B) VCAM-1 and Tim4 expression on hepatic macrophages in Hmox1+/+, Hmox1+/− and Hmox1−/− mice. Representative cytometric data are shown from three separate experiments. (C) Graphic representation of flow cytometric data of BM, spleen and liver cells of Hmox1+/+ (n = 10), Hmox1+/− (n = 5) and Hmox1−/− mice (n = 8) gated for F4/80 and examined for Tim4 expression. *P<0.05 relative to Hmox1+/+(BM and spleen) or compared with Hmox1+/+ plus Hmox1+/− (liver).
Discussion
The beginning and end of an erythrocyte’s life are bookended by interactions with macrophages: BM macrophages are considered essential supportive elements in RBC formation and maturation,42,43 and splenic macrophages remove aged or damaged RBC. Hmox1 plays a critical role in the recycling of whole body iron by releasing iron from heme derived from RBC being removed by splenic macrophages; such iron is then made available for the next wave of emerging erythroid cells.16 Free heme is a strong oxidant and cytotoxic,44 and the inability of Hmox1-deficient splenic macrophages to tolerate heme leads to their death and disruption of the iron recycling process.12 Here, we show that Hmox1 also plays significant roles in regulating erythroid cell-macrophage interactions in the BM.
BM from mice lacking Hmox1 is severely depleted of EBI macrophages. This is associated with a decrease in the expression of VCAM-1 (Figure 3B, top panels), necessary for interactions with α4β1 integrin on neighboring erythroblasts. During erythroid cell maturation, the nucleus becomes condensed and expelled, surrounded by a thin layer of hemoglobin-containing cytoplasm45 and encapsulated in an erythroid cell membrane replete with α4β1 integrin.46 We propose that these hemoglobin-containing, expelled nuclei are engulfed preferentially by VCAM-1+-macrophages, leading to Hmox1 induction seen in wild-type EBI macrophages (Figure 2A). We further propose that an inability to catabolize the heme present in ‘pyrenocytes’47 leads to the selective death of VCAM-1+-macrophages in Hmox1 deficiency. Such proposed selective loss of VCAM-1+-macrophages, rather than a decrease in VCAM-1 expression by BM macrophages, is also supported by the observation that Hmox1 deficiency increases47 and Hmox1 induction decreases VCAM-1 expression.47–49 These changes in erythroblast-macrophage interactions are exemplified best by the scanning electron microscopy analysis of EBI (Figure 2C). High-resolution images of EBI illustrate the morphology of the central island macrophage and erythroblasts attached to it. In BM from Hmox1−/− mice, we observed highly abnormal EBI macrophages with domed morphology rather than flattened, spread-out morphology. These EBI also lacked clear interactions with erythroblasts. Thus, normal EBI formation no longer appears possible in Hmox1 deficiency. This deficiency likely contributes to alterations in erythropoiesis including microcytosis, abnormal cell membranes, reticulocytosis and erythroblastosis.
Few individuals are born with complete HMOX1 deficiency. These rare patients exhibit numerous similarities to the mouse null mutant. Notably, erythropoiesis does occur although it is abnormal. HMOX1-deficient patients also show altered monocyte phenotype and functions including phagocytosis.15 BM macrophage phenotype and functions have not been assessed in HMOX1-deficient patients. The erythroid defects observed in HMOX1-deficient patients could, therefore, also arise from defective erythroid cell-macrophage interactions in the BM, as we have observed in the null mutant mouse model. Furthermore, decreased expression of HMOX1 due to polymorphisms in the HMOX1 gene promoter is associated with a number of pathological conditions including difficulties in pregnancy. It is feasible that the differences observed in the Hmox1+/− animals (increased plasma hemoglobin for example) are involved in the pathologies observed in patients with HMOX1 polymorphisms.
Our studies provide direct evidence that Hmox1 deficiency increases RBC lifespan, likely by attenuating macrophage-mediated RBC removal in the spleen, liver and BM by decreasing both macrophage numbers and Tim4 expression. This may be explained in ways analogous to the specific depletion of BM VCAM-1+-macrophages (see above). Whether the elevated oxidative stress experienced by RBC from Hmox1−/− mice and indicated by their increased content of oxidized Prx228 affects lifespan remains to be investigated, e.g., by transfer experiments of labeled RBC from Hmox1−/− mice into Hmox1+/+ and Hmox1−/− mice. The corresponding decrease in non-oxidized Prx2 could conceivably attenuate RBC lifespan and increase compensatory erythropoietin synthesis,39 as seen in Hmox1−/− mice. Because Hmox1 is not present in RBC, we interpret their increased content of oxidized Prx2 in Hmox1 deficiency as the result of an increased exposure to oxidants rather than a decrease in antioxidant defenses.13 This interpretation is consistent with our observation that Hmox1 deficiency is associated with elevated plasma concentrations of the pro-oxidant heme (Table 1).
The present study does not reveal precisely how RBC are removed in Hmox1 deficiency. Previous studies have reported the accumulation of iron in hepatocytes and kidneys of Hmox1−/− mice,12,16 suggesting that cells in these tissues may compensate for decreased RBC clearance by splenic macrophages and the associated reduced heme degradation. What is clear from these previous studies,12,16 however, is that such (or any other) compensatory heme catabolism operative in Hmox1 deficiency is less efficient in iron recycling compared with Hmox1-mediated heme degradation, as Hmox1−/− mice are anemic. Our studies argue against a fully compensatory role for the constitutively expressed heme oxygenase-2 in heme degradation in Hmox1−/− mice. This is because the decrease in circulating bilirubin exceeded that of hematocrit and whole blood hemoglobin in Hmox1−/− mice by ~3-fold, compared with Hmox1+/+ mice (Table 1). Thus, the precise site and mechanism of heme degradation in Hmox1−/− mice remain to be established.
The current study raises the intriguing question of how near normal erythropoiesis is maintained in Hmox1 deficiency despite the almost complete absence of BM EBI. Interestingly, efficient enucleation has been reported to take place in the absence of macrophages during the in vitro differentiation of hematopoietic stem and progenitor cells.50 Macrophages may not, therefore, be absolutely essential for in vivo erythropoiesis, although small numbers of VCAM-1+ and Forssman ligand+ macrophages remain present in the BM of Hmox1−/− mice. Some erythropoiesis takes place in the spleen, as demonstrated by the presence of erythro -blasts in Hmox1+/+ and Hmox1−/− mice. Indeed, spleen size and proportion of splenic erythroid cells are increased in Hmox1−/− compared with control mice, possibly compensating for the defect in BM erythropoiesis. However, in the Hmox1−/− spleen erythroblasts are decreased profoundly relative to other erythroid cells and the majority of erythroid cells do not express α4β1 integrin, suggesting that stress erythropoiesis is not the major form of compensatory RBC production in these animals. Moreover, splenic erythropoiesis deteriorates as Hmox1−/− mice age and their spleens become increasingly fibrotic. Clearly, additional investigations aimed at answering some of the questions our study raises are warranted, as they will provide novel insights into basic mechanisms governing the formation and removal of RBC. As well as advancing our knowledge, such studies may provide novel treatment options for the rare cases of HMOX1 deficiency and the anemia of diseases such as chronic inflammatory diseases characterized by abnormal heme turnover and iron recycling.
Acknowledgments
This work was supported by a program grant (BHC, CRP, RS) and Senior Principal Research Fellowship (RS) from the Australian National Health and Medical Research Council, the Office of Health and Medical Research, NSW State Government, and the Bosch Institute Translational Grant-in-Aid and Sydney Medical School New Staff grant (both STF). JHY was supported by a NWG Macintosh Scholarship. We thank Dr Louise Cole for her assistance and help with confocal imaging, and acknowledge support from the Bosch Institute Live Cell Analysis, Advanced Microscopy and Mass Spectrometry Core Facilities and the Australian Center for Microscopy & Microanalysis at the University of Sydney.
Footnotes
The online version of this article has a Supplementary Appendix.
Authorship and Disclosures
Information on authorship, contributions, and financial & other disclosures was provided by the authors and is available with the online version of this article at www.haematologica.org.
References
- 1.Chasis JA, Mohandas N. Erythroblastic islands: niches for erythropoiesis. Blood. 2008;112(3):470–478. [DOI] [PMC free article] [PubMed] [Google Scholar]
- 2.An X, Mohandas N. Erythroblastic islands, terminal erythroid differentiation and reticulocyte maturation. Int J Hematol. 2011;93(2):139–143. [DOI] [PubMed] [Google Scholar]
- 3.Mohandas N, Chasis JA. The erythroid niche: molecular processes occurring within erythroblastic islands. Transfus Clin Biol. 2010;17(3):110–111. [DOI] [PMC free article] [PubMed] [Google Scholar]
- 4.Yoshida H, Kawane K, Koike M, et al. Phosphatidylserine-dependent engulfment by macrophages of nuclei from erythroid precursor cells. Nature. 2005;437(7059):754–758. [DOI] [PubMed] [Google Scholar]
- 5.Ji P, Murata-Hori M, Lodish HF. Formation of mammalian erythrocytes: chromatin condensation and enucleation. Trends Cell Biol. 2011;21(7):409–415. [DOI] [PMC free article] [PubMed] [Google Scholar]
- 6.Coupland LA, Cromer D, Davenport MP, Parish CR. A novel fluorescent-based assay reveals that thrombopoietin signaling and Bcl-X(L) influence, respectively, platelet and erythrocyte lifespans. Exp Hematol. 2010;38(6):453–461. [DOI] [PubMed] [Google Scholar]
- 7.Schroit AJ, Madsen JW, Tanaka Y. In vivo recognition and clearance of red blood cells containing phosphatidylserine in their plasma membranes. J Biol Chem. 1985;260(8): 5131–5138. [PubMed] [Google Scholar]
- 8.Miyanishi M, Tada K, Koike M, et al. Identification of Tim4 as a phosphatidylserine receptor. Nature. 2007;450(7168):435–439. [DOI] [PubMed] [Google Scholar]
- 9.Tenhunen R, Marver HS, Schmid R. The enzymatic conversion of heme to bilirubin by microsomal heme oxygenase. Proc Natl Acad Sci USA. 1968;61(2):748–755. [DOI] [PMC free article] [PubMed] [Google Scholar]
- 10.Ryter SW, Alam J, Choi AM. Heme oxygenase-1/carbon monoxide: from basic science to therapeutic applications. Physiol Rev. 2006;86(2):583–650. [DOI] [PubMed] [Google Scholar]
- 11.Stocker R, Yamamoto Y, McDonagh AF, Glazer AN, Ames BN. Bilirubin is an antioxidant of possible physiological importance. Science. 1987;235(4792):1043–1046. [DOI] [PubMed] [Google Scholar]
- 12.Poss KD, Tonegawa S. Heme oxygenase 1 is required for mammalian iron reutilization. Proc Natl Acad Sci USA. 1997;94(20):10919–10924. [DOI] [PMC free article] [PubMed] [Google Scholar]
- 13.Duckers HJ, Boehm M, True AL, et al. Heme oxygenase-1 protects against vascular constriction and proliferation. Nat Med. 2001;7(6):693–698. [DOI] [PubMed] [Google Scholar]
- 14.Poss KD, Tonegawa S. Reduced stress defense in heme oxygenase 1-deficient cells. Proc Natl Acad Sci USA. 1997;94(20):10925–10930. [DOI] [PMC free article] [PubMed] [Google Scholar]
- 15.Koizumi S. Human heme oxygenase-1 deficiency: a lesson on serendipity in the discovery of the novel disease. Pediatr Int. 2007;49(2):125–132. [DOI] [PubMed] [Google Scholar]
- 16.Kovtunovych G, Eckhaus MA, Ghosh MC, Ollivierre-Wilson H, Rouault TA. Dysfunction of the heme recycling system in heme oxygenase 1-deficient mice: effects on macrophage viability and tissue iron distribution. Blood. 2010;116(26):6054–6062. [DOI] [PMC free article] [PubMed] [Google Scholar]
- 17.Yachie A, Niida Y, Wada T, et al. Oxidative stress causes enhanced endothelial cell injury in human heme oxygenase-1 deficiency. J Clin Invest. 1999;103(1):129–135. [DOI] [PMC free article] [PubMed] [Google Scholar]
- 18.Kartikasari AE, Wagener FA, Yachie A, et al. Hepcidin suppression and defective iron recycling account for dysregulation of iron homeostasis in heme oxygenase-1 deficiency. J Cell Mol Med. 2009;13(9B):3091–3102. [DOI] [PMC free article] [PubMed] [Google Scholar]
- 19.Denschlag D, Marculescu R, Unfried G, et al. The size of a microsatellite polymorphism of the haem oxygenase 1 gene is associated with idiopathic recurrent miscarriage. Mol Hum Reprod. 2004;10(3):211–214. [DOI] [PubMed] [Google Scholar]
- 20.Gil GP, Ananina G, Oliveira MB, et al. Polymorphism in the HMOX1 gene is associated with high levels of fetal hemoglobin in Brazilian patients with sickle cell anemia. Hemoglobin. 2013;37(4):315–324. [DOI] [PubMed] [Google Scholar]
- 21.Kaartokallio T, Klemetti MM, Timonen A, et al. Microsatellite polymorphism in the heme oxygenase-1 promoter is associated with nonsevere and late-onset preeclampsia. Hypertension. 2014;64(1):172–177. [DOI] [PubMed] [Google Scholar]
- 22.Fraser ST, Midwinter RG, Berger BS, Stocker R. A critical link between iron metabolism, erythropoiesis, and development. Adv Hematol. 2011;2011:473709. [DOI] [PMC free article] [PubMed] [Google Scholar]
- 23.Stocker R. Induction of haem oxygenase as a defence against oxidative stress. Free Radic Res Commun. 1990;9(2):101–112. [DOI] [PubMed] [Google Scholar]
- 24.Cao YA, Wagers AJ, Karsunky H, et al. Heme oxygenase-1 deficiency leads to disrupted response to acute stress in stem cells and progenitors. Blood. 2008;112(12):4494–4502. [DOI] [PMC free article] [PubMed] [Google Scholar]
- 25.Cao YA, Kusy S, Luong R, et al. Heme oxygenase-1 deletion affects stress erythropoiesis. PLoS One. 2011;6(5):e20634. [DOI] [PMC free article] [PubMed] [Google Scholar]
- 26.Yet SF, Layne MD, Liu X, et al. Absence of heme oxygenase-1 exacerbates atherosclerotic lesion formation and vascular remodeling. FASEB J. 2003;17(12):1759–1761. [DOI] [PubMed] [Google Scholar]
- 27.Fraser ST, Isern J, Baron MH. Use of transgenic fluorescent reporter mouse lines to monitor hematopoietic and erythroid development during embryogenesis. Methods Enzymol. 2010;476:403–427. [DOI] [PubMed] [Google Scholar]
- 28.Bayer SB, Maghzal G, Stocker R, Hampton MB, Winterbourn CC. Neutrophil-mediated oxidation of erythrocyte peroxiredoxin 2 as a potential marker of oxidative stress in inflammation. FASEB J. 2013;27(8):3315–3322. [DOI] [PubMed] [Google Scholar]
- 29.Beutler E. Red cell metabolism. A manual of biochemical methods. 3rd ed. 1984, New York: Grune & Stratton. [Google Scholar]
- 30.Socolovsky M, Nam H, Fleming MD, et al. Ineffective erythropoiesis in Stat5a-/-5b-/-mice due to decreased survival of early erythroblasts. Blood. 2001;98(12):3261–3273. [DOI] [PubMed] [Google Scholar]
- 31.Chen K, Liu J, Heck S, et al. Resolving the distinct stages in erythroid differentiation based on dynamic changes in membrane protein expression during erythropoiesis. Proc Natl Acad Sci USA. 2009;106(41): 17413–17418. [DOI] [PMC free article] [PubMed] [Google Scholar]
- 32.Parish CR, Warren HS. Use of the intracellular fluorescent dye CFSE to monitor lymphocyte migration and proliferation. Curr Protoc Immunol. 2002; Chapter 4: Unit 4 9. [DOI] [PubMed] [Google Scholar]
- 33.Garcia-Santos D, Schranzhofer M, Horvathova M, et al. Heme oxygenase 1 is expressed in murine erythroid cells where it controls the level of regulatory heme. Blood. 2014;123(14):2269–2277. [DOI] [PubMed] [Google Scholar]
- 34.Eshghi S, Vogelezang MG, Hynes RO, Griffith LG, Lodish HF. α4β1 integrin and erythropoietin mediate temporally distinct steps in erythropoiesis: integrins in red cell development. J Cell Biol. 2007;177(5):871–880. [DOI] [PMC free article] [PubMed] [Google Scholar]
- 35.Sadahira Y, Yoshino T, Monobe Y. Very late activation antigen 4-vascular cell adhesion molecule 1 interaction is involved in the formation of erythroblastic islands. J Exp Med. 1995;181(1):411–415. [DOI] [PMC free article] [PubMed] [Google Scholar]
- 36.Jacobsen RN, Forristal CE, Raggatt LJ, et al. Mobilization with granulocyte colony-stimulating factor blocks medullar erythropoiesis by depleting F4/80+VCAM1+ CD169+ER-HR3+Ly6G+ erythroid island macrophages in the mouse. Exp Hematol. 2014;42(7):547–561. [DOI] [PubMed] [Google Scholar]
- 37.Sadahira Y, Mori M, Awai M, Watarai S, Yasuda T. Forssman glycosphingolipid as an immunohistochemical marker for mouse stromal macrophages in hematopoietic foci. Blood. 1988;72(1):42–48. [PubMed] [Google Scholar]
- 38.Ulyanova T, Jiang Y, Padilla S, Nakamoto B, Papayannopoulou T. Combinatorial and distinct roles of α5 and α4 integrins in stress erythropoiesis in mice. Blood. 2011;117(3): 975–985. [DOI] [PMC free article] [PubMed] [Google Scholar]
- 39.Lee TH, Kim SU, Yu SL, et al. Peroxiredoxin II is essential for sustaining life span of erythrocytes in mice. Blood. 2003;101(12): 5033–5038. [DOI] [PubMed] [Google Scholar]
- 40.Low FM, Hampton MB, Peskin AV, Winterbourn CC. Peroxiredoxin 2 functions as a noncatalytic scavenger of low-level hydrogen peroxide in the erythrocyte. Blood. 2007;109(6):2611–2617. [DOI] [PubMed] [Google Scholar]
- 41.Peskin AV, Dickerhof N, Poynton RA, et al. Hyperoxidation of peroxiredoxins 2 and 3: rate constants for the reactions of the sulfenic acid of the peroxidatic cysteine. J Biol Chem. 2013;288(20):14170–14177. [DOI] [PMC free article] [PubMed] [Google Scholar]
- 42.Chow A, Lucas D, Hidalgo A, et al. Bone marrow CD169+ macrophages promote the retention of hematopoietic stem and progenitor cells in the mesenchymal stem cell niche. J Exp Med. 2011;208(2):261–271. [DOI] [PMC free article] [PubMed] [Google Scholar]
- 43.Ramos P, Casu C, Gardenghi S, et al. Macrophages support pathological erythropoiesis in polycythemia vera and β-thalassemia. Nat Med. 2013;19(4):437–445. [DOI] [PMC free article] [PubMed] [Google Scholar]
- 44.Jeney V, Balla J, Yachie A, et al. Pro-oxidant and cytotoxic effects of circulating heme. Blood. 2002;100(3):879–887. [DOI] [PubMed] [Google Scholar]
- 45.McGrath KE, Kingsley PD, Koniski AD, et al. Enucleation of primitive erythroid cells generates a transient population of “pyrenocytes” in the mammalian fetus. Blood. 2008;111(4):2409–2417. [DOI] [PMC free article] [PubMed] [Google Scholar]
- 46.Isern J, Fraser ST, He Z, Baron MH. The fetal liver is a niche for maturation of primitive erythroid cells. Proc Natl Acad Sci USA. 2008;105(18):6662–6667. [DOI] [PMC free article] [PubMed] [Google Scholar]
- 47.Soares MP, Seldon MP, Gregoire IP, et al. Heme oxygenase-1 modulates the expression of adhesion molecules associated with endothelial cell activation. J Immunol. 2004;172(6):3553–3563. [DOI] [PubMed] [Google Scholar]
- 48.Belcher JD, Mahaseth H, Welch TE, et al. Heme oxygenase-1 is a modulator of inflammation and vaso-occlusion in transgenic sickle mice. J Clin Invest. 2006;116(3):808–816. [DOI] [PMC free article] [PubMed] [Google Scholar]
- 49.Wu BJ, Di Girolamo N, Beck K, et al. Probucol [4,4′-[(1-methylethylidene)bis (thio)]bis-[2,6-bis(1,1-dimethylethyl)phenol ]] inhibits compensatory remodeling and promotes lumen loss associated with atherosclerosis in apolipoprotein E-deficient mice. J Pharmacol Exp Ther. 2007;321(2): 477–484. [DOI] [PubMed] [Google Scholar]
- 50.Miharada K, Hiroyama T, Sudo K, Nagasawa T, Nakamura Y. Efficient enucleation of erythroblasts differentiated in vitro from hematopoietic stem and progenitor cells. Nat Biotechnol. 2006;24(10):1255–1256. [DOI] [PubMed] [Google Scholar]


