

Abstract
Intermediate beta-thalassemia has a broad spectrum of sequelae and affected subjects may require occasional blood transfusions over their lifetime to correct anemia. Iron overload in intermediate beta-thalassemia results from a paradoxical intestinal absorption, iron release from macrophages and hepatocytes, and sporadic transfusions. Pathological iron accumulation in parenchyma is caused by chronic exposure to non-transferrin bound iron in plasma. The iron scavenger and transport protein transferrin is a potential treatment being studied for correction of anemia. However, transferrin may also function to prevent or reduce iron loading of tissues when exposure to non-transferrin bound iron increases. Here we evaluate the effects of apotransferrin administration on tissue iron loading and early tissue pathology in non-transfused and transfused Hbbth3/+ mice. Mice with the Hbbth3/+ phenotype have mild to moderate anemia and consistent tissue iron accumulation in the spleen, liver, kidneys and myocardium. Chronic apotransferrin administration resulted in normalization of the anemia. Furthermore, it normalized tissue iron content in the liver, kidney and heart and attenuated early tissue changes in non-transfused Hbbth3/+ mice. Apotransferrin treatment was also found to attenuate transfusion-mediated increases in plasma non-transferrin bound iron and associated excess tissue iron loading. These therapeutic effects were associated with normalization of transferrin saturation and suppressed plasma non-transferrin bound iron. Apotransferrin treatment modulated a fundamental iron regulatory pathway, as evidenced by decreased erythroid Fam132b gene (erythroferrone) expression, increased liver hepcidin gene expression and plasma hepcidin-25 levels and consequently reduced intestinal ferroportin-1 in apotransferrin-treated thalassemic mice.
Introduction
Deficiency or absence in hemoglobin (Hb) β-globin relative to α-globin chain production contributes to several forms of β-thalassemia of varying severity. The homozygous forms (β0-thalassemia) of the disease are the most severe and patients may require life-long transfusions to correct anemia. Other patients with intermittent forms of the disease may display mild anemia and remain non-transfusion dependent or may require occasional transfusions to alleviate their anemia. Because there are numerous contributors to severity, with hundreds of mutations identified,1 the spectrum of the disease is quite broad and presents a unique challenge to therapeutic intervention.
The primary cause of the disease is an imbalance in normal β/γ-globin chain relative to α-globin chain synthesis, resulting in an excess of intracellular α-globin once α-hemoglobin stabilizing protein can no longer keep up with hemoglobin assembly.2 Excess α-globin is unstable and, when free within developing red blood cells, is prone to aggregation and oxidation leading to damaged and disoriented heme or hemichromes that react with red cell components.3 This leads to damage of the red blood cells and their precursors with targeted removal of damaged cells by bone marrow and splenic macrophages. Ultimately the process results in inefficient erythropoiesis and decreased red blood cell survival.4
Extravascular hemolysis is a significant contributor to excess iron in patients with β-thalassemia, either as non-transferrin bound iron (NTBI) or labile plasma iron, along with paradoxical iron absorption from the gut,5 release of iron from macrophages and hepatocytes6 and ultimately iron loading from intermittent or repeated transfusions. A major focus of treatment in β-thalassemia is to prevent iron overload and associated long-term tissue injury.
Traditional approaches to the treatment of β−thalassemia involve splenectomy, transfusion and chelation therapy. However, recent proof-of-concept studies have evaluated the feasibility of modulating erythropoiesis, particularly in non-transfusion-dependent β+ murine models. For example, JAK2 inhibitors,7 hepcidin and its peptide analogs8,9 and apotransferrin (apoTf)10 have promising effects in murine models with varying levels of the disease. Targeting γ-globin induction by small molecules (e.g. hydroxyurea, hydroxycarbamide and decitabine) has demonstrated some promise and correction of β-globin chain synthesis with genetic therapy may enable correction of intermediate and severe disease.11,12
Transferrin (Tf) is the primary iron-binding plasma glycoprotein with a molecular size of 80 kDa and a normal concentration in the range of 2–3.5 mg/mL.13 Tf mediates iron (ferric, Fe3+) transfer between tissue and erythroid cells and exists in three forms, apoTf (not iron bound), monoferric Tf and diferric Tf.14 Erythroid cells expressing Tf receptor 1 (TfR1) demonstrate preferential binding for the diferric protein, which shows a 7-fold greater delivery of iron to reticulocytes compared to the monoferric protein.14 Based on clinical information from a limited number of patients with congenital atransferrinemia, it appears that less than 0.5 mg/mL of Tf in plasma is sufficient to sustain adequate erythropoiesis.15
Work by Li et al.10 in 2010 demonstrated a critical role for Tf in the up-regulation of hepcidin (HAMP) gene expression, degradation of ferroportin in liver Küpffer cells and correction of anemia by Tf treatment in Hbbth1/th1 mice. In 2014 Kautz et al.16 discovered a critical link between excessive expression of Fam132b (eythroferrone; ERFE) in spleen and bone marrow erythroid progenitors and hepcidin suppression in Hbbth3/+ mice. This finding defined erythroferrone as a critical “erythroid regulator” of iron acquisition in anemia. The function of erythroferrone is particularly evident in conditions with an immediate need for red blood cell production such as following hemorrhage or in thalassemia.16,17
In this study we characterized effects of chronic apoTf treatment on iron deposition in non-transfused and transfused thalassemic Hbbth3/+ mice through spleen/bone marrow Fam132b (ERFE) suppression, hepcidin induction in the liver and down-regulation of intestinal ferroportin-1. Consistent with previous reports, the Hbbth3/+ mice evaluated in this study had extensive iron deposition in spleen, liver, kidney and to a lesser extent in myocardial tissue. While Hbbth3/+ mice are heterozygous for b1/b2 globin gene deletion, they have a more severe disease phenotype with more extensive secondary hemochromatosis than animals with typical β+-thalassemia, and are more consistent with the intermediate form of disease in terms of tissue-related changes.18 The effects of apoTf as a potential therapy to lessen iron loading and early tissue pathology in non-transfused and transfused Hbbth3/+ mice are demonstrated herein.
Methods
Mouse models
Mice were maintained in the animal facility of the Food and Drug Administration (FDA) Center for Biologics Evaluation and Research (Bethesda, MD, USA). Animal protocols were approved by the FDA CBER Institutional Animal Care and Use Committee and all experimental procedures were performed in compliance with the National Institutes of Health guidelines on the use of experimental animals. The non-transfused mice were age- and sex-matched [equal numbers of 3-month old male (n=5) and female (n=5) animals per group] wild-type (WT, C57BL/6J-B6) and heterozygous Hbbth3/+ mice on a C57BL/6J-B6 background, which were administered 300 mg/kg (0.3 mL) apoTf daily via the intraperitoneal (i.p.) route for 60 days. Control groups were given 0.9% NaCl, hemopexin or haptoglobin.19,20 Blood was collected every 2 weeks (see the Online Supplementary Appendix). The transfused mice were age- and sex-matched Hbbth3/+ animals given 300 mg/kg (0.3 mL) apoTf or 0.9% NaCl (0.3 mL) i.p. once daily for 15 days and transfused weekly (see the Online Supplementary Appendix).12,18
The reagents used in this study are described in detail in the Online Supplementary Appendix.
Plasma analysis of human/murine transferrin, human hemopexin and haptoglobin
Plasma from Hbbth3/+ mice was evaluated for hemopexin, haptoglobin and transferrin (see the Online Supplementary Appendix).
Measurements of plasma non-transferrin-bound iron and tissue iron
As described in the Online Supplementary Appendix, plasma from Hbbth3/+ mice was evaluated for NTBI using a direct colorimetric NTBI detection assay.21
For the tissue iron measurements, kidney, liver, spleen and heart tissue (100 mg) was homogenized in double deionized H2O at 1:10 wt/vol. Homogenates were mixed with 500 mL of an acid mixture containing 1 mM HCl and 10% trichloroacetic acid, and incubated at 60°C for 20 h with intermittent shaking (see the Online Supplementary Appendix).
Quantitative real-time polymerase chain reaction and western blotting
The hepcidin gene (Hamp) and Fam132b (ERFE) were evaluated by quantitative real-time polymerase chain reaction analysis as previously described.10,22 Ferroportin-1 was analyzed by western blotting, as described elsewhere.20 Further details are provided in the Online Supplementary Appendix.
Hematologic analyses
Blood was obtained at baseline and at weeks 2, 4, 6, and 8 in primary study animals and satellite study animals. At each blood collection red blood cell parameters were determined, as detailed in the Online Supplementary Appendix.23
Liquid chromatography – tandem mass spectrometry analysis for tissue ferritin and hepcidin
Liquid chromatography (LC) – tandem mass spectrometry (MS/MS) analysis for tissue ferritin was performed using a single ion monitoring (SIM) MS1 quantification method. Details of this methodology24 are provided in the Online Supplementary Appendix and Online Supplementary Table S1.
With regards to hepcidin, the protein precipitation and purification,25 calibration standards, internal standard preparation, SIM-target-MS2 approach, the MS method scan cycle, and MS/MS spectra acquisition are described in the Online Supplementary Appendix.
Raw SIM spectra of ferritin measurements with details of data analysis for tissue ferritin and plasma hepcidin-25 are provided in the Online Supplementary Appendix.
Histopathology
Spleens, livers, kidneys and hearts were fixed in 10% formalin for 24 h then stored in 70% isopropanol, embedded in paraffin, and 5 μm sections prepared, as described in the Online Supplementary Appendix.
Statistical analysis
Data are presented as mean ± standard error of mean. ANOVA with a post-hoc Bonferroni test was applied for between-group comparisons using GraphPad PRISM 5.0. P values <0.05 were considered statistically significant.
Results
Apo-transferrin administration in non-transfused Hbbth3/+ mice rapidly normalizes transferrin saturation and plasma non-transferrin-bound iron
The basal mouse Tf concentration in Hbbth3/+ mice was 310 ± 0.33 mg/dL. After the initial 15 days of treatment, total (mouse + human) plasma Tf concentrations increased to 740 ± 1.2 mg/dL and remained between 600 and 1000 mg/dL until day 60 (Figure 1A,B). Total plasma iron declined from 316.7 ± 15.5 mg/dL to 177.5 ± 15.5 mg/dL (Figure 1C). Between-group comparisons were significantly different at day 60 (Figure 1D). ApoTf treatment reduced Tf saturation from 79.3 ± 2.36% to 29.5 ± 8.72% over the initial 15 days and maintained Tf saturation at this level for the remainder of the study (Figure 1E). Between-group comparisons were significantly different at day 60 (Figure 1F). Basal NTBI decreased from 257 ± 10.8 ng/mL to 69.1 ± 17.6 ng/mL after the initial 15 days and to 42.7 ± 10.2 ng/mL at day 60 (Figure 1G). Between-group comparisons were significantly different at day 60 (Figure 1H). To rule out any contribution of free heme or hemoglobin in this model, hemopexin and haptoglobin were used as control proteins. Following hemopexin administration, plasma concentrations increased to a steady state of 3.5 ± 0.61 mg/mL after the initial 15 days, which is five times the normal human plasma hemopexin concentration.26 Following haptoglobin administration, plasma concentrations increased to a steady state of 2.3 ± 0.31 mg/mL after the initial 15 days of treatment, which is the upper level of normal human plasma haptoglobin concentrations.27 Although adequate plasma concentrations of hemopexin and haptoglobin were maintained at steady state levels over 60 days, no changes in Tf saturation or NTBI were observed (data not shown). Li et al.10 previously observed a neutralizing antibody response to human Tf in mice. However, the dose given (400 mg/kg) was sufficient to overcome this response. In the present study we evaluated weekly plasma concentrations (Figure 1) of murine and human Tf and found that a therapeutically effective steady state plasma Tf level is achieved and maintained with the dose (300 mg/kg) of human Tf evaluated. We did not observe a global immune response (e.g. increased interleukin-6) to human apoTf in this study.
Figure 1.
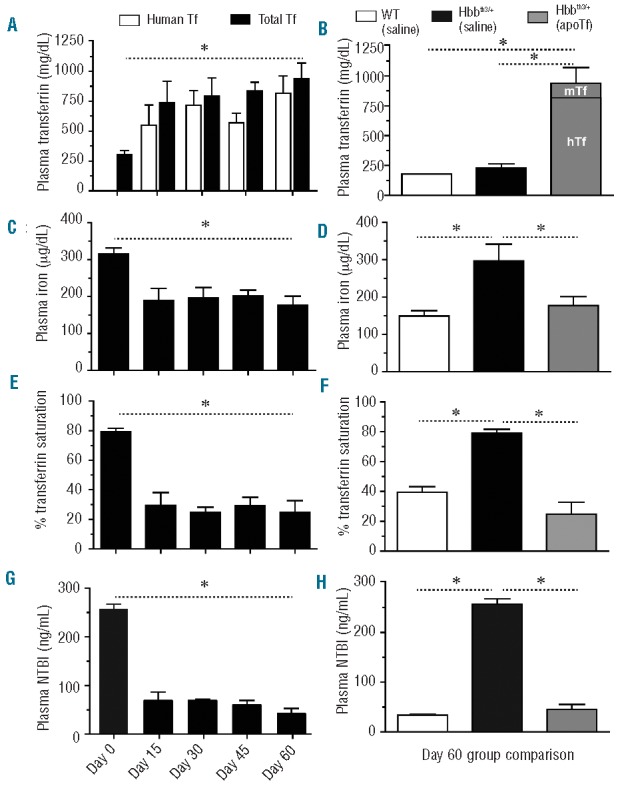
Effects of apoTf on plasma iron in Hbbth3/+ mice. The graphs show: (A) plasma transferrin concentration; (B) group comparisons in plasma transferrin concentration at 60 days; (C) total plasma iron; (D) group comparisons in total plasma iron level at 60 days; (E) percentage transferrin saturation; (F) group comparisons in percentage transferrin saturation at 60 days; (G) NTBI; (H) group comparisons in NTBI at 60 days; The values are means from ten animals per group and error bars represent the standard error of the mean. Statistical significance is set at a P value <0.05 indicated in panels (A), (C), (E) and (G) as a ∗ for baseline comparisons and in panels (B), (D), (F), (H) for between-group comparisons.
Apotransferrin administration in non-transfused Hbbth3/+ mice reduces splenomegaly and spleen iron content
The splenic red pulp removes damaged and senescent erythrocytes and also stores iron, red blood cells, and platelets. However, in rodents and to some extent in humans, this compartment is also an important site of extra-medullary hematopoiesis.28 Red pulp expansion and iron distribution in Hbbth3/+ mice can be modified by extravascular hemolysis and extra-medullary hematopoiesis. Figure 2A shows the distribution of normal red pulp (black arrow) and white pulp (white arrow) in WT mouse tissue sections stained with hematoxylin and eosin (H&E). Perls staining with DAB intensification shows non-heme iron distribution, which is limited to the red pulp compartment (Figure 2B,C). Expansion of the red pulp is shown in Hbbth3/+ (saline) mice (Figure 2D), consistent with increased non-heme iron deposition and poorly defined white pulp compartments (Figure 2E,F). After 60 days of apoTf treatment in Hbbth3/+ mice, the abnormally large expansion of the red pulp compartments takes on a more normal distribution of red and white pulp and a less diffuse pattern of iron-stained tissue (Figure 2G,I). For qualitative comparison, relative spleen sizes are shown for WT (saline) mice, at the start of the study (3-month old mice) and for Hbbth3/+ mice at the start of the study (3-month old mice) and at its termination (5-month old mice). The reduction in spleen size in Hbbth3/+ (apoTf) mice at study termination is shown in Figure 2J. Quantification of splenic iron content showed that apoTf significantly reduces total iron compared to saline treatment in Hbbth3/+ mice. The spleen total tissue iron concentration in Hbbth3/+ (apoTf) mice approached that of WT (saline) mice at 60 days of treatment; however, iron deposition in the spleen remained significantly different from that of WT (saline) mice (Figure 2K).
Figure 2.
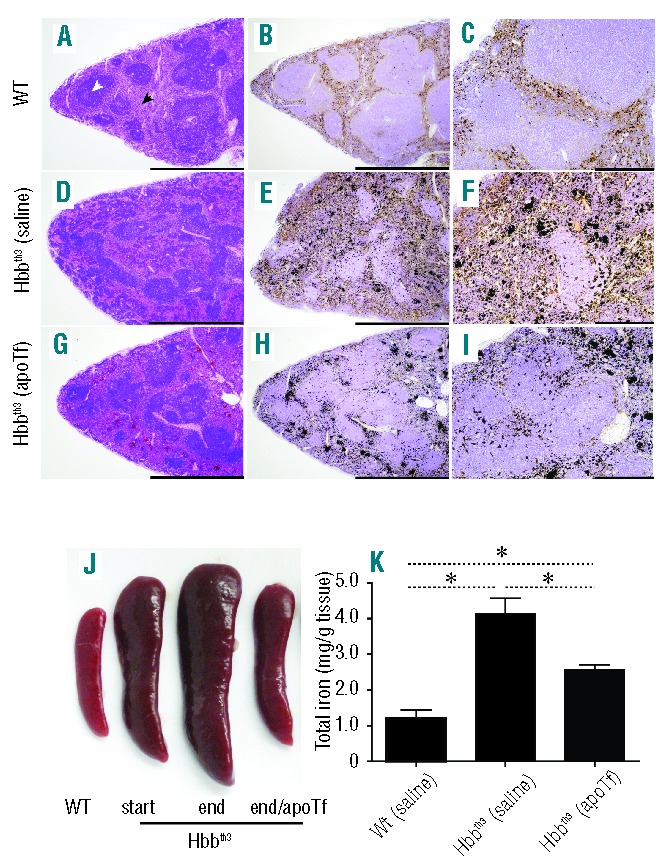
Effects of apoTf on extramedullary changes and iron content in Hbbth3/+ mice spleen. (A) Light microscopy images of H&E-stained sections and (B, C) Perls DAB non-heme iron staining under 4× (B) and 20× magnification (C) are shown for wild type (WT) spleen sections following 60 days of i.p. saline administration. The same tissue histopathology is shown for Hbbth3/+ saline treated mice (D–F) and for Hbbth3/+ apoTf treated mice (G–I). (J) Relative spleen size comparisons are shown to compare WT, Hbbth3/+ (start, 3 months), Hbbth3/+ [(saline) end, 5 months] and Hbbth3/+ [(apoTf) end, 5 months]. (K) Group comparisons for tissue iron at 60 days of treatment. Mean values are based on a total of ten animals per group and errors bars represent the SEM. Statistical significance is set at a P value <0.05 indicated in panel (K) as ∗ for between-group comparisons. Scale bars represent 2 mm (left and middle panels, 4× magnification) and 500 μm (right panel, 20× magnification).
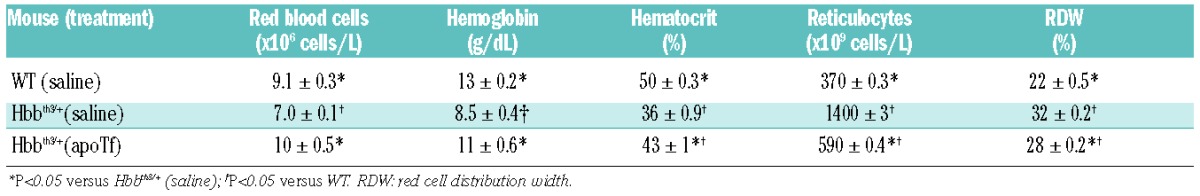
Previous work by Li et al.10 demonstrated an important role for apoTf and holoTf in normalization of anemia following 2 months of treatment with 400 mg/kg i.p. in less severely diseased non-transfused Hbbth1/th1 mice homozygous for b1 globin gene deletion.10 The temporal effects of apoTf on reticulocyte normalization, hematocrit restoration and correction of additional red blood cell parameters are shown in Table 1. However, as for the Tf saturation and NTBI results, neither hemopexin nor haptoglobin contributed to correction of anemia or splenomegaly (Online Supplementary Figure S1A–C). Consistent with apoTf-mediated correction of anemia, prior to treatment, Hbbth3/+ mice have nucleated red blood cells and abnormal erythrocyte morphology (elliptocytes, spherocytes and schistocytes) (Online Supplementary Figure S2A–D).
Table 1.
Red blood cell parameters in Hbbth3/+ mice.
Apotransferrin administration in non-transfused Hbbth3/+ mice normalizes hepatic, renal and cardiac iron content and attenuates early morphological tissue changes
Increased absorption of iron from the gut and reduced red blood cell survival are two causes of tissue iron accumulation in non-transfusion dependent thalassemia. Similar to human non-transfusion-dependent β-thalassemics, the primary organ system prone to iron overload in Hbbth3/+ mice is the liver.29 However, iron accumulation is also observed in the kidney and heart.29 In the present study, Perls staining with DAB intensification of liver sections from WT (saline) mice did not show iron accumulation under 4× and 20× magnification (Figure 3A,B). Consistent with elevated plasma NTBI, liver sections from Hbbth3/+ (saline) mice showed a diffuse increase in hepatocyte iron loading, visible under 4× magnification (Figure 3C) and increased inter- and intra-hepatocyte iron accumulation visible under 20× magnification (Figure 3D). Conversely, apoTf treatment significantly attenuated visualization of hepatocyte iron accumulation in Hbbth3/+ mice (Figure 3E) and reduced total liver non-heme iron similar to that of WT (saline) mice (Figure 3F). Group comparisons for tissue iron at 60 days of treatment are shown in Figure 3G. Hemopexin and haptoglobin did not alter accumulation of iron in hepatocytes or change total liver non-heme iron concentration from that of Hbbth3/+ (saline) mice (data not shown).
Figure 3.
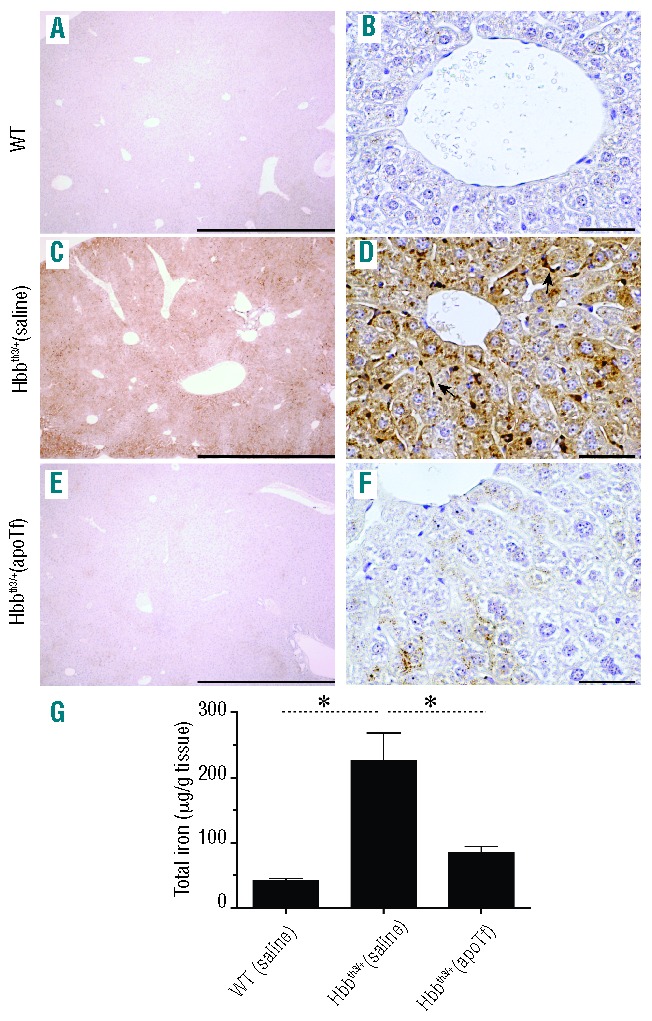
Effects of apoTf on hepatic distribution and content of non-heme iron in Hbbth3/+ mice. Light microscopy images of Perls DAB non-heme iron staining of liver tissue sections under 4× magnification (A) and 40× magnification (B) are shown for WT mice following 60 days of saline administration. The same tissue histopathology is shown for Hbbth3/+ saline dosed mice (C and D) and for Hbbth3/+ apoTf-dosed mice (E–F). Scale bars represent 2 mm (panels (A), (C) and (E), 4× magnification) and 100 μm (panels B, D and F, 40× magnification). (G) Group comparisons for tissue iron at 60 days of treatment. Mean values are based on a total of 10 animals per group and errors bars represent the SEM. Statistical significance is set at a P value <0.05 indicated in panel (K) as a ∗ for between-group comparisons.
Pathological changes in the liver, beginning with fibrosis, are common sequelae in β-thalassemia.30 Normal portal and periportal collagen deposition was observed following Masson trichrome staining of hepatic tissue sections from WT (saline) and Hbbth3/+ (apoTf) mice (Online Supplementary Figure S3A, i and ii). However, tissue sections from Hbbth3/+ (saline) mice showed increased intensity of collagen staining (blue) in periportal hepatocytes (Online Supplementary Figure S3A, iii). Damage to hepatocytes was observed in the periportal region of hepatic tissue with loss of normal morphology (Online Supplementary Figure S3A, iv, 60× magnification). Granulocytes could be seen to be accumulated in clusters around periportal hepatocytes following H&E staining (Online Supplementary Figure S3A, v). Semi-quantitative analysis for percent tissue collagen staining and granulocyte accumulation suggested that administration of apoTf to Hbbth3/+ mice attenuated indicators of tissue pathology in the liver (Online Supplementary Figure S3A, vi). However, Hbbth3/+ mice did not show a significant elevation of liver enzymes and therefore these data may be indicative of early pathological findings.
In kidney tissue sections no iron deposition was seen in the renal cortex or medulla of WT (saline) mice (Figure 4A). However, iron accumulation was consistently observed in the proximal and distal tubules of the renal cortex in kidney tissue sections from Hbbth3/+ (saline) mice under 20× and 4× magnification (Figure 4B and inset). Administration of apoTf to Hbbth3/+ mice prevented iron deposition (Figure 4C) and reduced the quantity of kidney non-heme iron to that of WT (saline) mice (Figure 4D).
Figure 4.
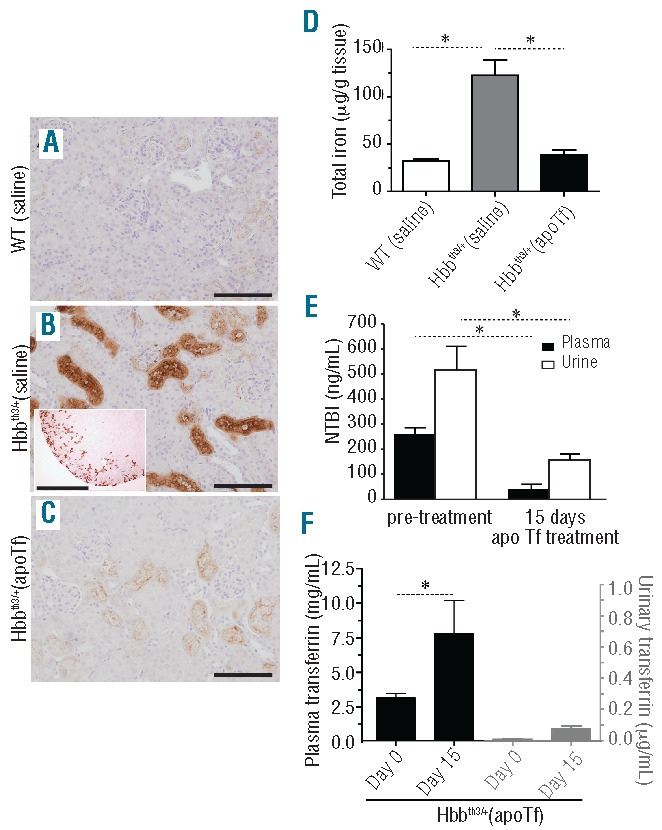
Effects of apoTf on renal iron deposition, urinary NTBI and transferrin excretion in Hbbth3/+ mice. (A–C) Light microscopy images of Perls DAB non-heme iron staining of renal cortex at 20× magnification (scale bar 200 μm). (D) Group comparisons for tissue iron (mg/g kidney weight) at 60 days of treatment. (E) NTBI excreted in the urine of Hbbth3/+ mice at 15 days of apoTf treatment. Plasma Tf and urinary Tf at steady state are compared to illustrate minimal renal excretion of human Tf following dosing sufficient to achieve the maximum constant plasma concentration. Mean values are based on a total of ten animals per group and errors bars represent the SEM. Statistical significance is set at a P value <0.05 indicated in panels (D–F) as a ∗ for between-group comparisons.
Normal urinary Tf excretion is reported to be in the range of 0.3–0.5 mg/day, but may be elevated in diseases such as Fanconi syndrome.31 We hypothesized that total body iron may decrease as a result of renal elimination of Tf-bound iron in apoTf-treated Hbbth3/+ mice. The accumulation of iron in proximal/distal tubules in Hbbth3/+ mice is associated with increased urinary excretion of NTBI and urinary NTBI did follow the reduction in plasma NTBI after apoTf administration (Figure 4E). Quantification of human Tf in the urine of Hbbth3/+ (apoTf) mice suggests that only a minor amount (<1%) of administered Tf is excreted by the kidney (Figure 4F). Tf-iron excretion does, therefore, appear to be a minor route of body iron depletion during apoTf treatment.
Chronic accumulation of iron specific to the renal proximal and distal tubules is consistent with mild to moderate renal morphological changes observed as an abnormal distribution of nuclei, vacuolation and necrosis in H&E-stained tissue sections from kidney (Online Supplementary Figure S3B). Low (20×) and high (96×) magnification images of renal tubule structures of WT (saline), Hbbth3/+ (apo-Tf) and Hbbth3/+ (saline) mice are shown as full images, with insets of renal cortical regions, in Online Supplementary Figure S3B, i, ii and iii. Severity scoring of tissue sections suggests mild to moderate renal tubular pathology in Hbbth3/+ (saline) mice (Online Supplementary Figure S3B, iv). However, analysis of serum creatinine and calculated glomerular filtration rate did not suggest renal insufficiency or failure. Therefore, as for the liver, the observation of morphological changes in the apoTf-treated kidney is likely signaling early or sub-clinical damage that may progress over time.
Cardiac iron accumulation is typically not a cause of adverse outcomes in intermediate β-thalassemia. However once NTBI accumulates in the blood it enters the myocardium at a rate nearly 200 times faster than Tf-bound iron.32,33 The accumulation of iron in the hearts of transfusion-dependent patients with β-thalassemia major is reported to occur as cytoplasmic granules. This is associated with damaged myocytes and loss of myofibers,33,34 ultimately leading to congestive heart failure and death. Hbbth3/+ (saline) mice did show cardiomyocyte iron deposition, with granular deposition at 5 months of age. At 60× magnification, iron deposition was not observed in the hearts of WT or apoTf-treated Hbbth3/+ mice when compared to saline-treated Hbbth3/+ mice (Online Supplementary Figure S4A–C).
In the present study we observed a 5-fold increase in liver iron content of approximately 250 mg/g of liver weight in Hbbth3/+ (saline) mice (Figure 3G), consistent with mild to moderate iron overload. In the kidneys, iron increased from less than 25 mg/g to 125 mg/g weight in Hbbth3/+ (saline) mice (Figure 4D). ApoTf treatment in Hbbth3/+ mice normalized iron content in both the liver and kidneys to levels in WT (saline) mice. These observations are consistent with the pattern of liver and kidney ferritin light and heavy chain expression measured by SIM LC-MS/MS in WT (saline), Hbbth3/+ (saline) and Hbbth3/+ (apoTf) mice (Figure 5).
Figure 5.
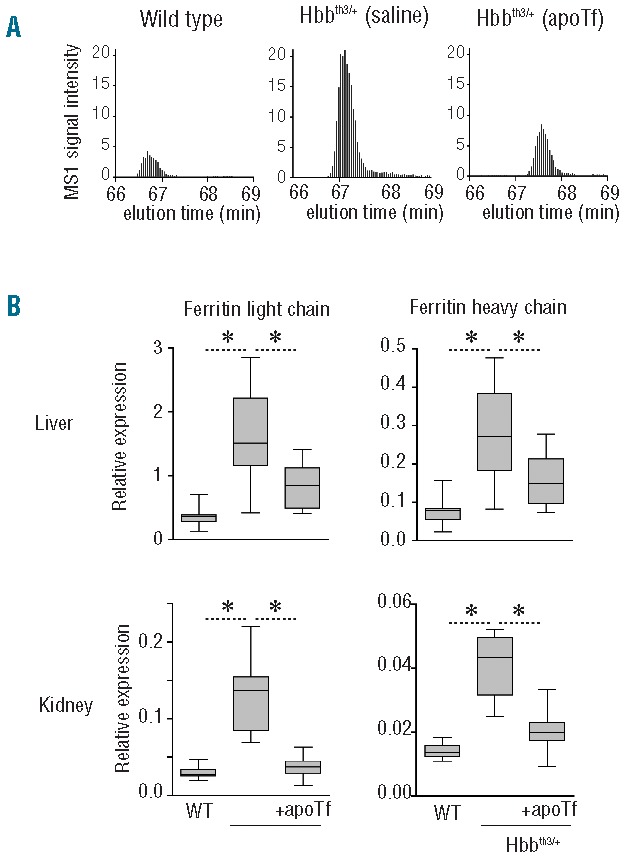
Effects of apoTf on hepatic and renal ferritin light and heavy chain expression in Hbbth3/+ mice. (A) Representative single ion monitoring (SIM) LC-MS/MS elution profiles of the ferritin light chain peptide NLNQALLDLHALGSAR in livers of wild-type, Hbbth3/+ and apoTf-treated Hbbth3/+ mice. (B) Ferritin light chain and heavy chain expression in liver and kidney of wild-type, Hbbth3/+ and transferrin-treated Hbbth3/+ mice measured by SIM LC-MS/MS. Data were normalized for actin expression which was measured in the same LC-MS/MS runs. The box plots represent data from ten (liver) and nine (kidney) animals per group. Statistical significance is set at a P value <0.05 indicated in (B) as a * for between group comparisons. For both proteins, group differences of WT versus apoTf-treated Hbbth3 mice were not statistically significant.
Apotransferrin administration in non-transfused Hbbth3/+ mice alters erythroferrone, hepcidin and ferroportin-1
The erythroblast-derived protein, erythroferrone (ERFE), encoded by Fam132b is described as a regulator of hepcidin.16 In this study, we refer to the expression of the murine mRNA for ERFE as Fam132b (ERFE), denoting expression of the transcript for ERFE protein. We evaluated both spleen and bone marrow, but focus the data analysis on extramedullary tissue based on splenic hematopoiesis in murine β-thalassemia.
We found that Fam132b (ERFE) expression declined significantly in spleen and bone marrow (data not shown) within the initial 15 days of apoTf administration (data not shown). At 45 days of apoTf treatment, spleen and bone marrow (data not shown) Fam132b (ERFE) expression normalized to that of WT (saline) mice (Figure 6A). Hepatic hepcidin (HAMP) mRNA expression increased in accordance with measurements of plasma hepcidin-25 peptide in plasma during apoTf treatment (Figure 6B), consistent with the decline in expression of Fam132b (ERFE) in extramedullary hematopoietic tissue and bone marrow. Compatible with the high hepcidin levels we found low expression of the iron exporter ferroportin-1 in the duodenum following apoTf treatment (Figure 7A). A reduction in intestine epithelial iron was also seen in Hbbth3/- (apoTf) mice (Figure 7B). We also observed iron-loaded macrophage populations in Perls DAB-stained liver tissue sections from Hbbth3/+ (saline) mice. These cells were associated with the outer walls of hepatocytes and in close proximity to sinusoids and were morphologically consistent with iron-containing Küpffer cells (data not shown). No iron-loaded intra-hepatic cells were observed in WT (saline) or Hbbth3/- (apoTf) mice.
Figure 6.
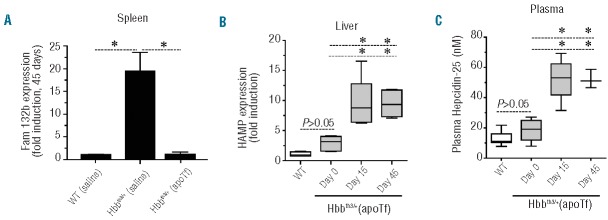
ApoTf administration in non-transfused Hbbth3/+ mice alters erythroferrone, hepcidin and ferroportin. (A) Fam132b (ERFE) expression at 45 days in the spleens of WT (saline), Hbbth3/+ (saline) and Hbbth3/+ (apoTf) mice (n=8 per group). (B) HAMP gene expression in livers of WT (n=9), Hbbth3/+ and Hbbth3/+ (apoTf) mice (Day 0 n=8, Day 15 n=8, Day 45 n=8). (C) Plasma hepcidin-25 concentrations were measured by SIM LC-MS/MS and are represented as box plots per time point with the following group sizes: WT n=9, Hbbth3/+ and Hbbth3/+ (apoTf) (Day 0 n=8, Day 15 n=5, Day 45 n=3). Statistical significance is set at a P value <0.05 indicated in panels (A) and (B) as a ∗ for significant differences between groups and time points.
Figure 7.
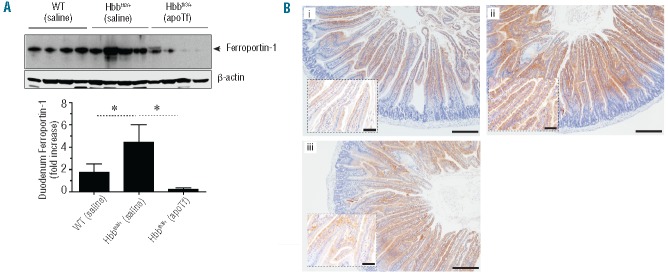
Effect of apoTf on ferroportin-1 and iron in duodenum of Hbbth3/+ mice. (A) Western blotting and semi-quantitative densitometry analysis of ferroportin-1 from duodenal lysates of end study WT (saline), Hbbth3/+ (saline) and Hbbth3/+ (apoTf) mice (n=4 per group). Statistical significance is set at a P value <0.05 indicated as a ∗ for significant differences between groups in the densitometry analysis. (B) Light microscopy images of Perls DAB non-heme iron staining of cross-sectioned duodenal tissue under 10× magnification for (i) WT (saline), (ii) Hbbth3/+ (saline) and (iii) Hbbth3/+ (apoTf) mice. Scale bars are equal to 200 μm. Inset images are provided to illustrate microvilli enterocyte iron at 40×; scale bars are equal to 50 μm.
Blood transfusion with and without apotransferrin administration in Hbbth3/+ mice
Hbbth3/+ mice demonstrated a mild-moderate anemic state at baseline, consistent with previous reports (Table 1).18 We evaluated the effects of apoTf treatment on excess iron loading and tissue iron distribution following short-term transfusion with 2.5 times the total red blood cell volume (200 mL packed red blood cells every 3 days) over 15 days. This dosing scheme approximates one transfusion every 45 days in a human, based on data reported from interspecies scaling estimates.35 Blood transfusion alone normalized spleen Fam132b (EFRE) expression in Hbbth3/+ (saline) mice to that found in WT (saline) mice. Animals concomitantly administered apoTf within the 15-day transfusion period tended to have even lower expression of Fam132b (EFRE) than that in the animals only transfused (Figure 8A). Transfusion also increased hepatic HAMP gene expression and, similarly, the concomitant administration of apoTf tended to increase the expression compared to that induced by transfusion alone (Figure 8B). Blood transfusion increases hematocrit and decreases reticulocyte counts in Hbbth3/+ mice (Figure 8C,D). However, only combined treatment with blood transfusion plus apoTf administration fully restored hematocrit and decreased reticulocyte counts to those of WT mice (Figure 8C,D).
Figure 8.
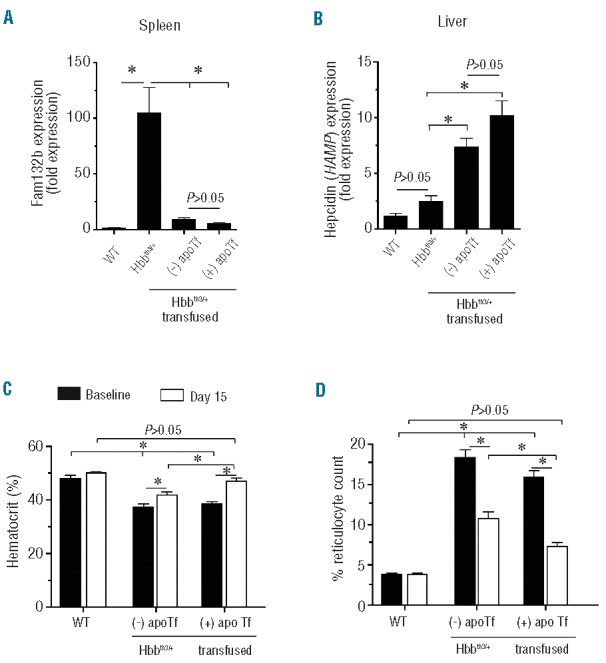
Effects of transfusion ± apoTf on Fam132b, HAMP and hematologic parameters in Hbbth3/+ mice. (A) Data are shown for Fam132b (ERFE) expression in the spleens of WT (saline), Hbbth3/+ (saline) and Hbbth3/+ (apoTf) mice (n=8 per group) after treatment. (B) HAMP gene expression in liver of WT (n=9), and Hbbth3/+ mice (Day 0 n=8, Day 15 n=8, Day 45 n=8). (C) Hematocrit; (D) % reticulocyte count. Mean values for hematocrit and reticulocyte count are based on a total of ten animals per group. Errors bars represent the SEM. Statistical significance is set at a P value <0.05, indicated in panels (A) and (B) as a ∗ for significant differences between groups.
We found that plasma NTBI increased in transfused Hbbth3/+ mice (Figure 9A). This was consistent with an increase in total liver iron of 75% and 25% compared to that in WT (saline) and Hbbth3/+ (saline) mice, respectively. ApoTf administration prevented accumulation of excess liver tissue iron in transfused Hbbth3/+ mice (Figure 9B). In kidney tissue, total iron increased by 70% and 20% in transfused Hbbth3/+ mice (-apoTf) compared to that in WT (saline) and Hbbth3/+ (saline) mice, respectively. ApoTf administration also prevented excess kidney iron accumulation in transfused Hbbth3/+ mice (Figure 9C). Liver tissue sections from WT (saline) mice showed no visual iron deposition (Figure 9D). However, liver tissue sections from Hbbth3/+ (saline) and Hbbth3/+ (transfused) mice showed progressively increasing hepatocyte iron deposition (Figure 9E–F). Visualization of iron deposition was reduced in Hbbth3/+ (transfused + apoTf) mice (Figure 9B and 9G). Kidney tissue sections from WT (saline) mice showed no visible iron deposition (Figure 9D). However, kidney tissue sections from Hbbth3/+ (saline) and Hbbth3/+ (transfused) mice showed progressively increasing proximal and distal tubule iron deposition within the renal cortex (Figure 9I,J). Iron deposition in renal cortical tissue was reduced in Hbbth3/+ (transfused + apoTf) mice (Figure 9C and 9K).
Figure 9.
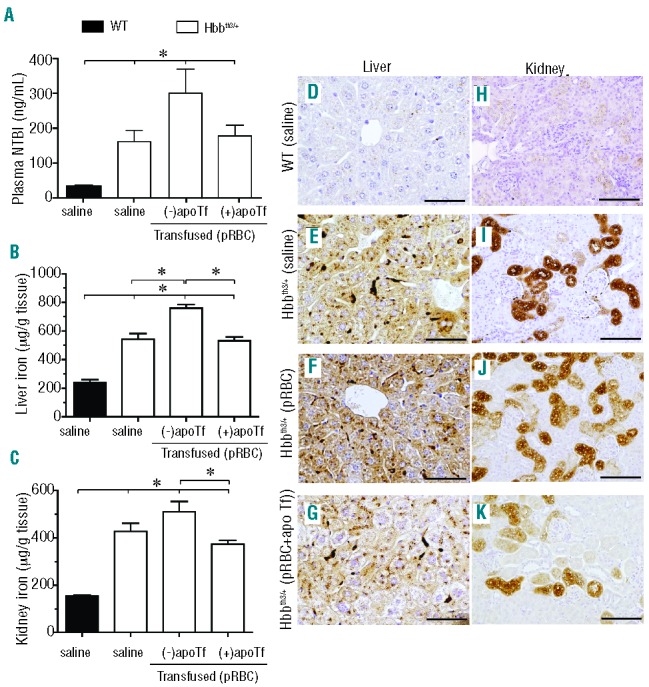
Effects of apoTf on transfusion-related iron availability and tissue iron deposition in Hbbth3/+ mice. Data are shown for (A) plasma NTBI; (B) liver iron content; and (C) kidney iron content. Errors bars represent the SEM. Statistical significance is set at a P value <0.05, indicated in panels (A), (B) and (C) as a ∗ for significant differences between time points and groups. Light microscopy images of Perls DAB non-heme iron staining of liver tissue sections for (D) WT (saline) mice; (E) Hbbth3/+ (saline) mice; (F) Hbbth3/+ (packed red blood cells, pRBC) mice; (G) Hbbth3/+ (pRBC + apoTf) mice. Light microscopy images of Perls DAB non-heme iron staining of kidney tissue sections for (H) WT (saline) mice; (I) Hbbth3/+ (saline) mice; (J) Hbbth3/+ (pRBC) mice; (K) Hbbth3/+ (pRBC + apoTf) mice; 20× magnification, scale bars 200 μm.
As shown in Figure 5, expression of ferritin light and heavy chain in both liver and kidney increased in Hbbth3/+ (saline) mice compared to WT mice. After multiple transfusions in Hbbth3/+ mice, ferritin light and heavy chain expression increased further, consistent with transfusion-dependent excess iron loading. We show data for liver ferritin light and heavy chain expression in WT (saline), Hbbth3/+ (saline), Hbbth3/+ (transfused) and Hbbth3/+ (transfusion + apoTf) mice (Figure 10A,B). Consistent with plasma NTBI and liver iron the transfusion-triggered increase of liver ferritin was controlled by daily apoTf administration.
Figure 10.
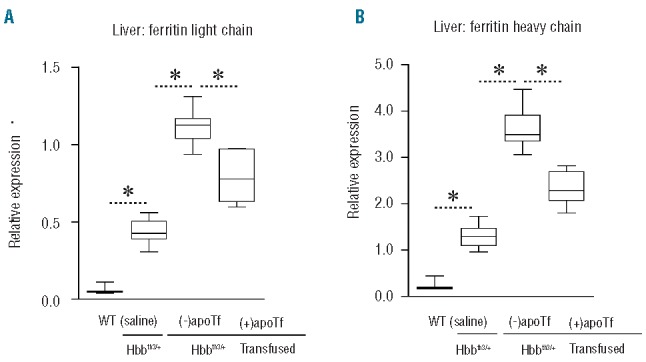
Effects of apoTf on hepatic ferritin light and heavy chain regulation in transfused Hbbth3/+ mice. Data are shown for: (A) liver ferritin light chain; and (B) liver ferritin heavy chain, which were both measured by SIM LC-MS/MS. Data are represented as box plots with the following group sizes: WT (n=9), saline-treated Hbbth3/+ (n=9), erythrocyte transfused Hbbth3/+ without apoTF treatment (n=7), erythrocyte transfused Hbbth3/+ + apoTf treatment (n=7). Statistical significance is set at a P value <0.05 indicated in panels (A) and (B) as a ∗ for between-group comparisons.
Discussion
In the present study we characterized how apoTf administration to non-transfused and transfused Hbbth3/+ mice modulates iron metabolic pathways and tissue iron deposition. We confirm the findings of Li et al.10 with regard to apoTf-mediated partial reversal of anemia, decrease in spleen size, increase in hepcidin gene expression (HAMP) and a subsequent increase in ferroportin-1 degradation in liver macrophages. The study by Li et al.10 also showed important results regarding red blood cell survival, erythroid differentiation and functional differences in erythrocytes. The findings of the present study expand on these results and demonstrate decreased iron loading in the liver, kidney and heart in apoTf-treated Hbbth3/+ mice. These effects of apoTf were associated with a decrease of the erythroid hepcidin suppressor Fam132b (ERFE), enhanced hepcidin expression in the liver and attenuated expression of ferroportin-1 in the duodenum with a concomitant reduction of iron accumulation in the intestinal epithelium. In the present study we used novel targeted mass-spectrometry assays to directly measure the apoTf-mediated enhancement of the active hepcidin-25 peptide in plasma and the decrease of the major tissue iron storage protein, ferritin, in apoTf-treated thalassemic mice. The observation that early iron deposition-related morphological changes in the liver and kidney were prevented by apoTf treatment suggests that the effects of chronic apoTf therapy on iron metabolism may translate into prevention of organ dysfunction.
Transfusion is an important factor exacerbating iron loading in patients with hemolytic disorders. This study demonstrates that red blood cell transfusion to correct anemia in Hbbth3/+ mice also suppresses Fam132b (ERFE) and stimulates hepcidin gene expression. However, despite these beneficial adaptive responses, free iron increased in plasma following repeated transfusion and accumulated in the liver and kidney. The short-term administration of apoTf, concomitant with transfusion, corrected plasma NTBI and prevented liver and kidney iron accumulation and ferritin expression, such that these remained at pre-transfusion levels. Collectively our data support the work of Li et al.10 in a different mouse model and further suggest a role for apoTf in the reduction of excessive intestinal iron acquisition, tissue iron deposition and secondary early pathological events that may occur in non-transfused and transfused β-thalassemic mice.
Murine models of β0-thalassemia have been reported, but have an extremely severe phenotype with short survival.12 For this reason we evaluated the effects of apoTf treatment in mice with heterozygous deletions of the b1/b2 genes that synthesize 50% of the β-globin in WT mice. Hbbth3/+ mice unequivocally showed erythroid expansion, high Tf saturation, plasma NTBI and tissue iron deposition at baseline.18,36
Non-transfused Hbbth3/+ mice administered apoTf had increased Tf levels, three to four times that of baseline, resulting in a decrease of Tf saturation from 80% (range 65–90%) in untreated Hbbth3/+ mice to the normal range of 20–40%. ApoTf treatment in Hbbth3/+ mice restored and maintained low NTBI at the level in WT (saline) mice. This appeared to be consistent with decreased splenic, hepatic, cardiac and renal iron deposition based on absolute quantification of iron (per gram of tissue), the visual distribution of iron following non-heme iron staining of tissue sections, as well as tissue ferritin. The most dramatic increase in the amount and distribution of iron in Hbbth3/+ mice occurred in the spleen. This is likely a result of both erythrophagocytosis of damaged red blood cells as well as increased extramedullary erythropoiesis in the murine spleen, which leads to a multi-fold increase in iron turnover37 and persistent NTBI in the plasma once Tf saturation increases beyond normal levels.38 In addition to the gut, the spleen represents an important source of NTBI in β-thalassemia which can lead to non-splenic tissue iron loading and injury.38
Increased NTBI could lead to increased iron exposure and related tissue damage in the liver, heart and, potentially, the kidneys. We observed increased iron with quantitative assays and histopathology in all of these tissues in Hbbth3/+ mice. The observations that NTBI is transported into cardiomyocytes through L-type Ca2+ channels at rates exceeding 200-times that of Tf-bound iron34 and in murine hepatocytes through the Zip14/Slc39a14 zinc transporter39 support our findings of iron accumulation in the heart and liver. Renal accumulation of iron in our study was highly specific to proximal and distal tubules. Haptoglobin and hemopexin treatment could not prevent renal iron loading, suggesting that glomerular filtration of free hemoglobin and heme are not critical processes in renal iron loading in β-thalassemia. Similarly, urinary Tf excretion was only marginally increased during apoTf treatment. However, urine NTBI excretion, which was substantially increased in non-transfused Hbbth3/+ mice, was drastically reduced during apoTf administration. It is, therefore, likely that excess renal tubule iron exposure occurs by glomerular filtration of NTBI with subsequent iron import at the luminal tubule membranes.
We found that both the liver and kidney in Hbbth3/+ mice demonstrated pathological changes that co-localized with iron deposition. Light and heavy chain ferritin increased in Hbbth3/+ mouse liver and kidney consistent with iron overload. Iron content and tissue ferritin elevation in Hbbth3/+ mouse kidney and liver coincided with attenuation of pathology by apoTf. While periportal fibrosis can occur in murine models of β-thalassemia, we did not expect to see increased renal iron with abnormal distribution of nuclei, vacuolation and necrosis in epithelial cells of proximal and distal tubules. However, recent reviews as well as clinical and basic research suggest that renal disease may be a consequence of longer survival of patients.40–42 While several factors, including anemia-induced hypoxia, iron overload and iron chelation, may be responsible,41 it is logical that iron overload was the cause of the pathological changes in our model since chronic anemia is unlikely in intermediate Hbbth3/+ mice and no small molecule chelators were administered. We speculate that one cause of the reduction in tissue iron may be the ability of apoTf to decrease NTBI in the plasma and tissue parenchyma.
In transfused Hbbth3/+ mice, which received a total of five administrations of packed red blood cells as one 0.2 mL administration separated by 3-day intervals, we observed a trend toward normalization of mild to moderate anemia. However, at the end of the 2-week study, mice had already demonstrated elevated plasma NTBI, excess tissue iron deposition and tissue light and heavy chain ferritin levels in excess of those found in WT and non-transfused Hbbth3/+ mice. Conversely, mice treated with daily injections of apoTf showed complete normalization of mild to moderate anemia, with hemoglobin levels equal to those in WT mice, and no elevation in plasma NTBI, liver iron content or kidney iron content. Consistent with these observations hepatic ferritin expression in apoTf treated mice did not increase above levels found in non-transfused animals.
Several mechanisms may contribute to the fundamental changes of iron distribution and iron regulatory pathways that occur during apoTf treatment in non-transfused and transfused Hbbth3/+ mice.5 First of all, apoTf may act as an iron scavenger that reduces NTBI and thus limits uptake of free iron in parenchymal cells. This phenomenon may be most effective when large amounts of iron are accumulating acutely such as in our transfusion model. Li et al. speculated that excess availability of apoTf may redistribute iron within the plasma Tf pool, shifting the ratio of differic to monoferric transferrin in favor of the monoferric form.10 At a Tf saturation within the range measured in our apoTf-treated animals (≈30% saturation) monoferric Tf could be expected to be the most prevalent form of Tf. Monoferric Tf has a lower affinity for TfR1 and less capacity to deliver iron to erythropoietic progenitors. Administration of apoTf could, therefore, promote iron-restricted erythropoiesis with a substrate-limited decrease of potentially toxic heme and α-globin synthesis. Li et al. speculated that this mechanism may be responsible for the partial normalization of erythropoiesis. We further speculate that the iron released from tissues during the reversal of hemochromatosis contributes to this process via binding to apoTf and increasing the pool of plasma monoferric Tf. However, such a mechanism may not explain the more fundamental changes that we have observed in the iron regulatory erythroferone-hepcidin-ferroportin pathway, which appear to limit iron acquisition in the intestine and redistribution from macrophages. Tf is a regulator of erythroferone-hepcidin-ferroportin via signaling through TfR2, which is expressed as an “iron sensor” on hepatocytes and erythroid progenitors.43–45 On erythroid progenitors Tf-TfR2 interactions appear to directly modulate erythropoietin signaling and downstream expression of erythroferrone.46 Details of how apoTf administration modulates this pathway in thalassemia need to be resolved in future studies. Furthermore, other iron regulatory hormones, such as the erythroid-derived hepcidin suppressor growth differentiation factor 15 (Gdf15), may be regulated by apoTf either directly via signaling through erythoid TfR2 or indirectly via normalization of ineffective erythropoiesis.47
In conclusion, we suggest that apoTf is a promising agent to prevent tissue iron accumulation and slow the progression of disease in subjects with non-transfusion dependent β-thalassemia and β-thalassemia requiring intermittent transfusions.
Acknowledgments
We thank Nathan Brinkman and his research group, CSL Behring, for purification of apotransferrin, hemopexin and haptoglobin from human plasma and the efforts of Sandeep N. Shah and Emily M.A. Lewis, FDA in contributing to the maintenance of the Hbbth3 mouse colony.
Footnotes
The online version of this article has a Supplementary Appendix
Funding
This work was supported by FDA internal funding to PWB and JV and by the Swiss National Science Foundation (grants 310030/120658 and 31003A/138500 to DJS), the University of Zurich Research Priority Program “Integrative Human Physiology” and the Swiss Federal Commission for Technology and Innovation (CTI).
Authorship and Disclosures
Information on authorship, contributions, and financial & other disclosures was provided by the authors and is available with the online version of this article at www.haematologica.org. The findings and conclusions in this article have not been formally disseminated by the Food and Drug Administration and should not be construed to represent any Agency determination or policy.
References
- 1.Rund D, Rachmilewitz E. Beta-thalassemia. N Engl J Med. 2005;353(11):1135–1146. [DOI] [PubMed] [Google Scholar]
- 2.Yu X, Kong Y, Dore LC, et al. An erythroid chaperone that facilitates folding of alphaglobin subunits for hemoglobin synthesis. J Clin Invest. 2007;117(7):1856–1865. [DOI] [PMC free article] [PubMed] [Google Scholar]
- 3.Mannu F, Arese P, Cappellini MD, et al. Role of hemichrome binding to erythrocyte membrane in the generation of band-3 alterations in beta-thalassemia intermedia erythrocytes. Blood. 1995;86(5):2014–2020. [PubMed] [Google Scholar]
- 4.Mathias LA, Fisher TC, Zeng L, et al. Ineffective erythropoiesis in beta-thalassemia major is due to apoptosis at the polychromatophilic normoblast stage. Exp Hematol. 2000;28(12):1343–1353. [DOI] [PubMed] [Google Scholar]
- 5.Ginzburg Y, Rivella S. Beta-thalassemia: a model for elucidating the dynamic regulation of ineffective erythropoiesis and iron metabolism. Blood. 2011;118(16):4321–4330. [DOI] [PMC free article] [PubMed] [Google Scholar]
- 6.Ganz T, Nemeth E. Hepcidin and disorders of iron metabolism. Annu Rev Med. 2011;62:347–360. [DOI] [PubMed] [Google Scholar]
- 7.Libani IV, Guy EC, Melchiori L, et al. Decreased differentiation of erythroid cells exacerbates ineffective erythropoiesis in beta-thalassemia. Blood. 2008;112(3):875–885. [DOI] [PMC free article] [PubMed] [Google Scholar]
- 8.Gardenghi S, Ramos P, Marongiu MF, et al. Hepcidin as a therapeutic tool to limit iron overload and improve anemia in beta-thalassemic mice. J Clin Invest. 2010;120(12): 4466–4477. [DOI] [PMC free article] [PubMed] [Google Scholar]
- 9.Preza GC, Ruchala P, Pinon R, et al. Minihepcidins are rationally designed small peptides that mimic hepcidin activity in mice and may be useful for the treatment of iron overload. J Clin Invest. 2011;121(12):4880–4888. [DOI] [PMC free article] [PubMed] [Google Scholar]
- 10.Li H, Rybicki AC, Suzuka SM, et al. Transferrin therapy ameliorates disease in beta-thalassemic mice. Nat Med. 2010;16(2):177–182. [DOI] [PubMed] [Google Scholar]
- 11.May C, Rivella S, Callegari J, et al. Therapeutic haemoglobin synthesis in beta-thalassaemic mice expressing lentivirus-encoded human beta-globin. Nature. 2000;406(6791):82–86. [DOI] [PubMed] [Google Scholar]
- 12.Rivella S, May C, Chadburn A, Riviere I, Sadelain M. A novel murine model of Cooley anemia and its rescue by lentiviral-mediated human beta-globin gene transfer. Blood. 2003;101(8):2932–2039. [DOI] [PubMed] [Google Scholar]
- 13.Bowman BH, Yang FM, Adrian GS. Transferrin: evolution and genetic regulation of expression. Adv Genet. 1988;25:1–38. [DOI] [PubMed] [Google Scholar]
- 14.Huebers HA, Csiba E, Huebers E, Finch CA. Competitive advantage of diferric transferrin in delivering iron to reticulocytes. Proc Natl Acad Sci USA. 1983;80(1):300–304. [DOI] [PMC free article] [PubMed] [Google Scholar]
- 15.Goya N, Miyazaki S, Kodate S, Ushio B. A family of congenital atransferrinemia. Blood. 1972;40(2):239–245. [PubMed] [Google Scholar]
- 16.Kautz L, Jung G, Valore EV, Rivella S, Nemeth E, Ganz T. Identification of erythroferrone as an erythroid regulator of iron metabolism. Nat Genet. 2014;46(7): 678–684. [DOI] [PMC free article] [PubMed] [Google Scholar]
- 17.Kautz L, Jung G, Nemeth E, Ganz T. Erythroferrone contributes to recovery from anemia of inflammation. Blood. 2014;124(16):2569–2574. [DOI] [PMC free article] [PubMed] [Google Scholar]
- 18.Yang B, Kirby S, Lewis J, Detloff PJ, Maeda N, Smithies O. A mouse model for beta 0-thalassemia. Proc Natl Acad Sci USA. 1995;92(25):11608–11612. [DOI] [PMC free article] [PubMed] [Google Scholar]
- 19.Marro S, Barisani D, Chiabrando D, et al. Lack of haptoglobin affects iron transport across duodenum by modulating ferroportin expression. Gastroenterology. 2007;133(4):1261–1271. [DOI] [PubMed] [Google Scholar]
- 20.Marro S, Chiabrando D, Messana E, et al. Heme controls ferroportin1 (FPN1) transcription involving Bach1, Nrf2 and a MARE/ARE sequence motif at position - 7007 of the FPN1 promoter. Haematologica. 2010;95(8):1261–1268. [DOI] [PMC free article] [PubMed] [Google Scholar]
- 21.Prezelj M, Knap B. Automated assay for non-transferrin-bound iron in serum samples. Clin Chem Lab Med. 2010;48(10): 1427–1432. [DOI] [PubMed] [Google Scholar]
- 22.Kautz L, Nemeth E. Molecular liaisons between erythropoiesis and iron metabolism. Blood. 2014;124(4):479–482. [DOI] [PMC free article] [PubMed] [Google Scholar]
- 23.Yamanishi H, Iyama S, Yamaguchi Y, Kanakura Y, Iwatani Y. Total iron-binding capacity calculated from serum transferrin concentration or serum iron concentration and unsaturated iron-binding capacity. Clin Chem. 2003;49(1):175–178. [DOI] [PubMed] [Google Scholar]
- 24.Baek JH, D’Agnillo F, Vallelian F, et al. Hemoglobin-driven pathophysiology is an in vivo consequence of the red blood cell storage lesion that can be attenuated in guinea pigs by haptoglobin therapy. J Clin Invest. 2012;122(4):1444–1458. [DOI] [PMC free article] [PubMed] [Google Scholar]
- 25.Rochat B, Peduzzi D, McMullen J, et al. Validation of hepcidin quantification in plasma using LC-HRMS and discovery of a new hepcidin isoform. Bioanalysis. 2013;5(20):2509–2520. [DOI] [PubMed] [Google Scholar]
- 26.Muller-Eberhard U, Javid J, Liem HH, Hanstein A, Hanna M. Plasma concentrations of hemopexin, haptoglobin and heme in patients with various hemolytic diseases. Blood. 1968;32(5):811–815. [PubMed] [Google Scholar]
- 27.Nyman M. [Haptoglobin determination in serum, normal concentrations and relation to Smithies’ serum groups]. Clin Chim Acta. 1958;3(1):111–113. [DOI] [PubMed] [Google Scholar]
- 28.Cesta MF. Normal structure, function, and histology of the spleen. Toxicol Pathol. 2006;34(5):455–465. [DOI] [PubMed] [Google Scholar]
- 29.Musallam KM, Rivella S, Vichinsky E, Rachmilewitz EA. Non-transfusion-dependent thalassemias. Haematologica. 2013;98(6):833–844. [DOI] [PMC free article] [PubMed] [Google Scholar]
- 30.Zurlo MG, De Stefano P, Borgna-Pignatti C, et al. Survival and causes of death in thalassaemia major. Lancet. 1989;2(8653):27–30. [DOI] [PubMed] [Google Scholar]
- 31.Norden AG, Lapsley M, Lee PJ, et al. Glomerular protein sieving and implications for renal failure in Fanconi syndrome. Kidney Int. 2001;60(5):1885–1892. [DOI] [PubMed] [Google Scholar]
- 32.Oudit GY, Trivieri MG, Khaper N, et al. Taurine supplementation reduces oxidative stress and improves cardiovascular function in an iron-overload murine model. Circulation. 2004;109(15):1877–1885. [DOI] [PubMed] [Google Scholar]
- 33.Oudit GY, Trivieri MG, Khaper N, Liu PP, Backx PH. Role of L-type Ca2+ channels in iron transport and iron-overload cardiomyopathy. J Mol Med (Berl). 2006;84(5):349–364. [DOI] [PMC free article] [PubMed] [Google Scholar]
- 34.Oudit GY, Sun H, Trivieri MG, et al. L-type Ca2+ channels provide a major pathway for iron entry into cardiomyocytes in iron-overload cardiomyopathy. Nat Med. 2003;9(9):1187–1194. [DOI] [PubMed] [Google Scholar]
- 35.Geifman N, Rubin E. The mouse age phenome knowledgebase and disease-specific inter-species age mapping. PLoS One. 2013;8(12):e81114. [DOI] [PMC free article] [PubMed] [Google Scholar]
- 36.Ciavatta DJ, Ryan TM, Farmer SC, Townes TM. Mouse model of human beta zero thalassemia: targeted deletion of the mouse beta maj- and beta min-globin genes in embryonic stem cells. Proc Natl Acad Sci USA. 1995;92(20):9259–9263. [DOI] [PMC free article] [PubMed] [Google Scholar]
- 37.Hershko C, Link G, Konijn AM, Ioav Cabantchik Z. Iron overload and chelation. Hematology. 2005;10(Suppl 1):171–173. [DOI] [PubMed] [Google Scholar]
- 38.Hershko C, Graham G, Bates GW, Rachmilewitz EA. Non-specific serum iron in thalassaemia: an abnormal serum iron fraction of potential toxicity. Br J Haematol. 1978;40(2):255–263. [DOI] [PubMed] [Google Scholar]
- 39.Liuzzi JP, Aydemir F, Nam H, Knutson MD, Cousins RJ. Zip14 (Slc39a14) mediates non-transferrin-bound iron uptake into cells. Proc Natl Acad Sci USA. 2006;103(37): 13612–13617. [DOI] [PMC free article] [PubMed] [Google Scholar]
- 40.Koliakos G, Papachristou F, Koussi A, et al. Urine biochemical markers of early renal dysfunction are associated with iron overload in beta-thalassaemia. Clin Lab Haematol. 2003;25(2):105–109. [DOI] [PubMed] [Google Scholar]
- 41.Musallam KM, Taher AT. Mechanisms of renal disease in beta-thalassemia. J Am Soc Nephrol. 2012;23(8):1299–1302. [DOI] [PubMed] [Google Scholar]
- 42.Zhou XJ, Laszik Z, Wang XQ, Silva FG, Vaziri ND. Association of renal injury with increased oxygen free radical activity and altered nitric oxide metabolism in chronic experimental hemosiderosis. Lab Invest. 2000;80(12):1905–1914. [DOI] [PubMed] [Google Scholar]
- 43.Forejtnikova H, Vieillevoye M, Zermati Y, et al. Transferrin receptor 2 is a component of the erythropoietin receptor complex and is required for efficient erythropoiesis. Blood. 2010;116(24):5357–5367. [DOI] [PubMed] [Google Scholar]
- 44.Gao J, Chen J, Kramer M, Tsukamoto H, Zhang AS, Enns CA. Interaction of the hereditary hemochromatosis protein HFE with transferrin receptor 2 is required for transferrin-induced hepcidin expression. Cell Metab. 2009;9(3):217–227. [DOI] [PMC free article] [PubMed] [Google Scholar]
- 45.Wallace DF, Summerville L, Subramaniam VN. Targeted disruption of the hepatic transferrin receptor 2 gene in mice leads to iron overload. Gastroenterology. 2007;132(1):301–310. [DOI] [PubMed] [Google Scholar]
- 46.Nai A, Lidonnici MR, Rausa M, et al. The second transferrin receptor regulates red blood cell production in mice. Blood. 2015;125(7):1170–1179. [DOI] [PMC free article] [PubMed] [Google Scholar]
- 47.Tanno T, Bhanu NV, Oneal PA, et al. High levels of GDF15 in thalassemia suppress expression of the iron regulatory protein hepcidin. Nat Med. 2007;13(9):1096–1101. [DOI] [PubMed] [Google Scholar]