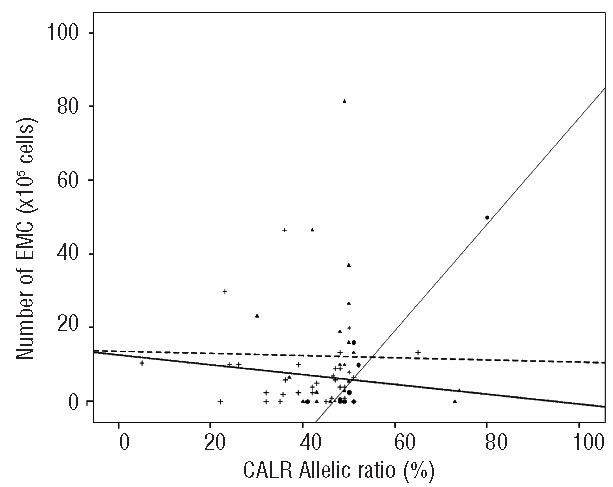
Figure 3.

Linear regression of CALR allelic burden according to number of endogenous megakaryotic colonies (EMC). Each symbol represents a patient (respectively + for type 1, ▲for type 2, • for “variants”). Linear regression was done according to type of CALR mutations (- - - for type 1, ▪▪▪ for type 2 and - - - - for “variants”).
